Tutorials
Log in
Statistics Explained
menu
search
search
Navigation
Main page
Statistical themes
Glossary
Categories
Statistics 4 beginners
Tutorials
Help
Eurostat home
Education corner
Online publications
Regional yearbook
Sustainable development
Full list
Tools
User contributions
Logs
View user groups
Special pages
search
Navigation
Main page
Statistical themes
Glossary
Categories
Statistics 4 beginners
Tutorials
Help
Eurostat home
Education corner
Online publications
Regional yearbook
Sustainable development
Full list
Tools
User contributions
Logs
View user groups
Special pages
Navigation
Main page
Statistical themes
Glossary
Categories
Statistics 4 beginners
Tutorials
Help
Eurostat home
Education corner
Online publications
Regional yearbook
Sustainable development
Full list
Tools
User contributions
Logs
View user groups
Special pages
Uploads by Rikamju
This special page shows all uploaded files.
File list
Items per page:
20
50
100
250
500
Search for media name:
Username:
Include old versions of files
Go
Date
Name
Thumbnail
Size
Description
Versions
14:46, 15 January 2018
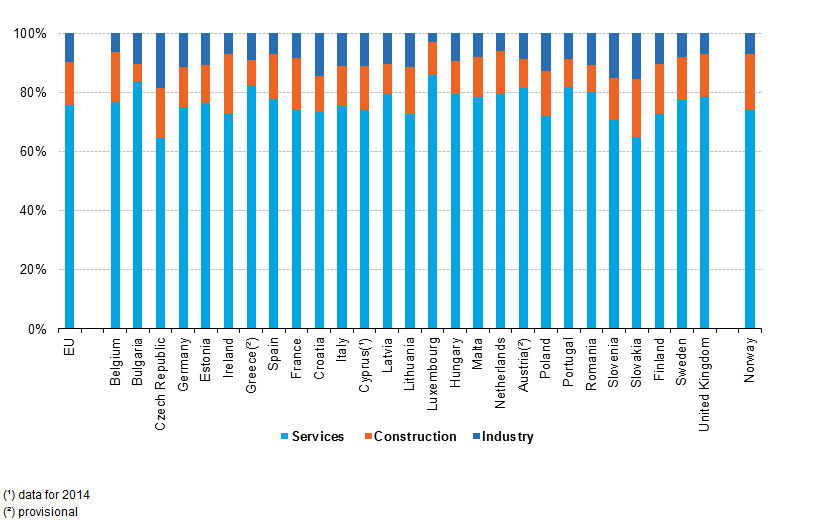
Figure 1 Structure of active enterprises by sector, business economy, 2015 (%).png
(
file
)
40 KB
1
14:50, 15 January 2018
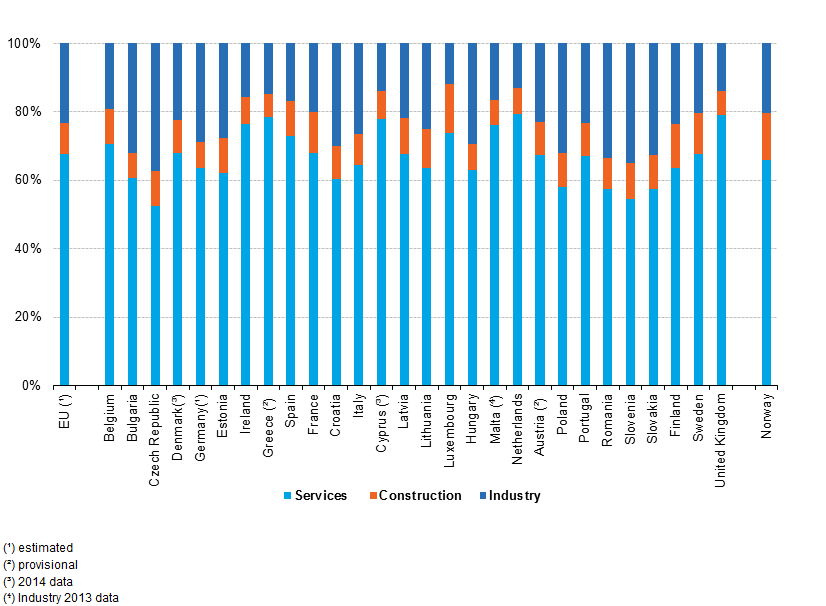
Figure 2 Structure of employment by sector, business economy, 2015 (%).png
(
file
)
45 KB
1
14:59, 15 January 2018
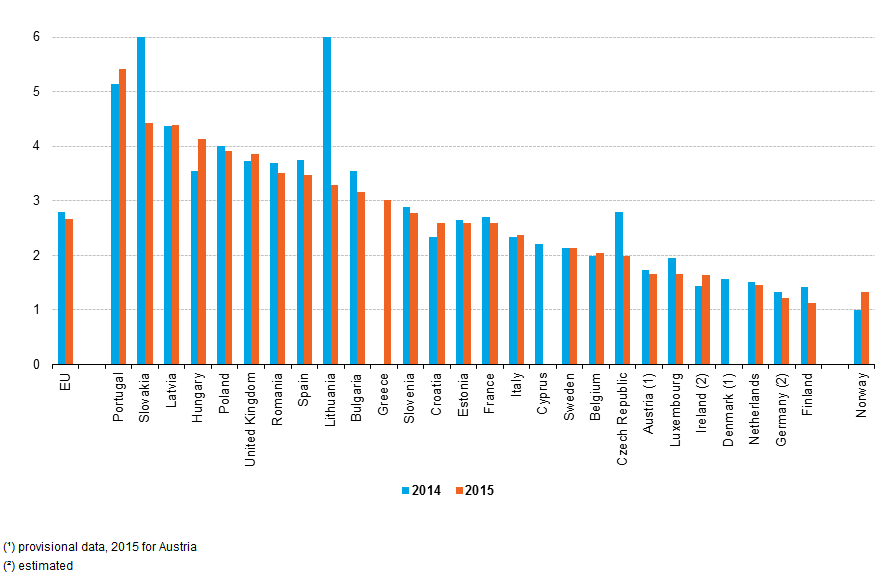
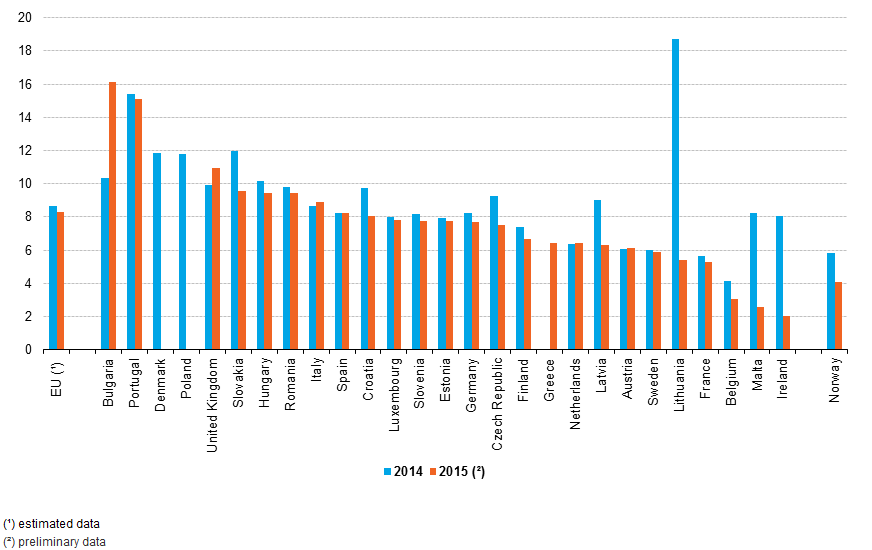
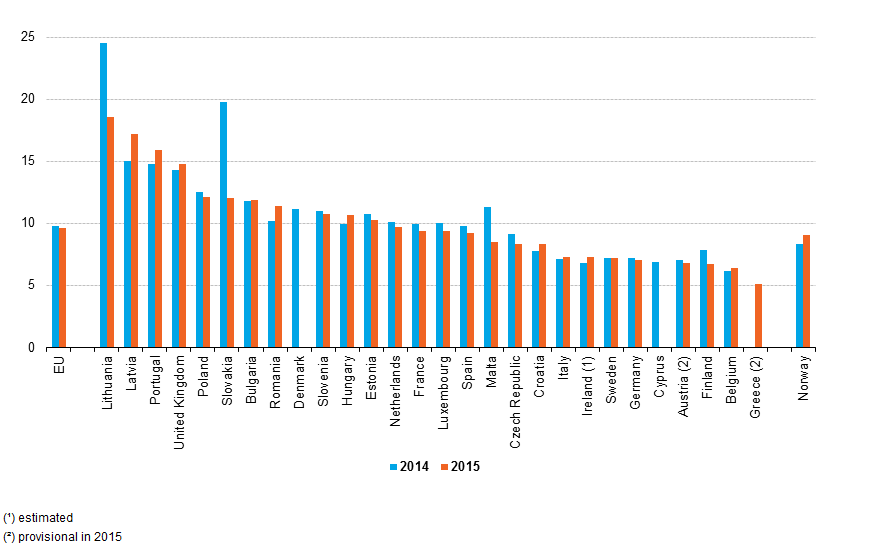
Figure 3 Enterprise birth rates, business economy, 2014 - 2015 (%) .png
(
file
)
32 KB
2
15:00, 15 January 2018
Figure 4 Employment share of enterprise births, business economy, 2014-2015 (%).png
(
file
)
37 KB
1
15:05, 15 January 2018
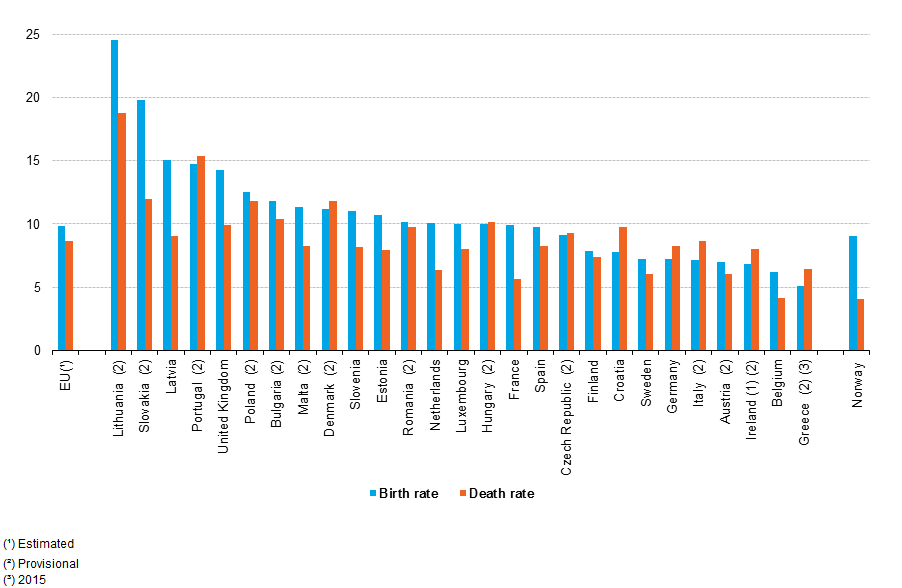
Figure 5 Enterprise birth and death rates, business economy, 2014 (%) .png
(
file
)
35 KB
2
15:08, 15 January 2018
Figure 6 Trend of enterprise death rates, business economy, 2014-2015 (%).png
(
file
)
35 KB
1
15:12, 15 January 2018
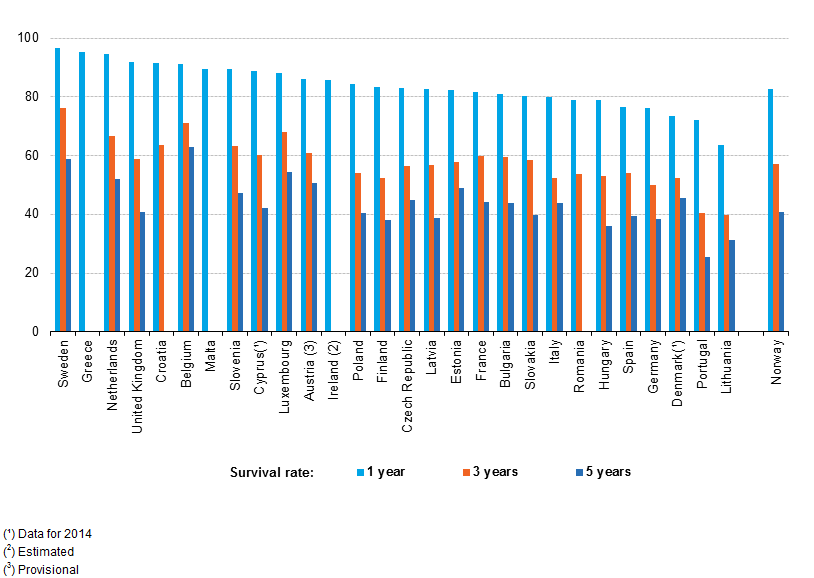
Figure 7 One, three and five-year survival rates of enterprises, business economy, 2015 (%) .png
(
file
)
39 KB
1
15:14, 15 January 2018
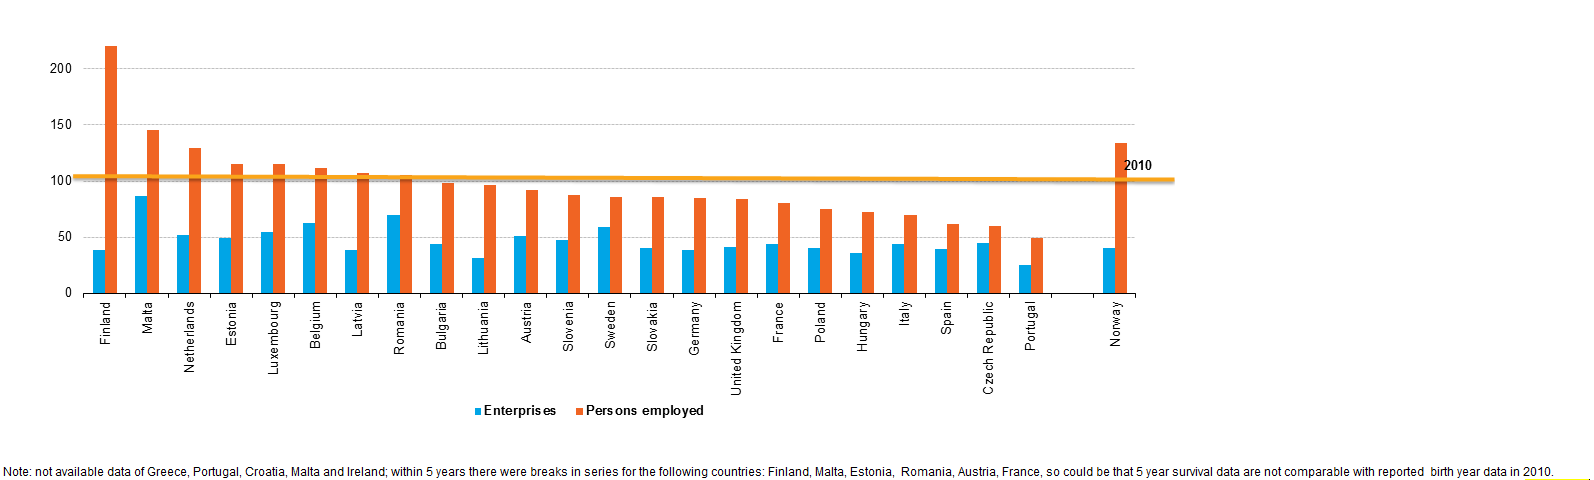
Figure 8 Enterprises surviving a five-year period, business economy, 2015 (%).png
(
file
)
34 KB
1
15:15, 15 January 2018
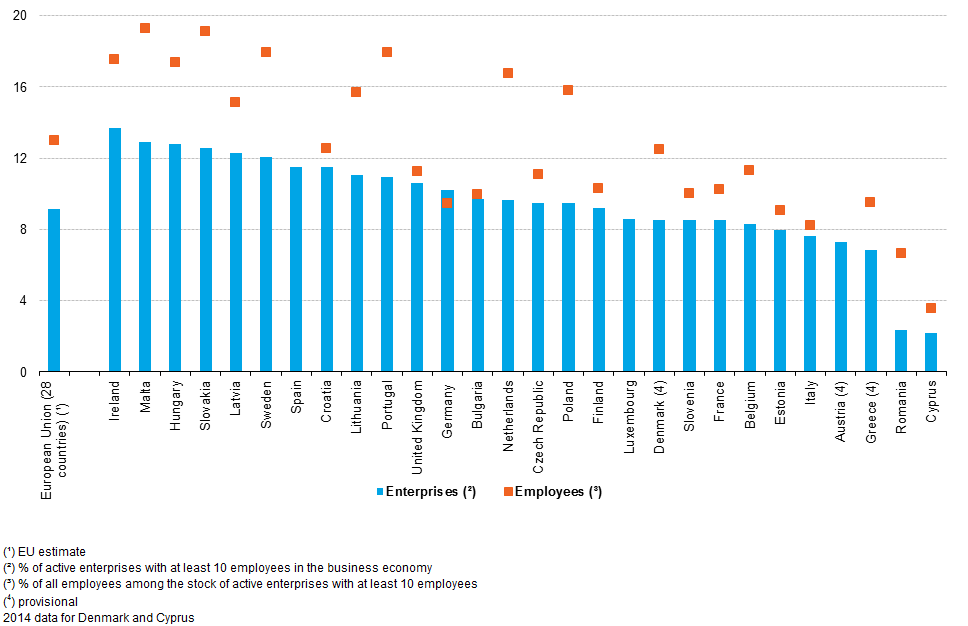
Figure 9 High-growth enterprise shares in EU Member States, 2015 (%) .png
(
file
)
37 KB
1
15:17, 15 January 2018
Figure 3Enterprise birth rates, business economy, 2014 - 2015 (%) .png
(
file
)
32 KB
1
15:18, 15 January 2018
Figure 5Enterprise birth and death rates, business economy, 2014 (%) .png
(
file
)
35 KB
1
15:35, 15 January 2018
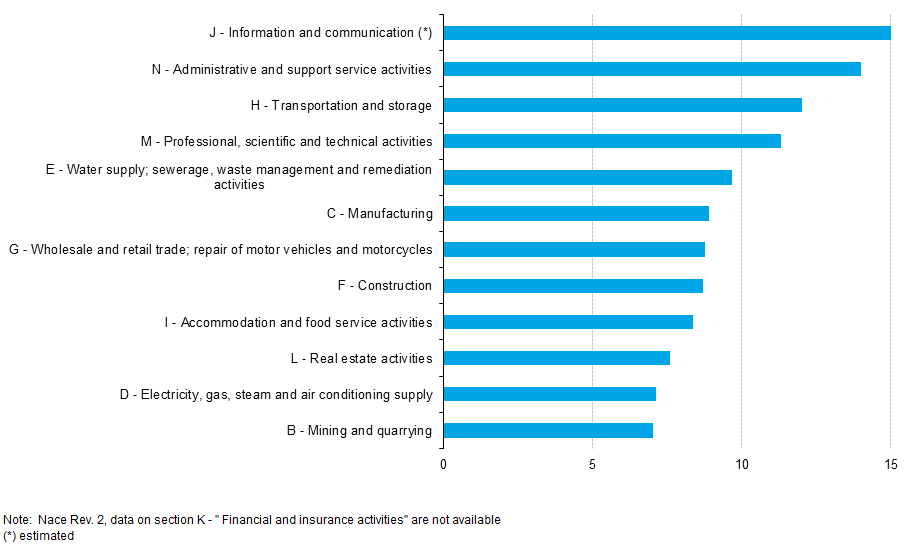
Figure 10 High-growth enterprise shares by economic sectors in the EU, 2015 (%) .png
(
file
)
23 KB
1
Special page
ISSN 2443-8219
.png)
.png)
_.png)
.png)
_.png)
.png)
_.png)
.png)
_.png)
_.png)
_.png)
_.png)