Tutorials
Log in
Statistics Explained
menu
search
search
Navigation
Main page
Statistical themes
Glossary
Categories
Statistics 4 beginners
Tutorials
Help
Eurostat home
Education corner
Online publications
Regional yearbook
Sustainable development
Full list
Tools
User contributions
Logs
View user groups
Special pages
search
Navigation
Main page
Statistical themes
Glossary
Categories
Statistics 4 beginners
Tutorials
Help
Eurostat home
Education corner
Online publications
Regional yearbook
Sustainable development
Full list
Tools
User contributions
Logs
View user groups
Special pages
Navigation
Main page
Statistical themes
Glossary
Categories
Statistics 4 beginners
Tutorials
Help
Eurostat home
Education corner
Online publications
Regional yearbook
Sustainable development
Full list
Tools
User contributions
Logs
View user groups
Special pages
Uploads by Pemarin
This special page shows all uploaded files.
File list
Items per page:
20
50
100
250
500
Search for media name:
Username:
Include old versions of files
Go
First page
Previous page
Next page
Last page
Date
Name
Thumbnail
Size
Description
Versions
10:53, 30 April 2021
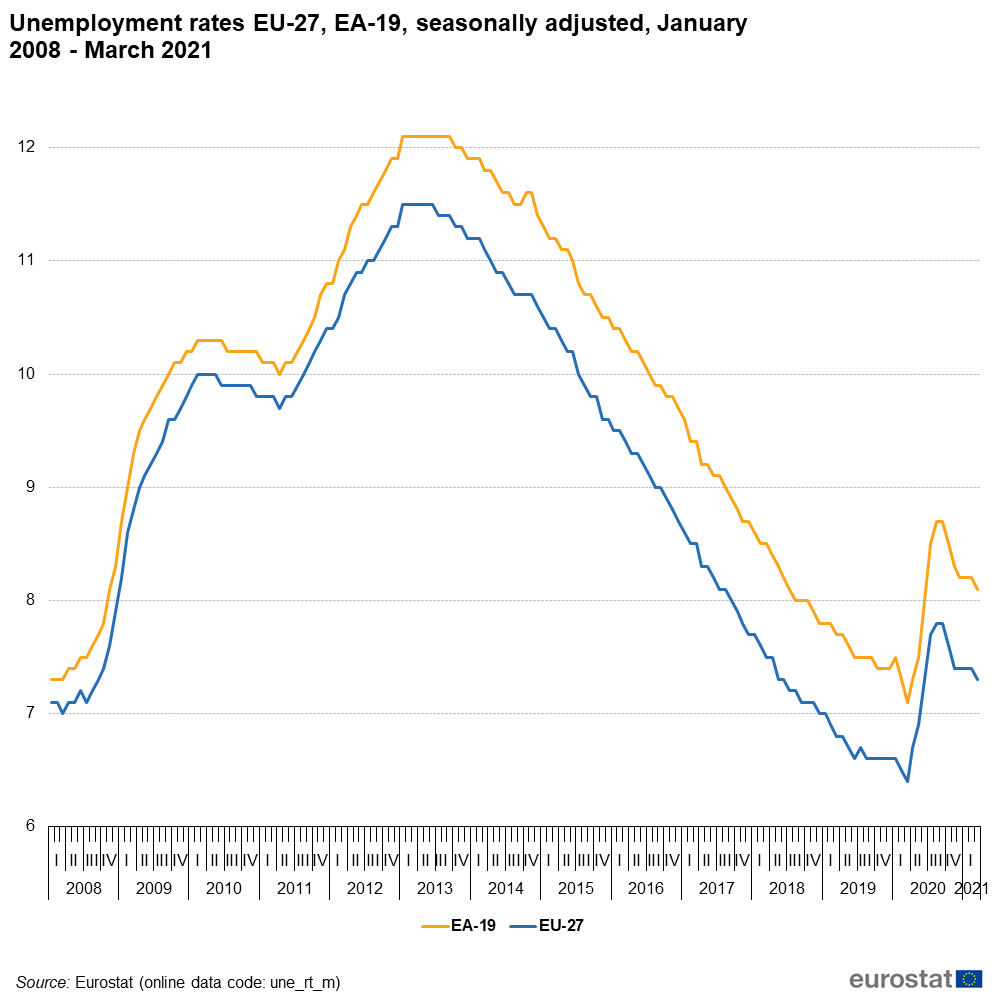
Unemployment rates EU-27, EA-19, seasonally adjusted, January 2008 - March 2021.png
(
file
)
66 KB
1
10:54, 30 April 2021
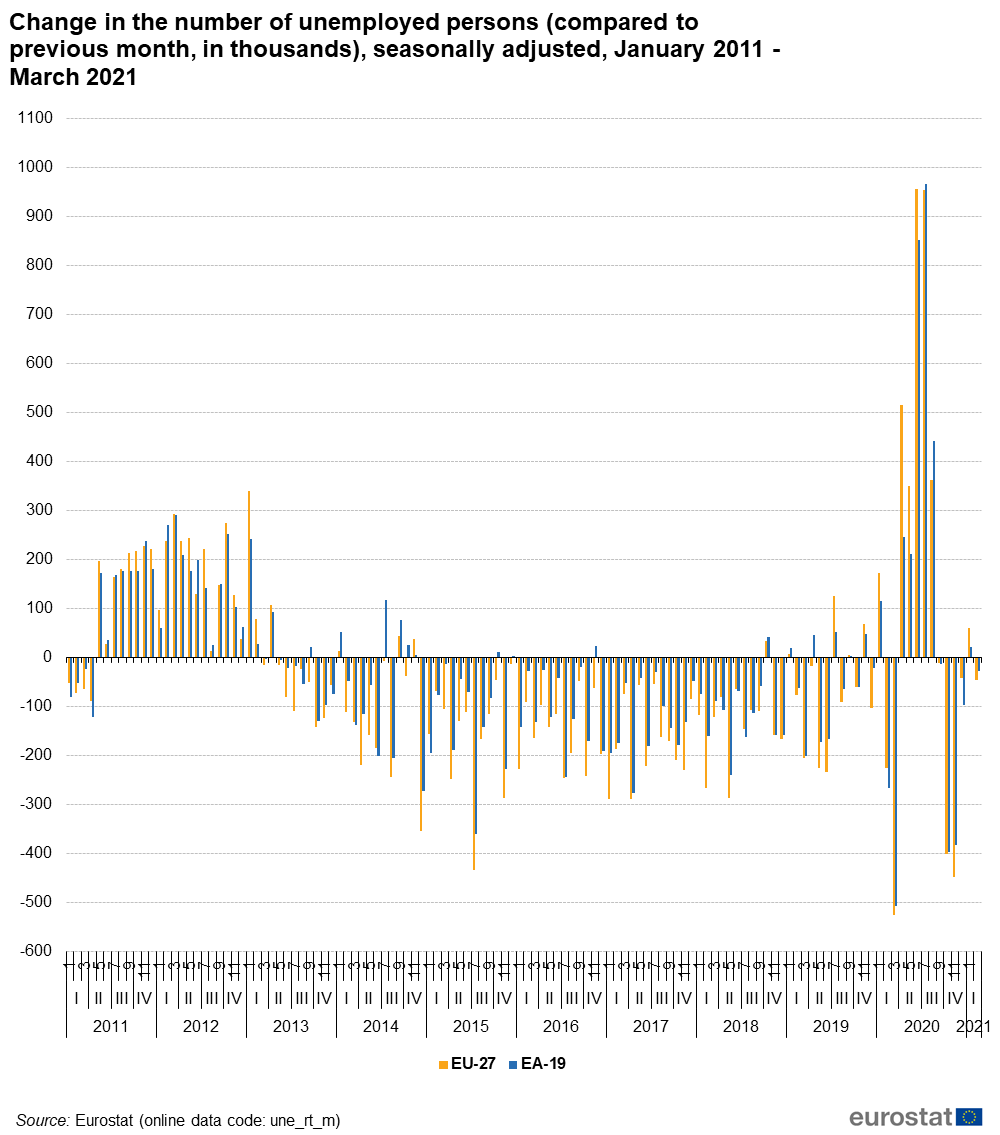
Change in the number of unemployed persons (compared to previous month, in thousands), seasonally adjusted, January 2011 - March 2021.png
(
file
)
75 KB
1
10:55, 30 April 2021
Unemployment rates EU-28, EA-19, seasonally adjusted, January 2008 - March 2021.png
(
file
)
66 KB
1
10:55, 30 April 2021
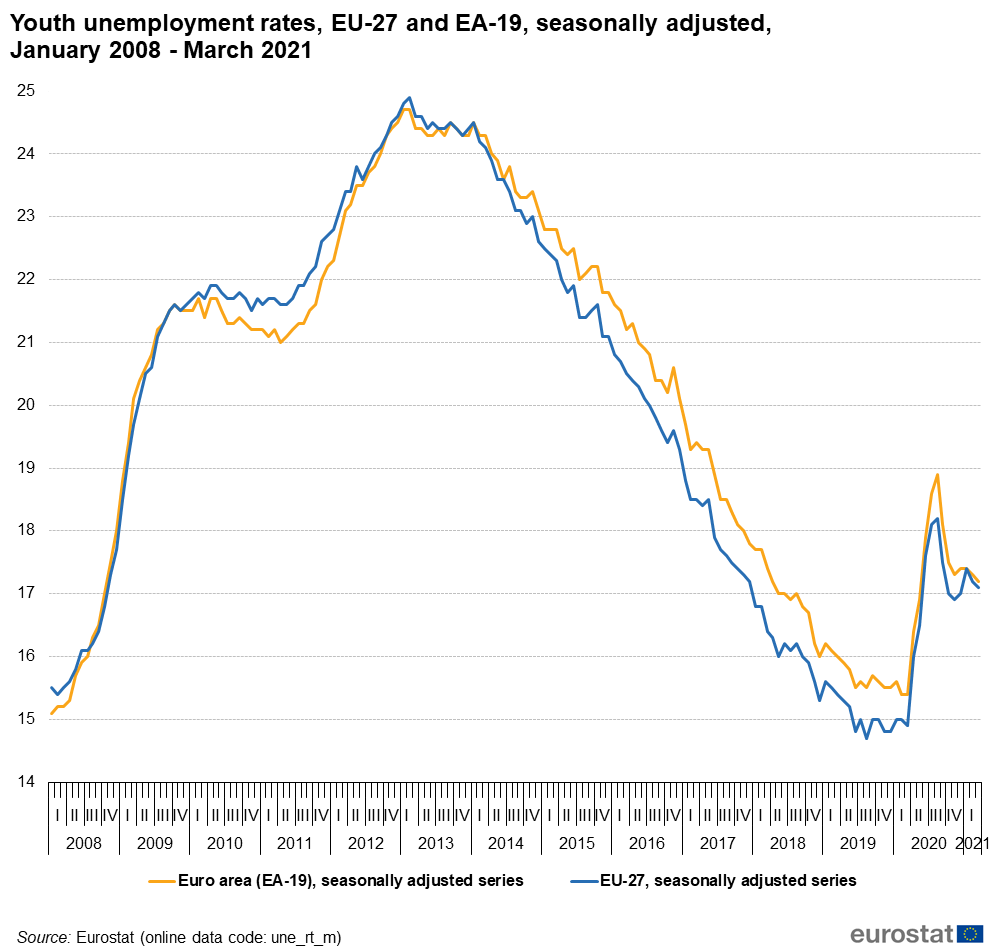
Youth unemployment rates, EU-27 and EA-19, seasonally adjusted, January 2008 - March 2021.png
(
file
)
80 KB
1
10:59, 1 July 2021
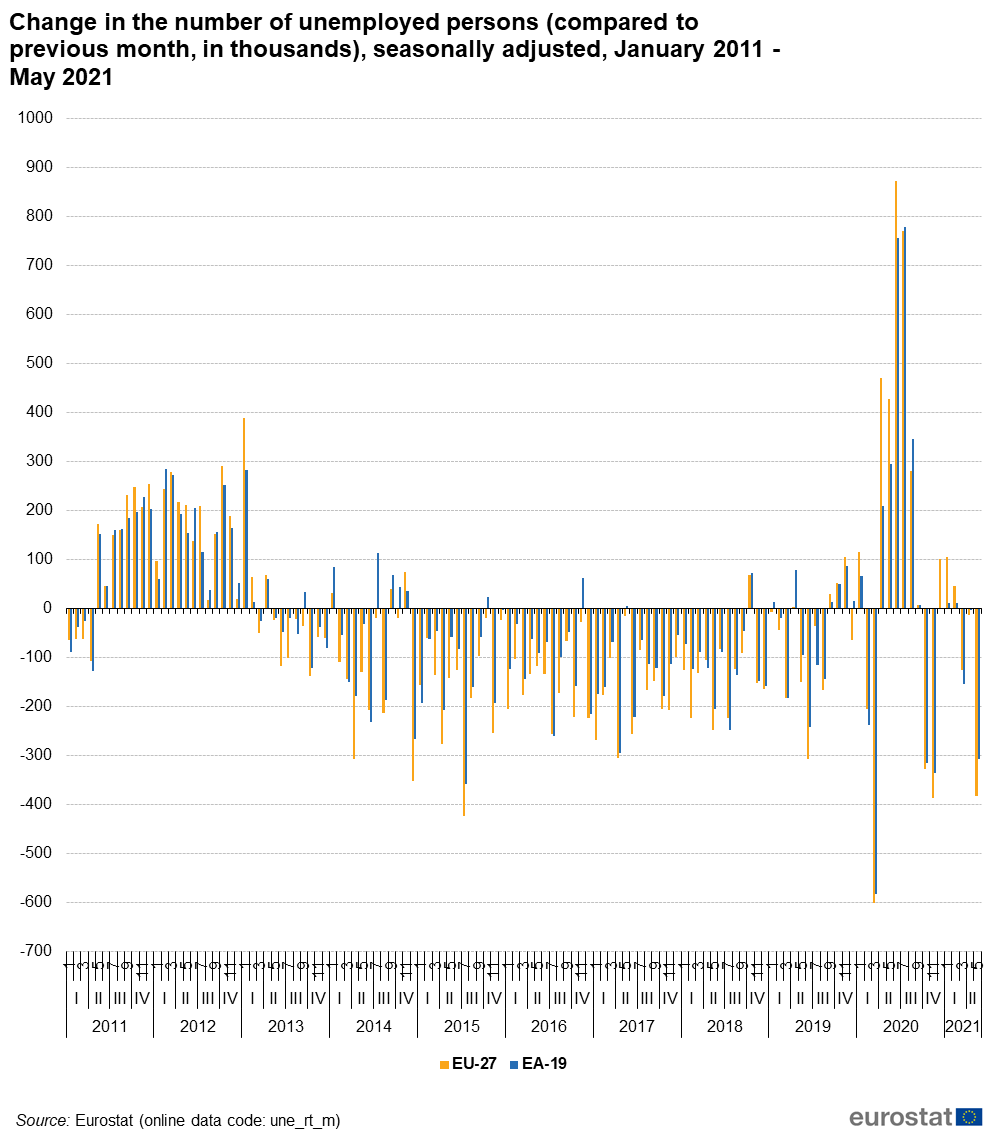
Change in the number of unemployed persons (compared to previous month, in thousands), seasonally adjusted, January 2011 - May 2021.png
(
file
)
78 KB
1
10:59, 1 July 2021
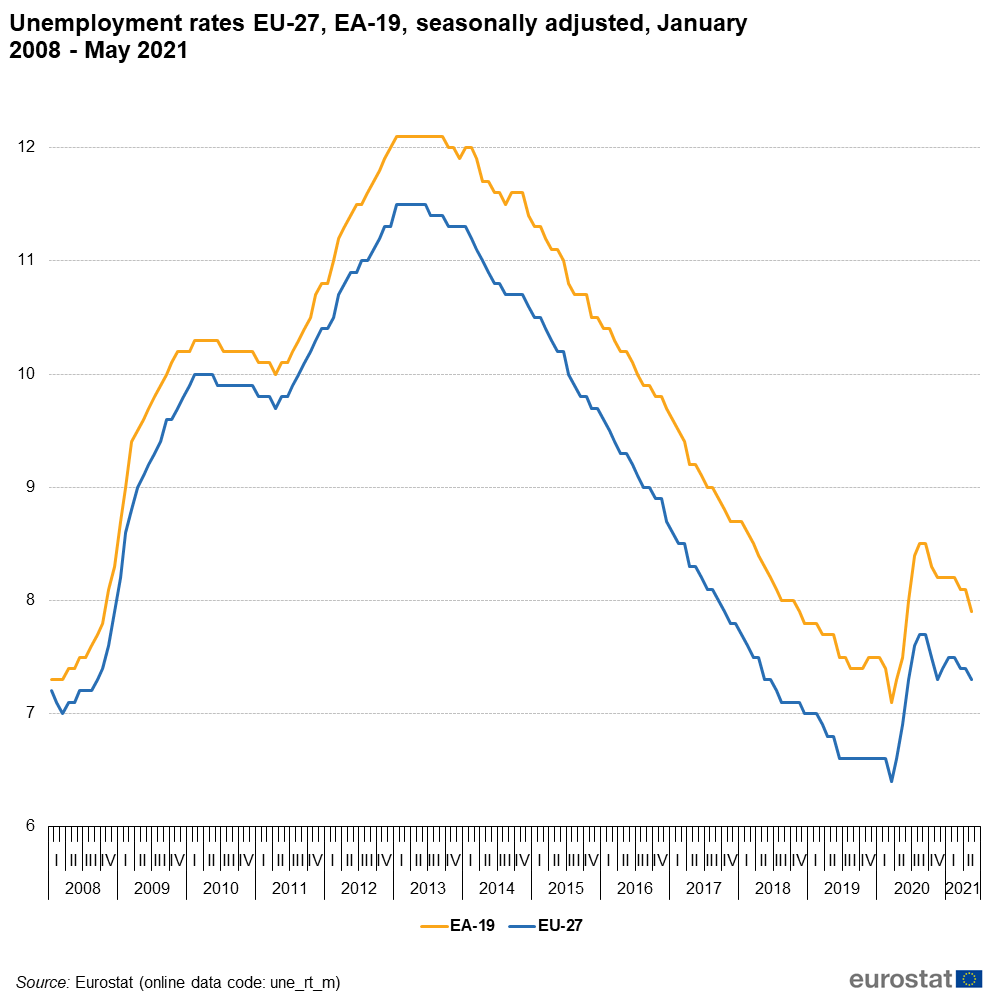
Unemployment rates EU-28, EA-19, seasonally adjusted, January 2008 - May 2021.png
(
file
)
65 KB
1
11:00, 1 July 2021
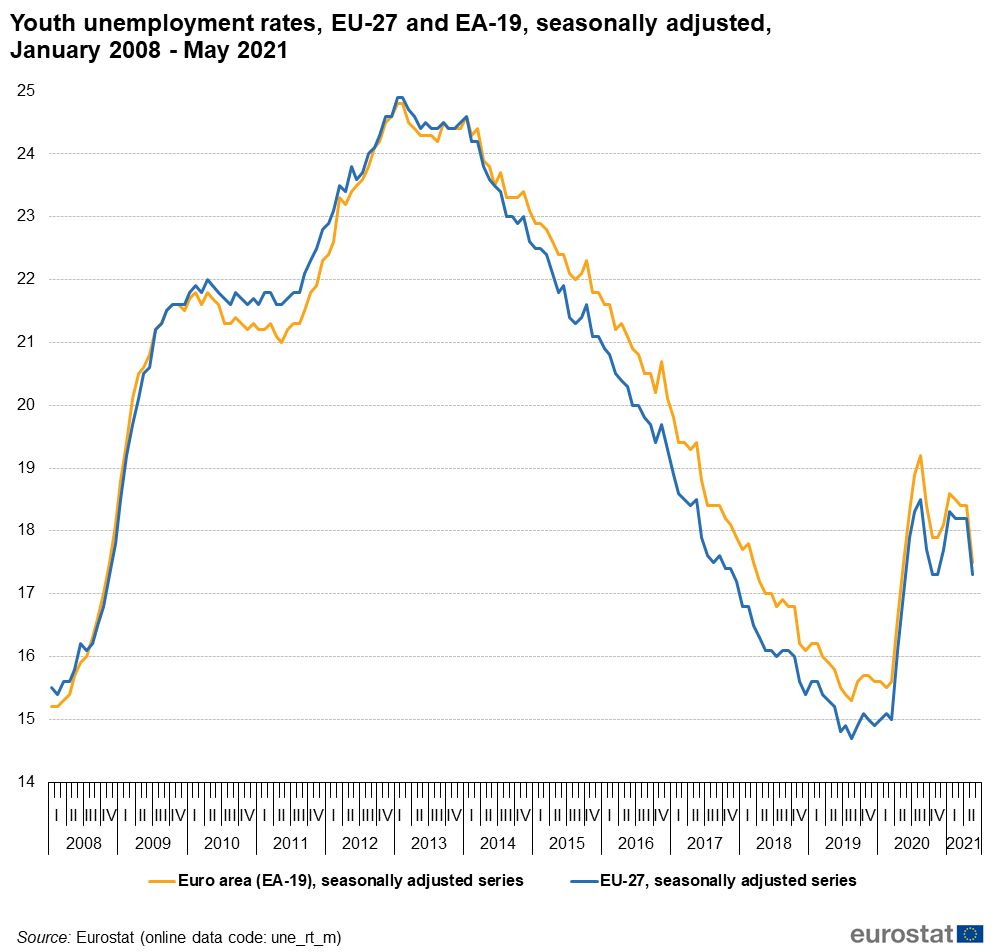
Youth unemployment rates, EU-27 and EA-19, seasonally adjusted, January 2008 - May 2021.png
(
file
)
80 KB
1
10:49, 30 July 2021
Unemployment rates EU-27 EA-19 seasonally adjusted January 2008 - June 2021 (002).png
(
file
)
66 KB
1
10:50, 30 July 2021
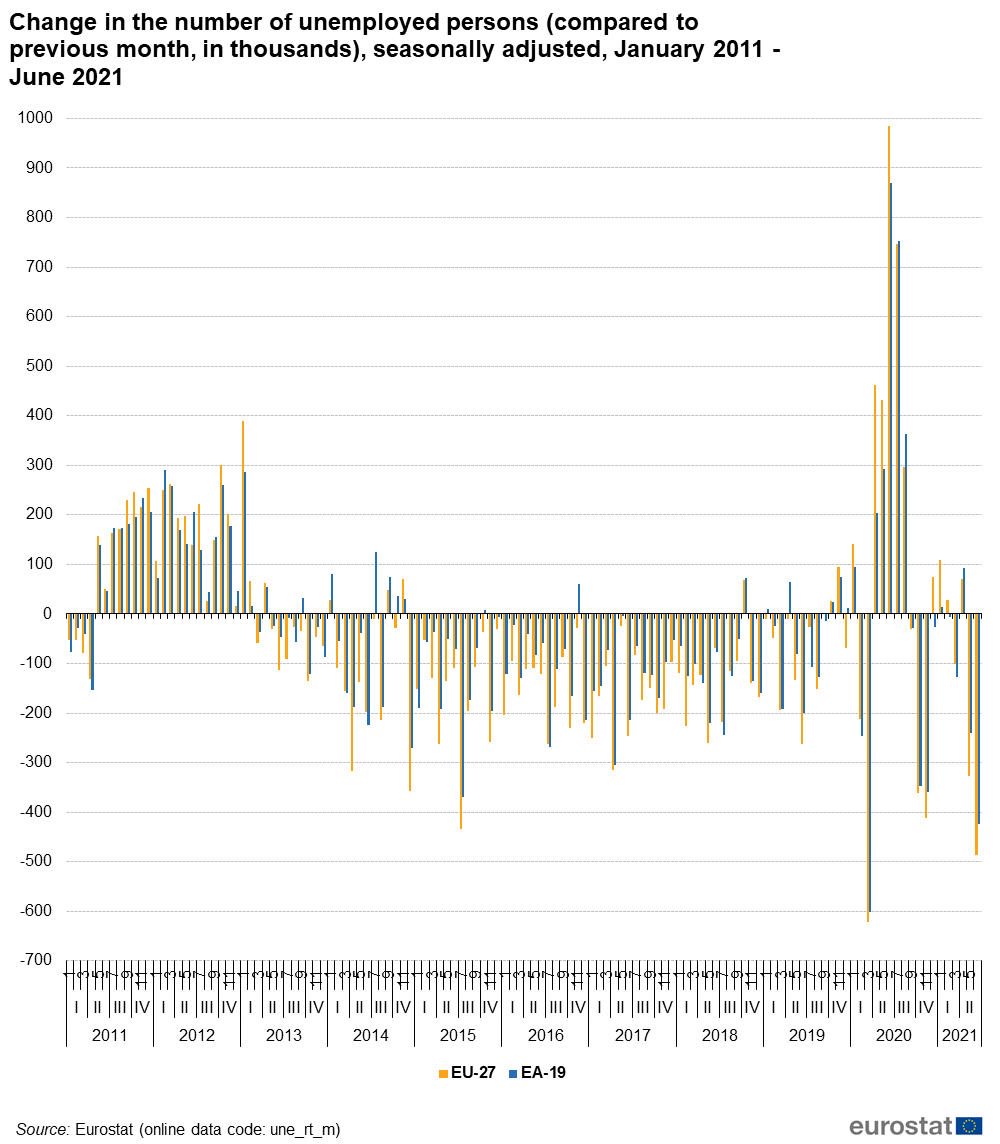
Change in the number of unemployed persons (compared to previous month, in thousands), seasonally adjusted, January 2011 - June 2021.png
(
file
)
81 KB
1
10:50, 30 July 2021
Youth unemployment rates, EU-27 and EA-19, seasonally adjusted, January 2008 - June 2021.png
(
file
)
81 KB
1
10:50, 30 July 2021
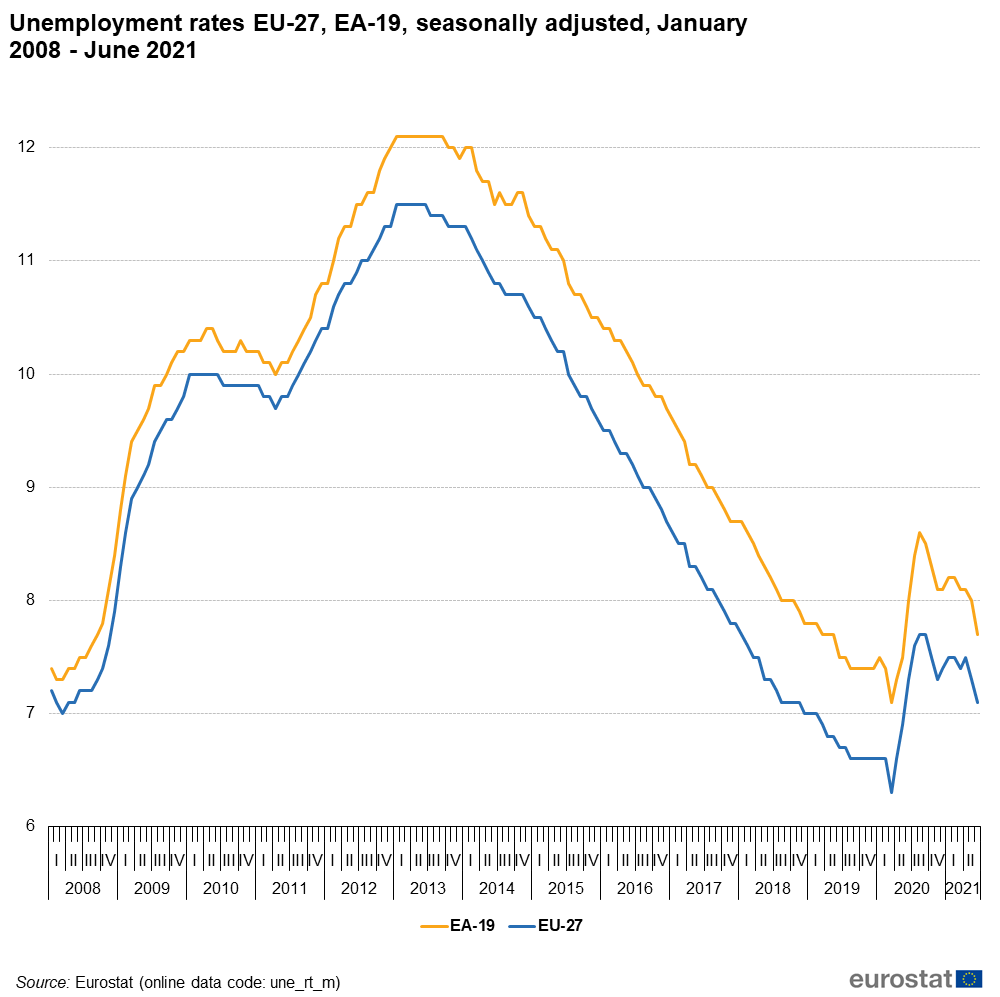
Unemployment rates EU-28, EA-19, seasonally adjusted, January 2008 - June 2021.png
(
file
)
66 KB
1
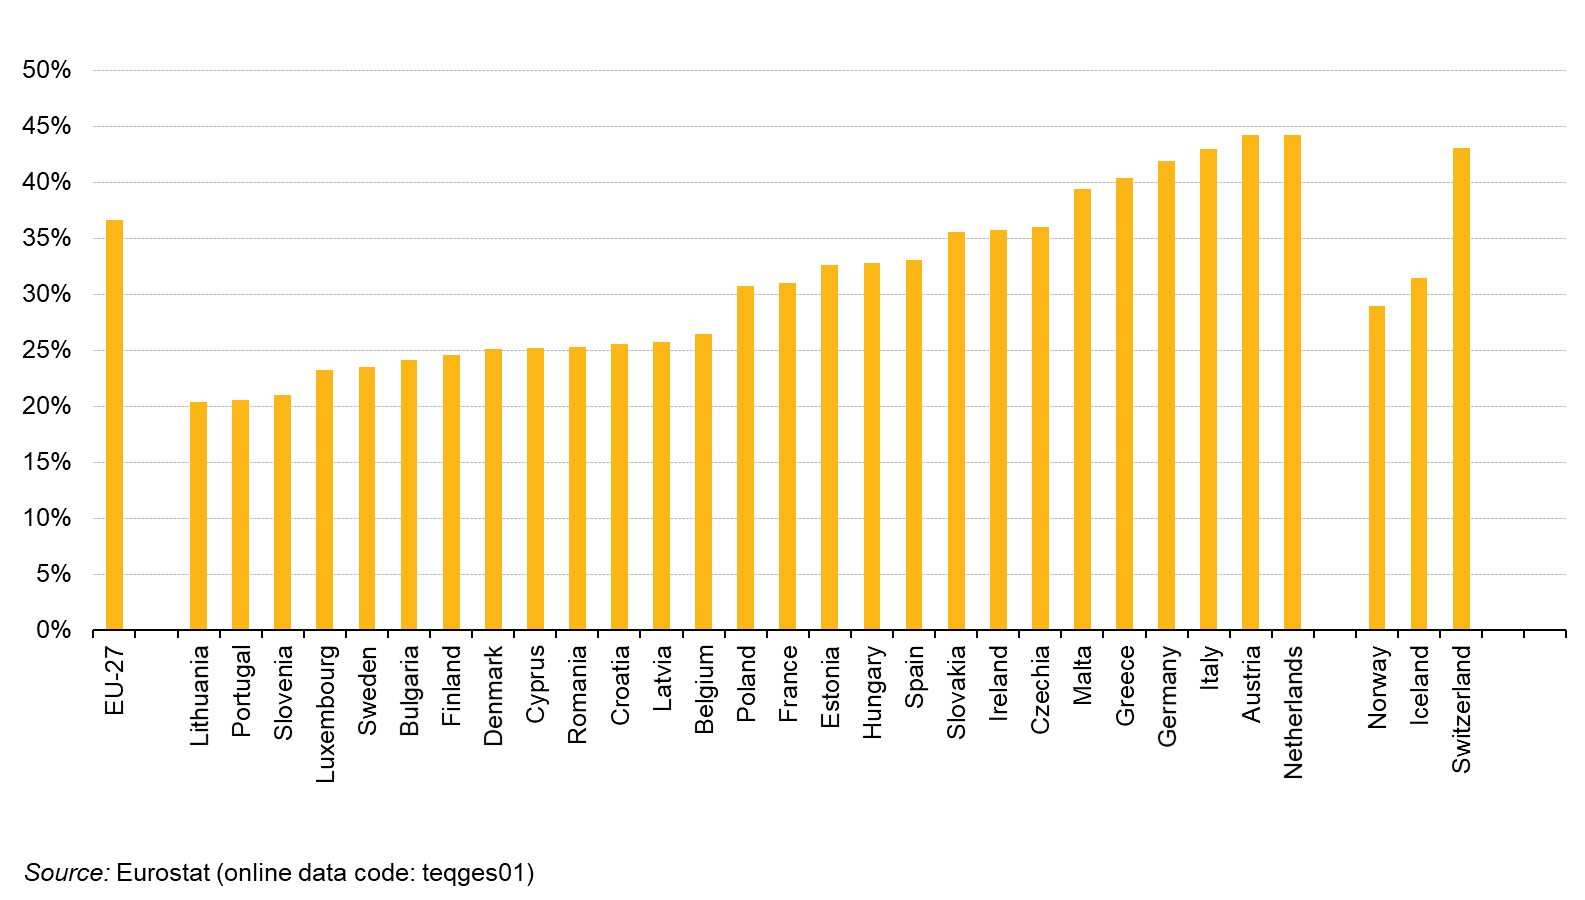
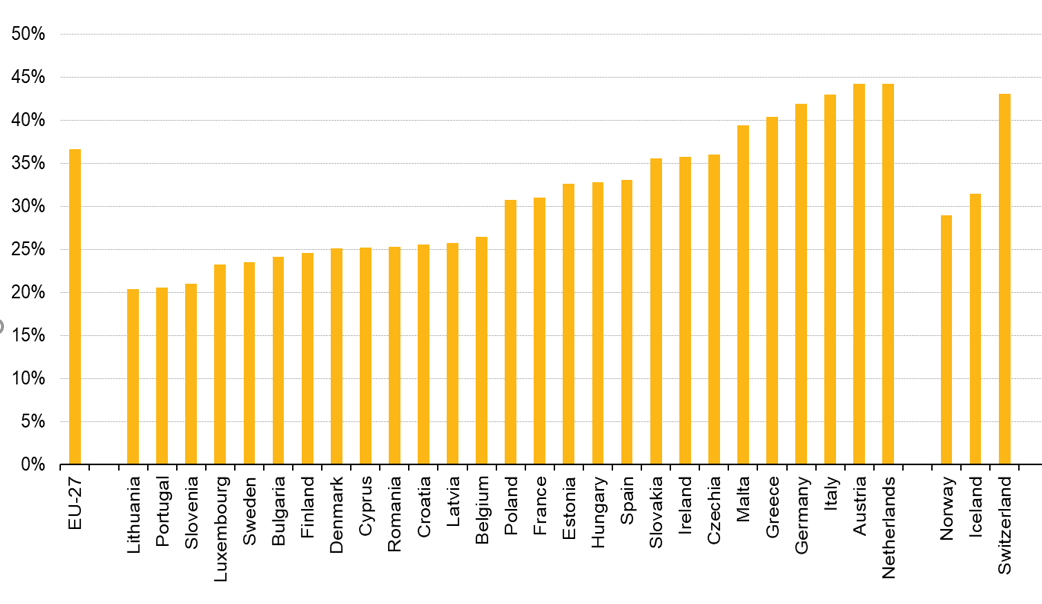
12:58, 11 November 2021
Ranking Unexplained Gender Pay Gap - 2018.png
(
file
)
337 KB
1
13:15, 11 November 2021
Decomposition Gender Pay Gap - 2018.png
(
file
)
80 KB
1
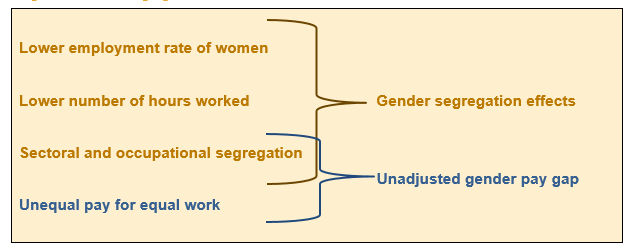
13:17, 11 November 2021
Seggregation effects.png
(
file
)
13 KB
1
13:20, 11 November 2021
Ranking GenderOverallEarningsGap - 2018.png
(
file
)
61 KB
1
13:27, 11 November 2021
Ranking Gender Overall Earnings Gap - 2018.png
(
file
)
82 KB
2
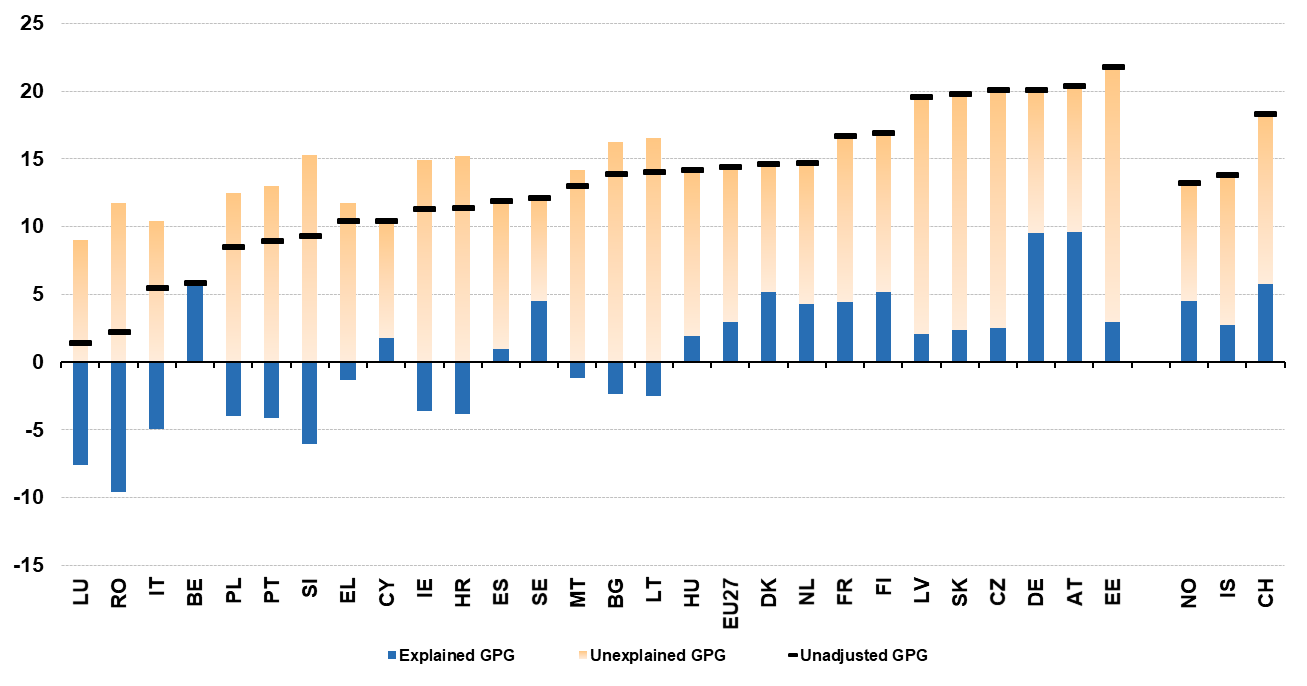
13:42, 15 November 2021
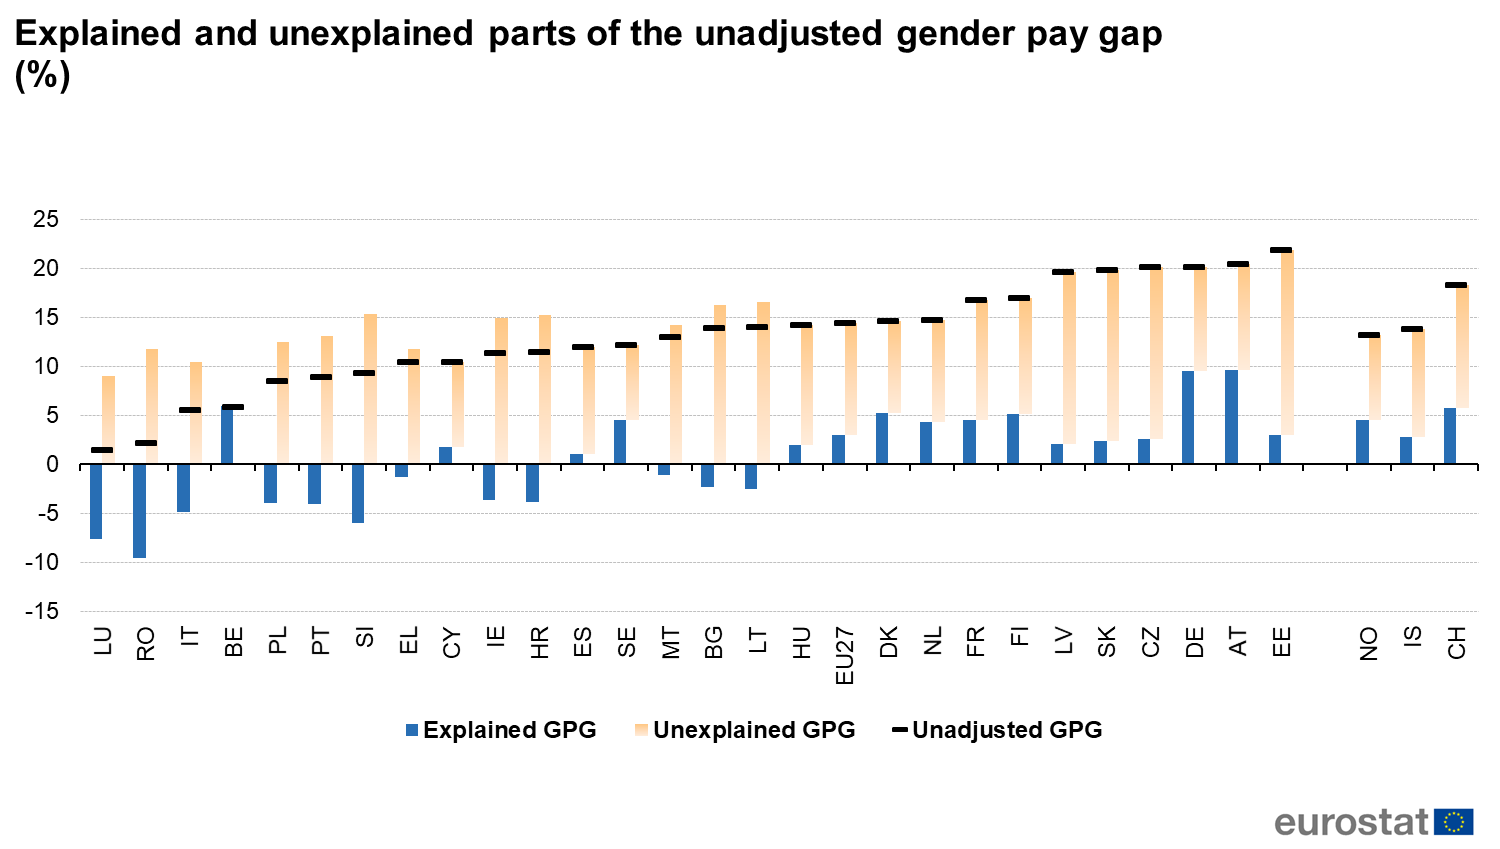
Figure 1 Explained and unexplained parts of the unadjusted gender pay gap - SES 2018.png
(
file
)
80 KB
1
13:47, 15 November 2021
Figure 3 Gender Overall Earnings Gap - SES2018 data.png
(
file
)
82 KB
1
13:47, 15 November 2021
Figure 2 Unexplained gender pay gap - SES2018 data.png
(
file
)
337 KB
1
13:01, 16 November 2021
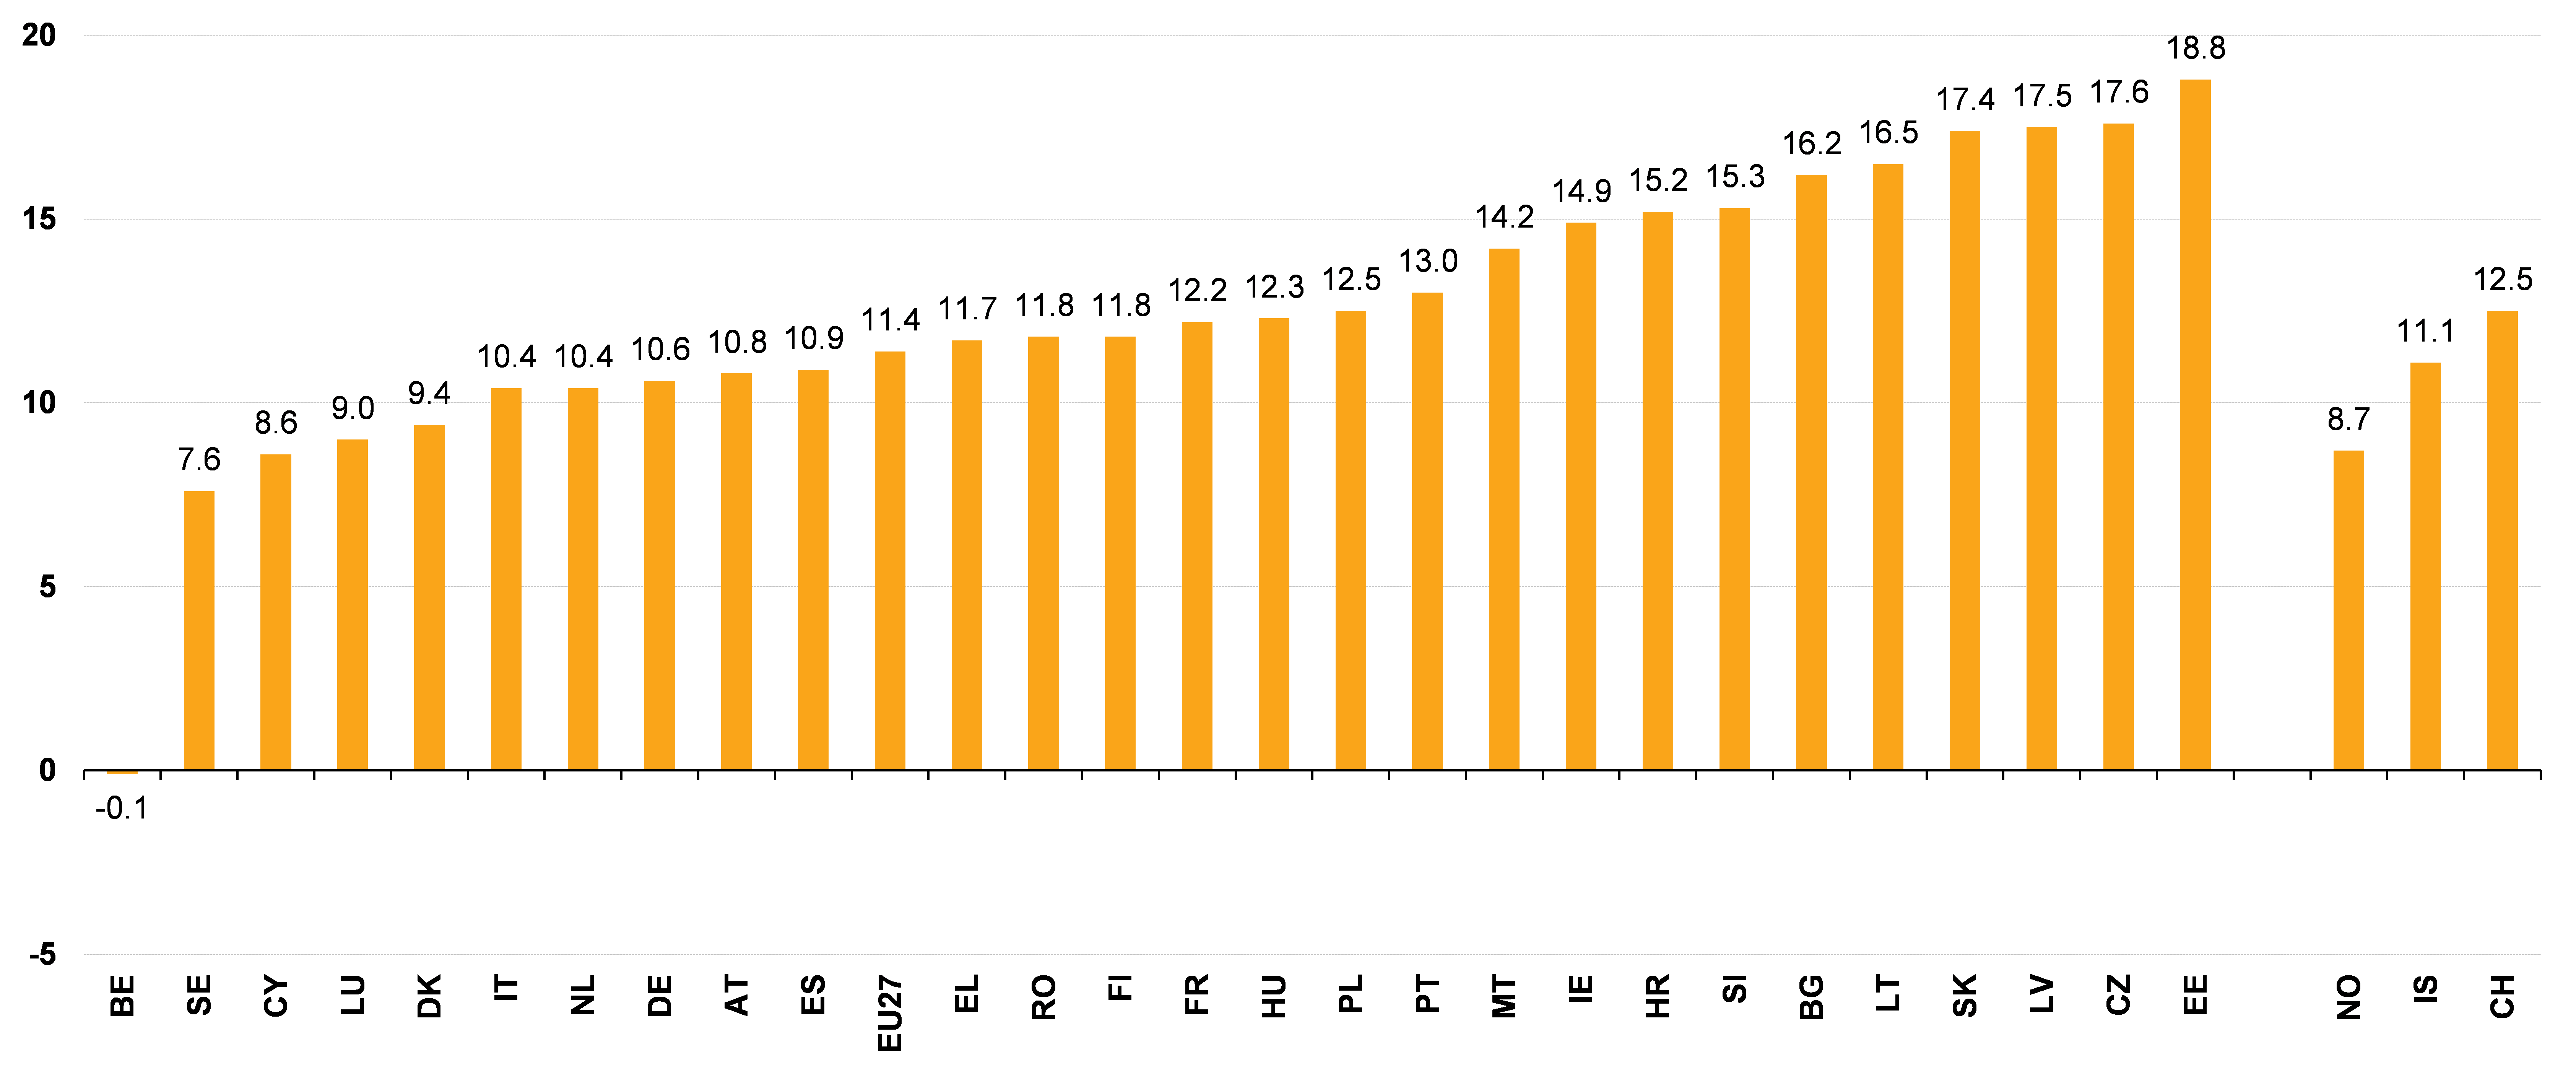
Explained and unexplained parts of the unadjusted gender pay gap (%) - countries ranked by increasing order of the unadjusted GPG - .png
(
file
)
90 KB
2
11:53, 3 March 2022
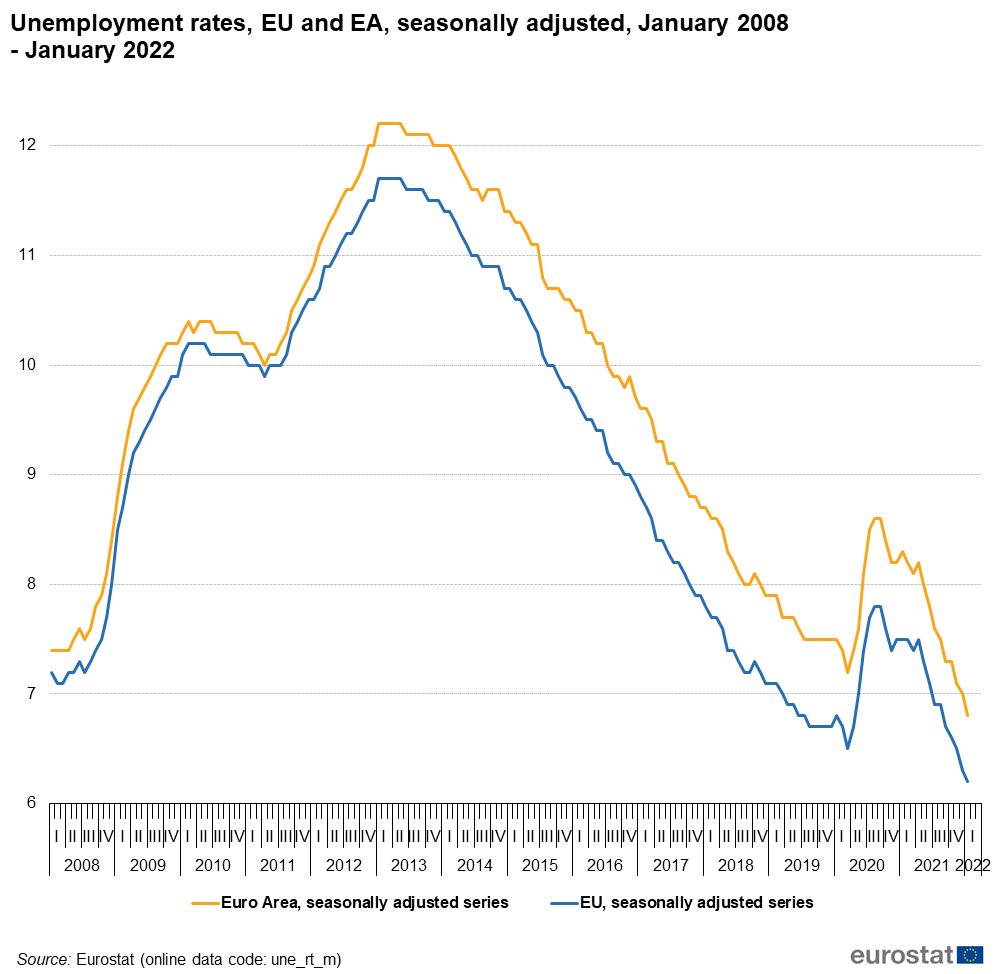
Unemployment rates, EU and EA, seasonally adjusted, January 2008 - January 2022 figure 2.png
(
file
)
73 KB
1
11:54, 3 March 2022
Youth unemployment rates, EU and EA, seasonally adjusted, January 2008 - January 2022.png
(
file
)
68 KB
2
11:55, 3 March 2022
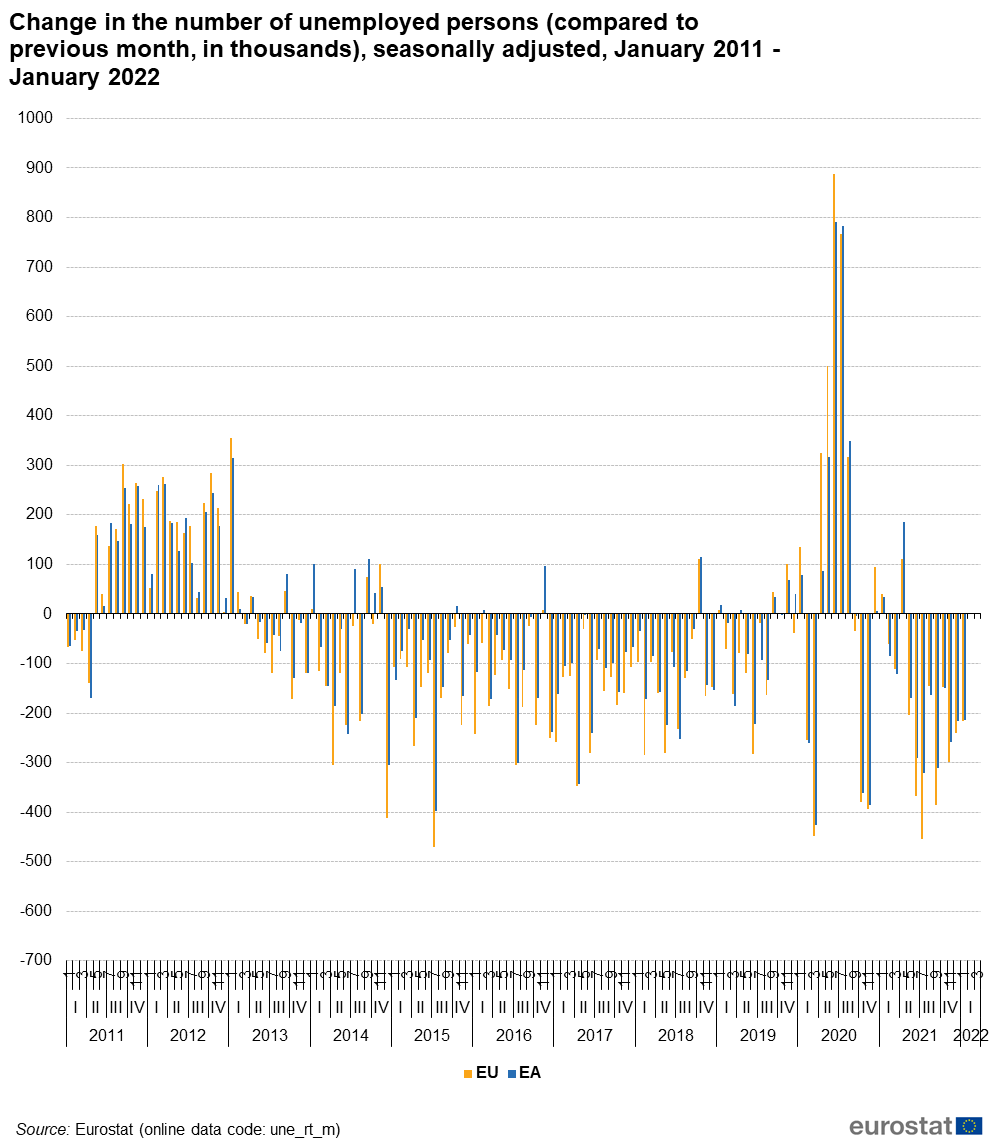
Change in the number of unemployed persons (compared to previous month, in thousands), seasonally adjusted, January 2011 - January 2022.png
(
file
)
82 KB
1
10:21, 31 March 2022
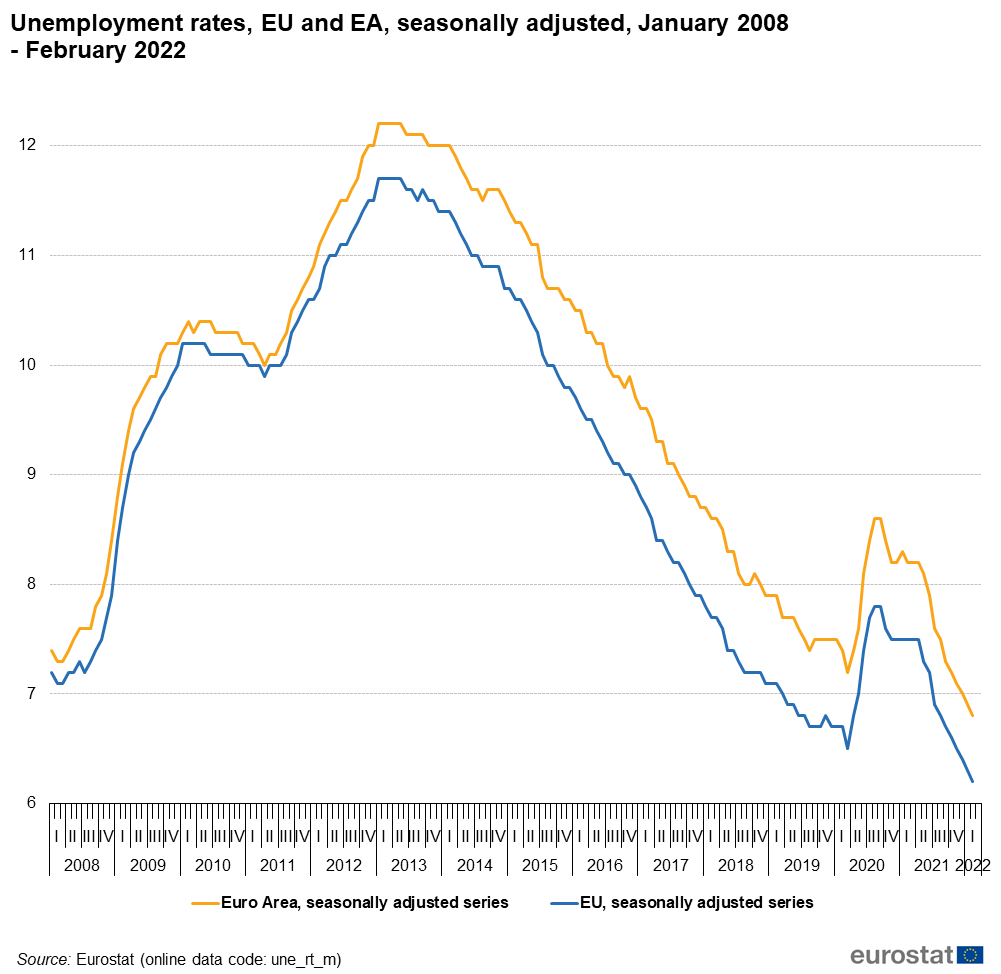
Unemployment rates, EU and EA, seasonally adjusted, January 2008 - February 2022 update.png
(
file
)
72 KB
1
10:22, 31 March 2022
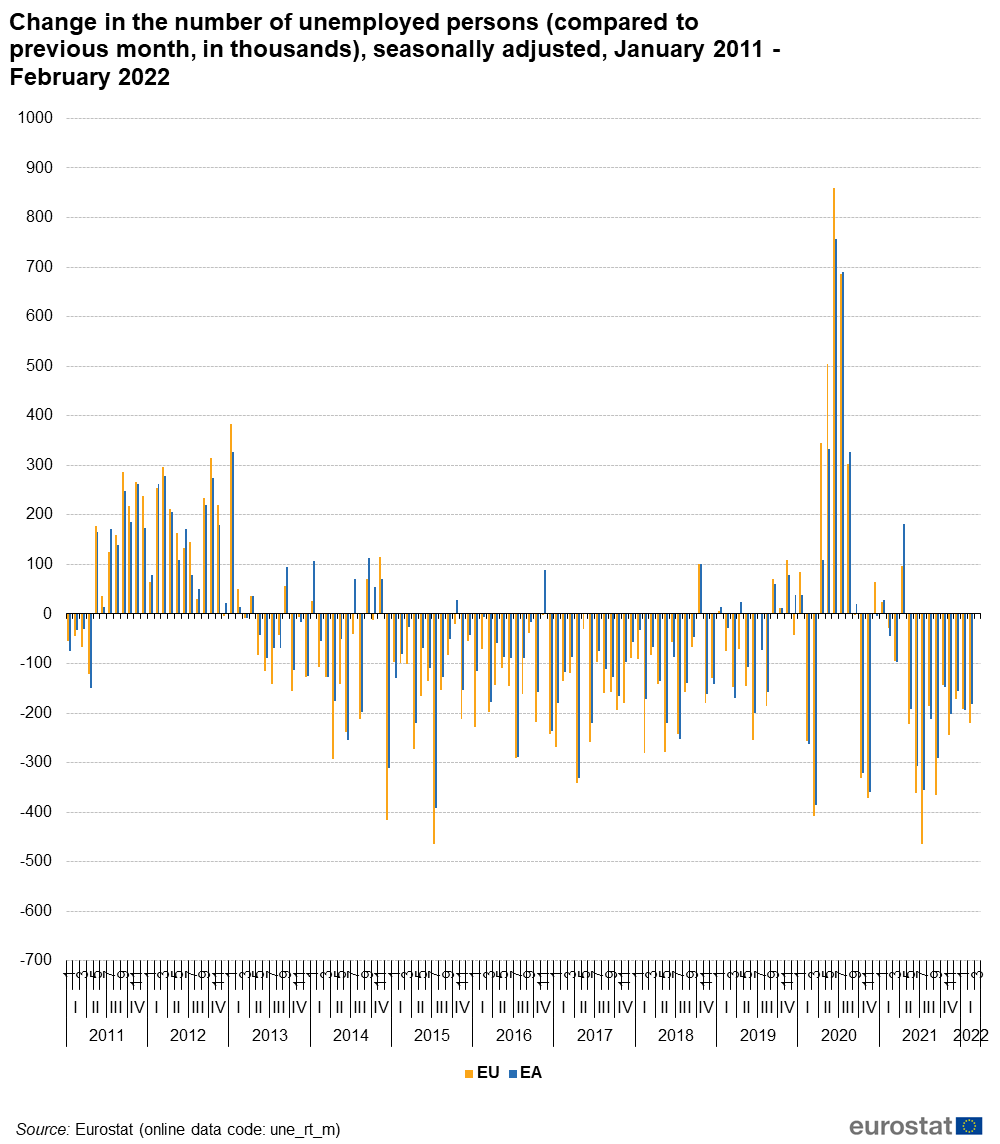
Change in the number of unemployed persons (compared to previous month, in thousands), seasonally adjusted, January 2011 - February 2022.png
(
file
)
81 KB
1
10:23, 31 March 2022
Unemployment rates, EU and EA, seasonally adjusted, January 2008 - February 2022 figure 2.png
(
file
)
72 KB
1
10:26, 31 March 2022
Youth unemployment rates, EU and EA, seasonally adjusted, January 2008 - February 2022.png
(
file
)
68 KB
1
11:55, 11 April 2022
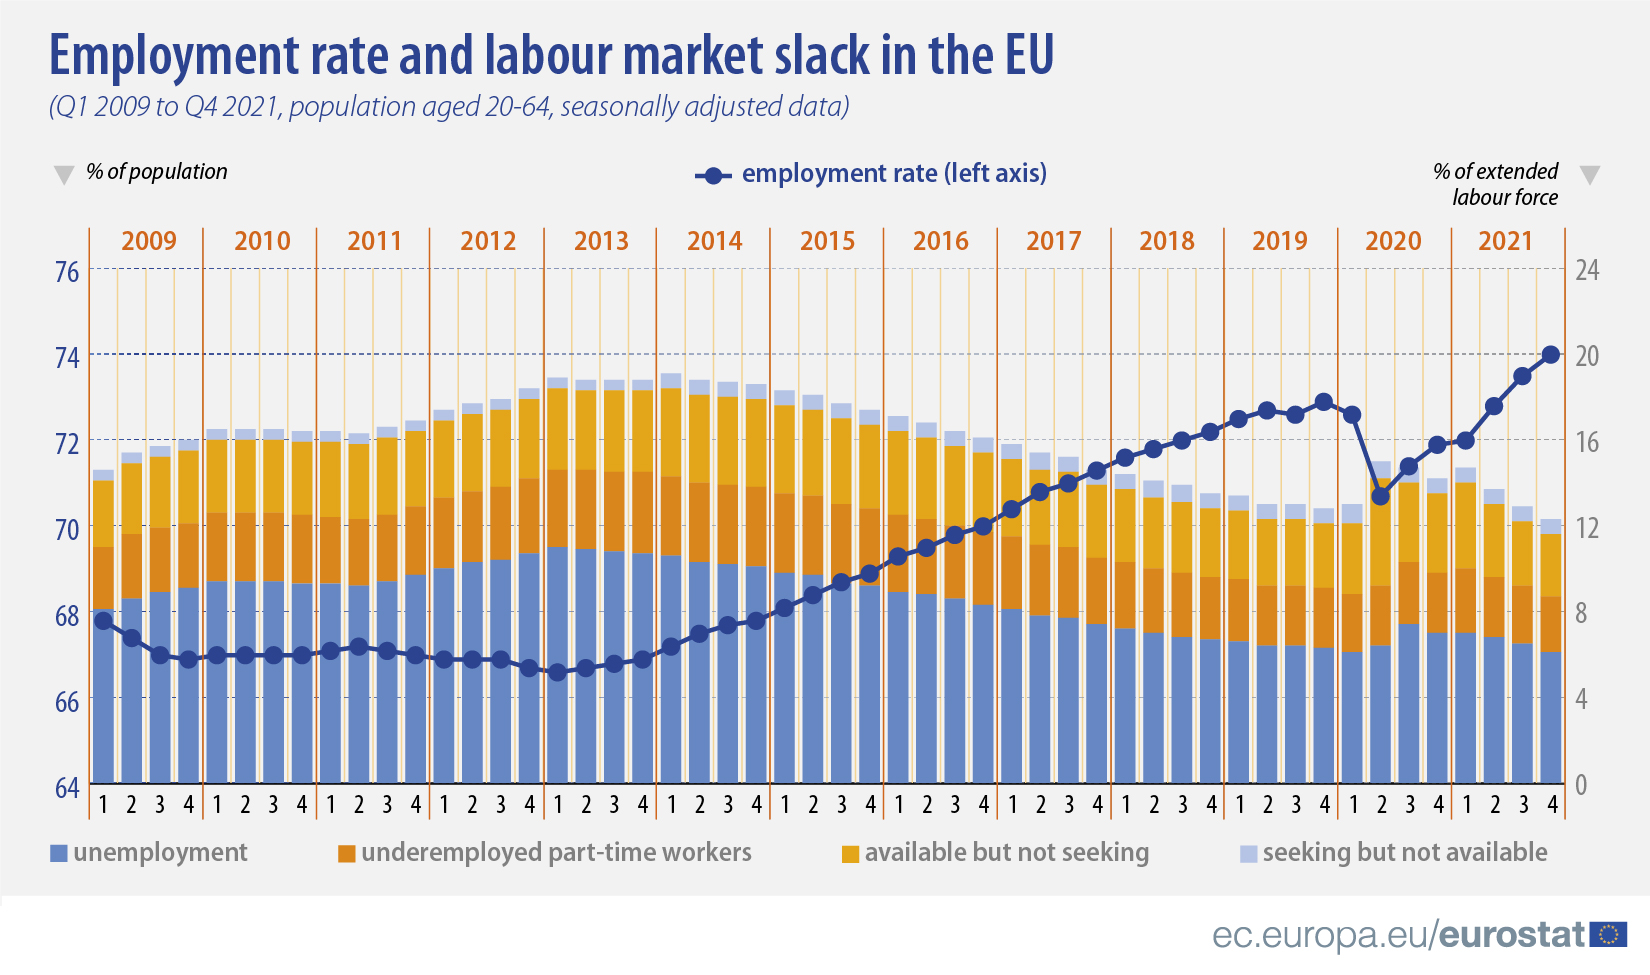
2021Q4newsitemgraph1.jpg
(
file
)
655 KB
2
16:20, 27 June 2022
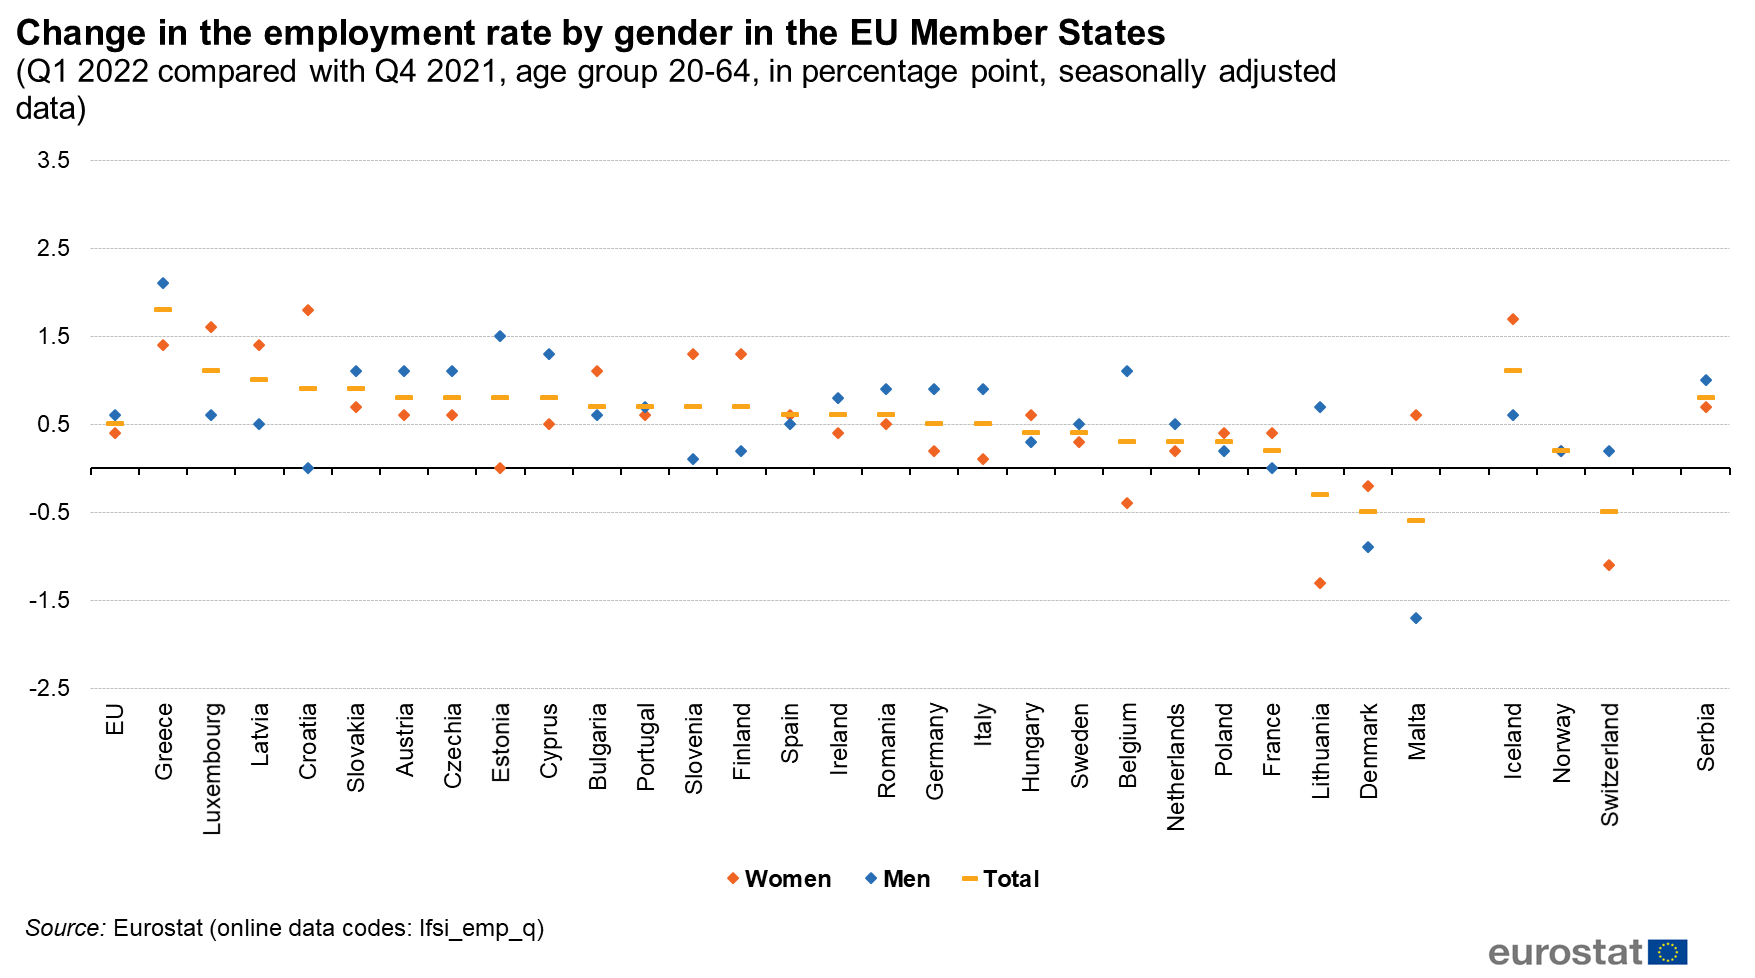
Change in the employment rate by gender in the EU Member States Q12022.png
(
file
)
104 KB
1
16:28, 27 June 2022
Data first quarter 2022 (age group 20 to 64 seasonally adjusted data).png
(
file
)
612 KB
1
16:58, 28 June 2022
Change in the labour market slack and employment in the EU Member States (2022Q1, age group 20-64, in percentage, seasonally adjusted data).png
(
file
)
128 KB
2
19:05, 28 June 2022
Change in unemployment in the EU Member States Q12022.png
(
file
)
117 KB
2
11:07, 4 July 2022
2022Q1newsitemgraph1.jpg
(
file
)
404 KB
2
10:38, 1 August 2022
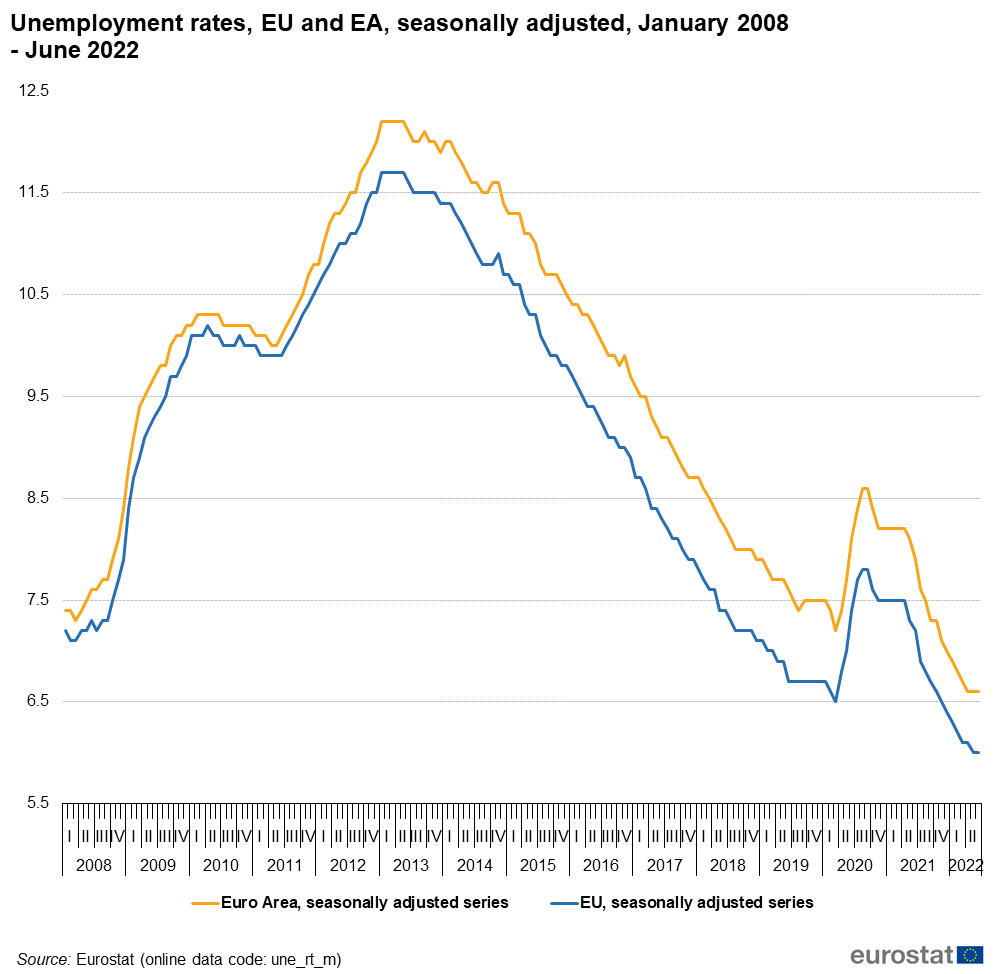
Unemployment rates, EU and EA, seasonally adjusted, January 2008 - June 2022 update.png
(
file
)
67 KB
1
10:38, 1 August 2022
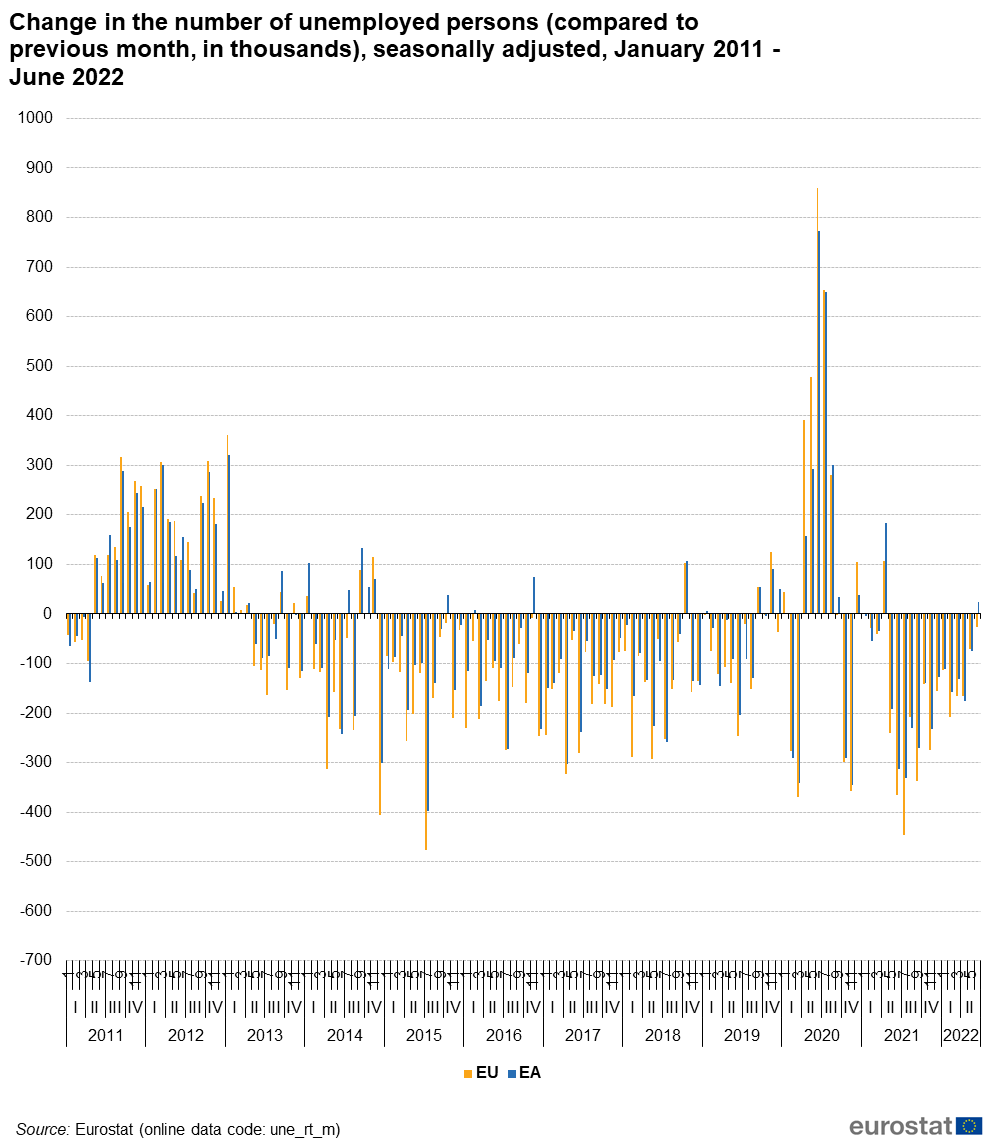
Change in the number of unemployed persons (compared to previous month, in thousands), seasonally adjusted, January 2011 - June 2022.png
(
file
)
82 KB
1
10:39, 1 August 2022
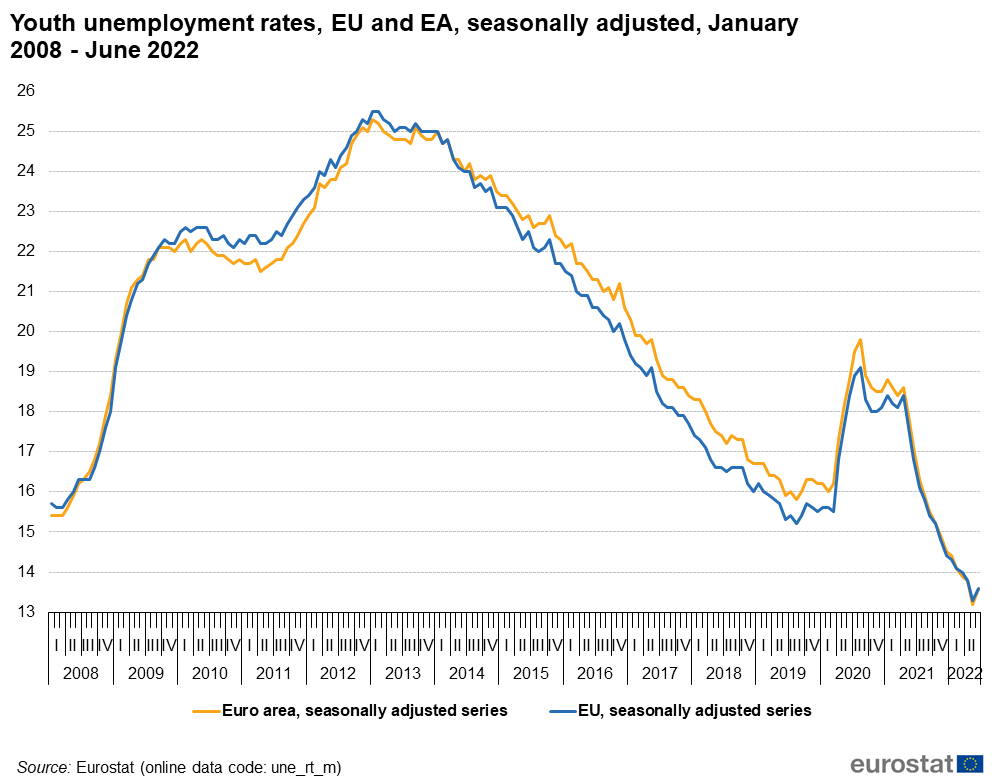
Youth unemployment rates, EU and EA, seasonally adjusted, January 2008 - June 2022.png
(
file
)
67 KB
1
10:41, 1 August 2022
Unemployment rates, EU and EA, seasonally adjusted, January 2008 - June 2022 figure 2.png
(
file
)
67 KB
1
15:02, 21 September 2022
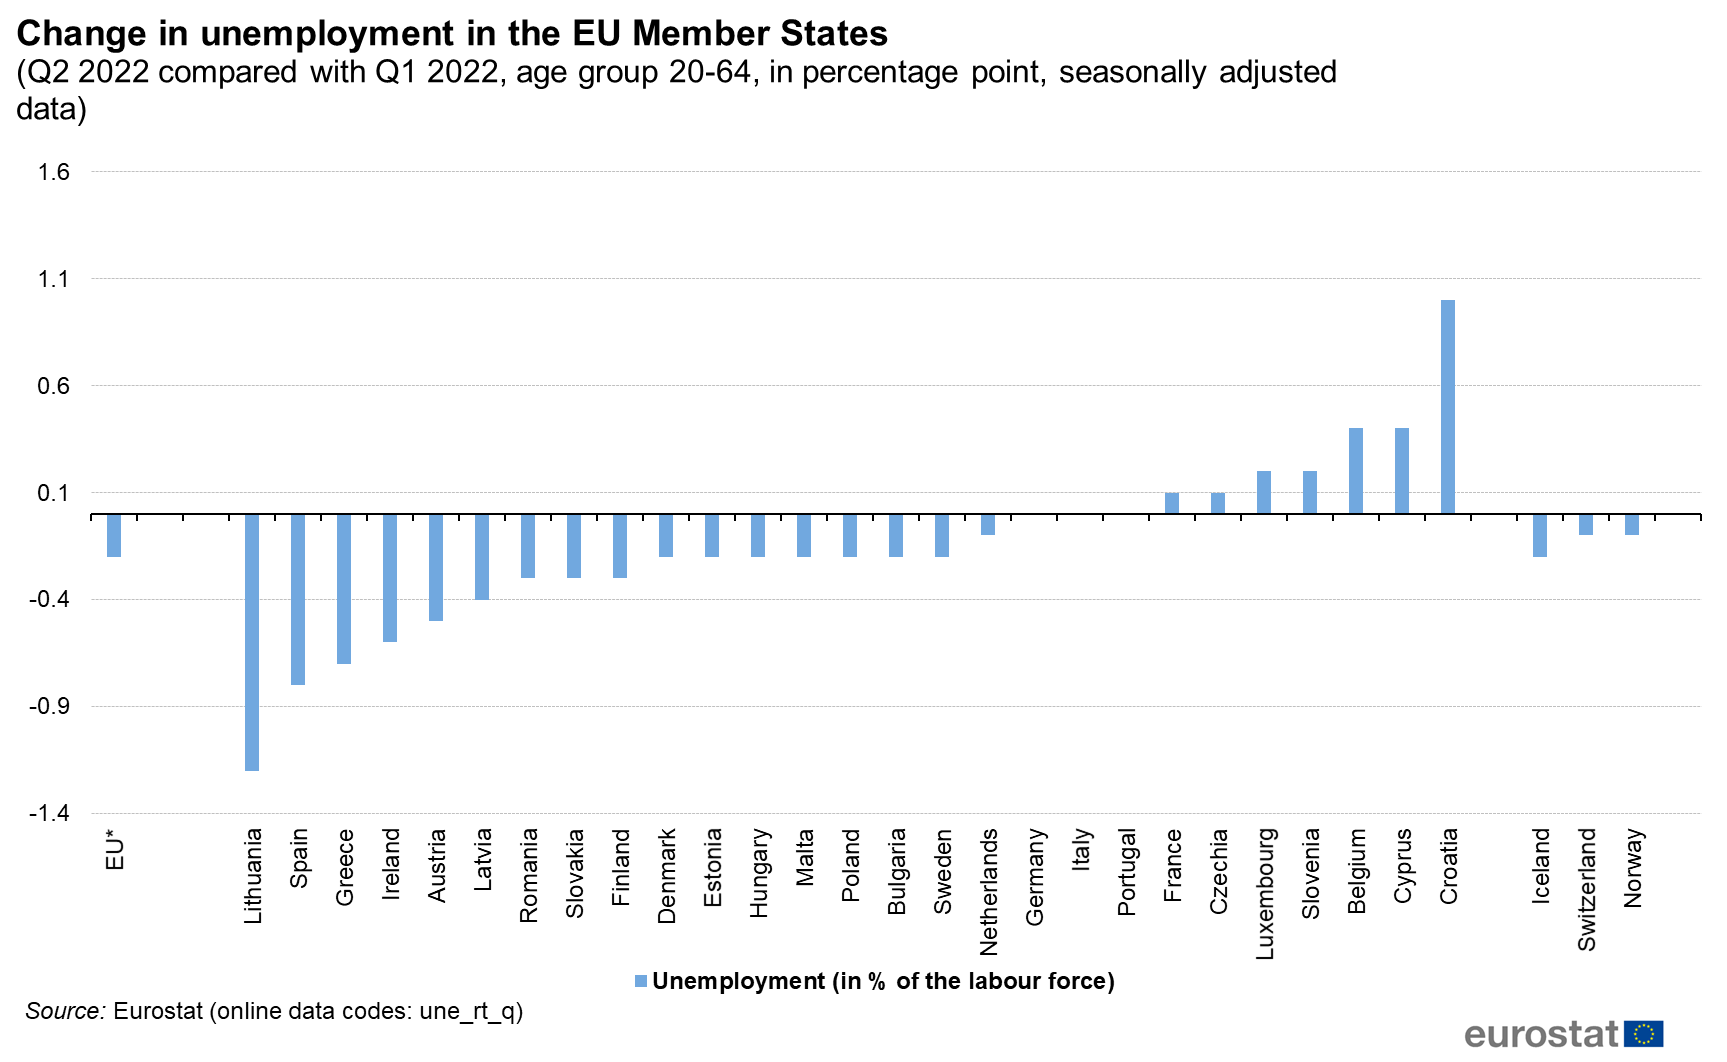
Change in unemployment in the EU Member States Q22022.png
(
file
)
106 KB
1
11:00, 22 September 2022
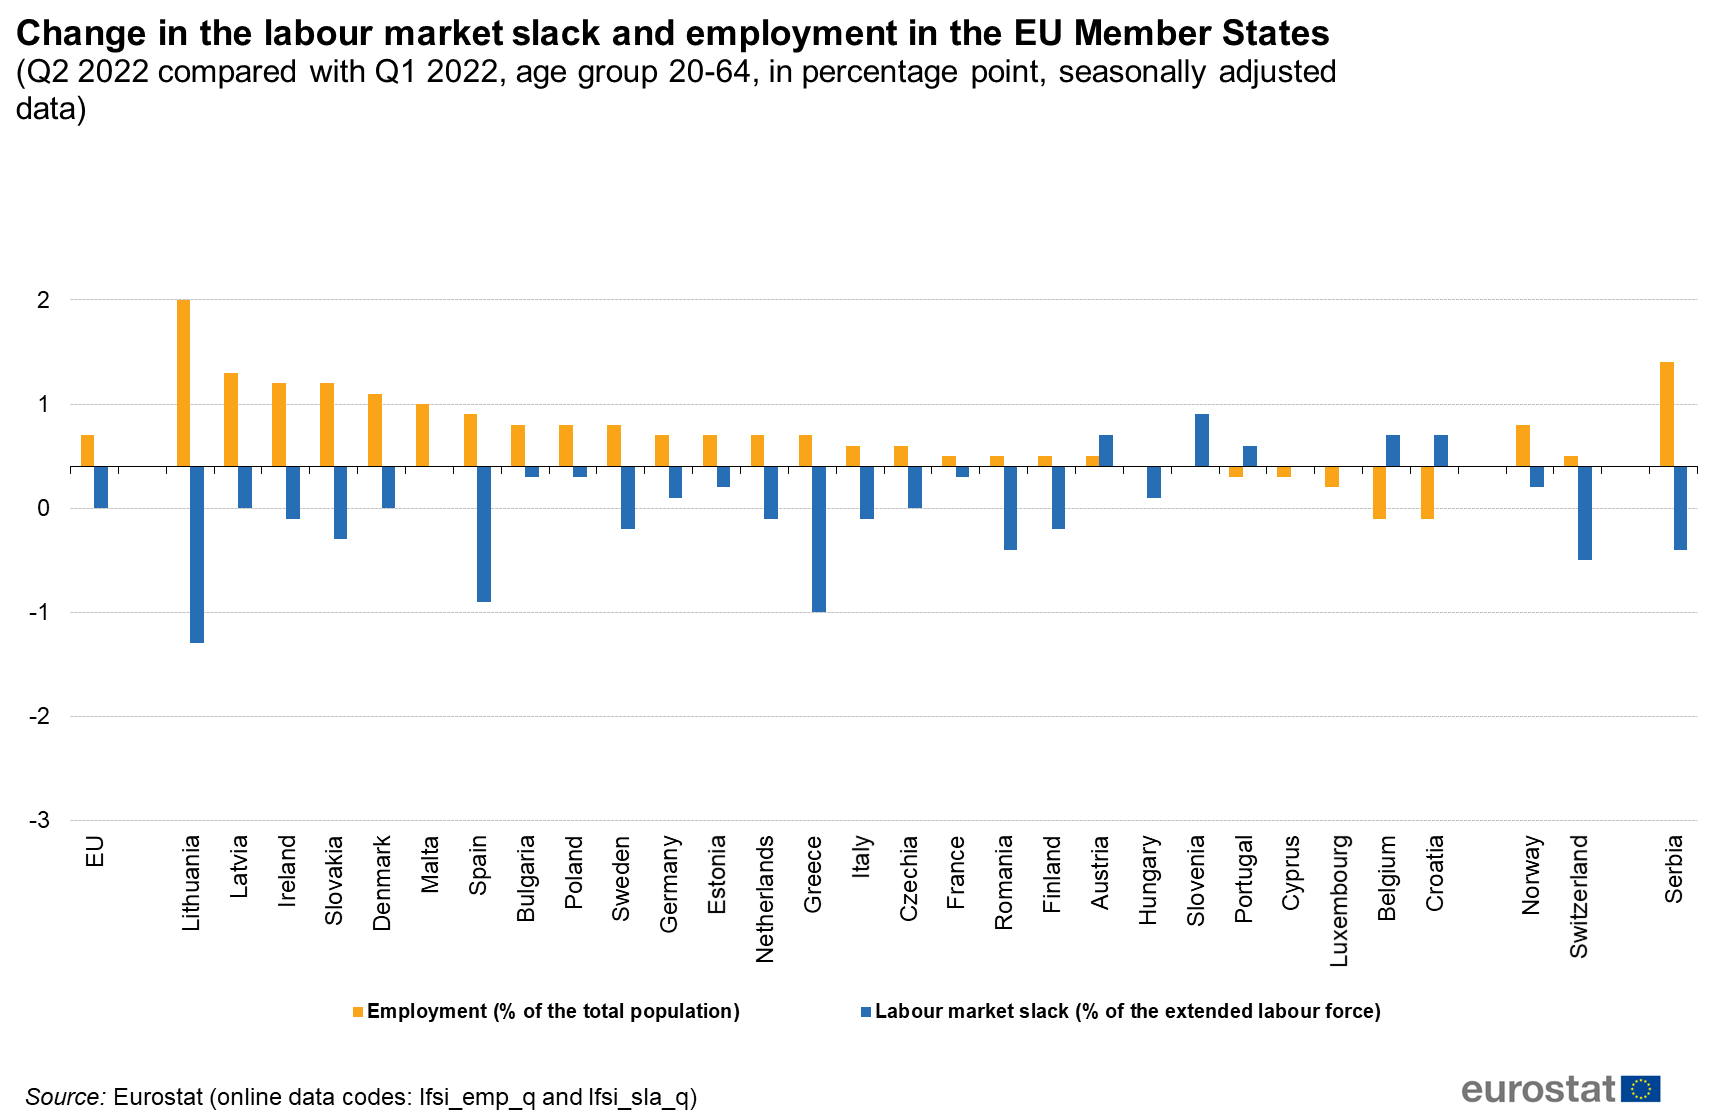
Change in the labour market slack and employment in the EU Member States (2022Q2, age group 20-64, in percentage, seasonally adjusted data).png
(
file
)
115 KB
2
11:01, 22 September 2022
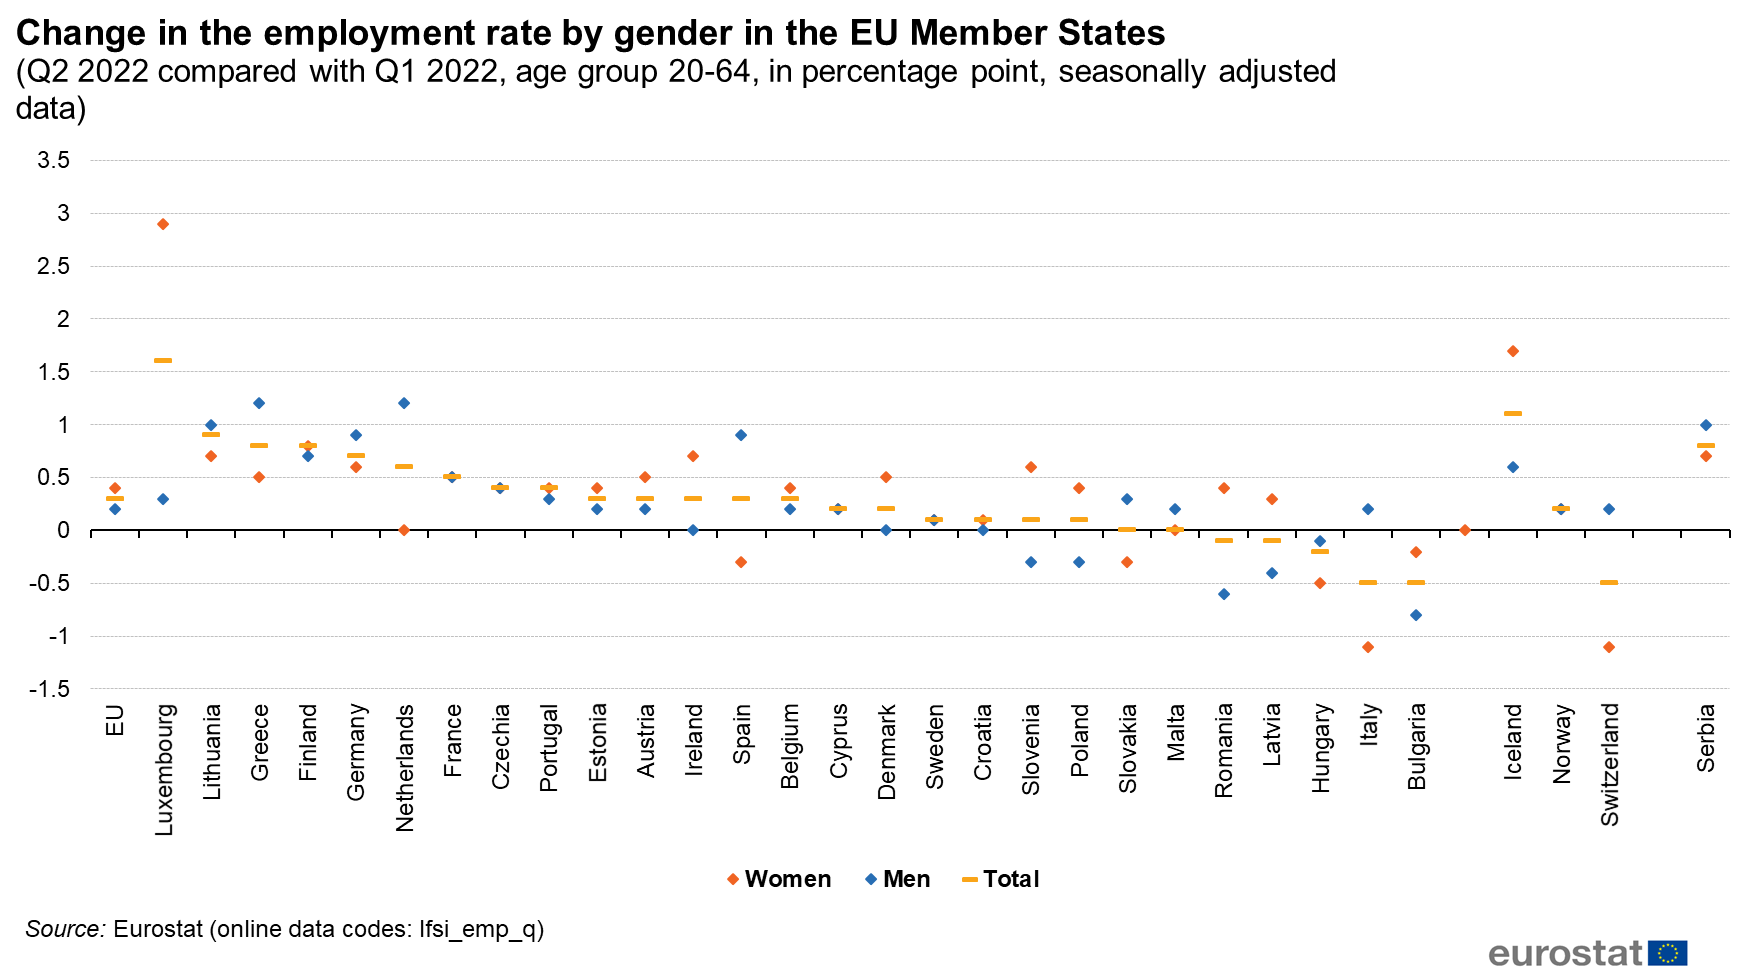
Change in the employment rate by gender in the EU Member States Q22022.png
(
file
)
105 KB
2
12:10, 22 September 2022
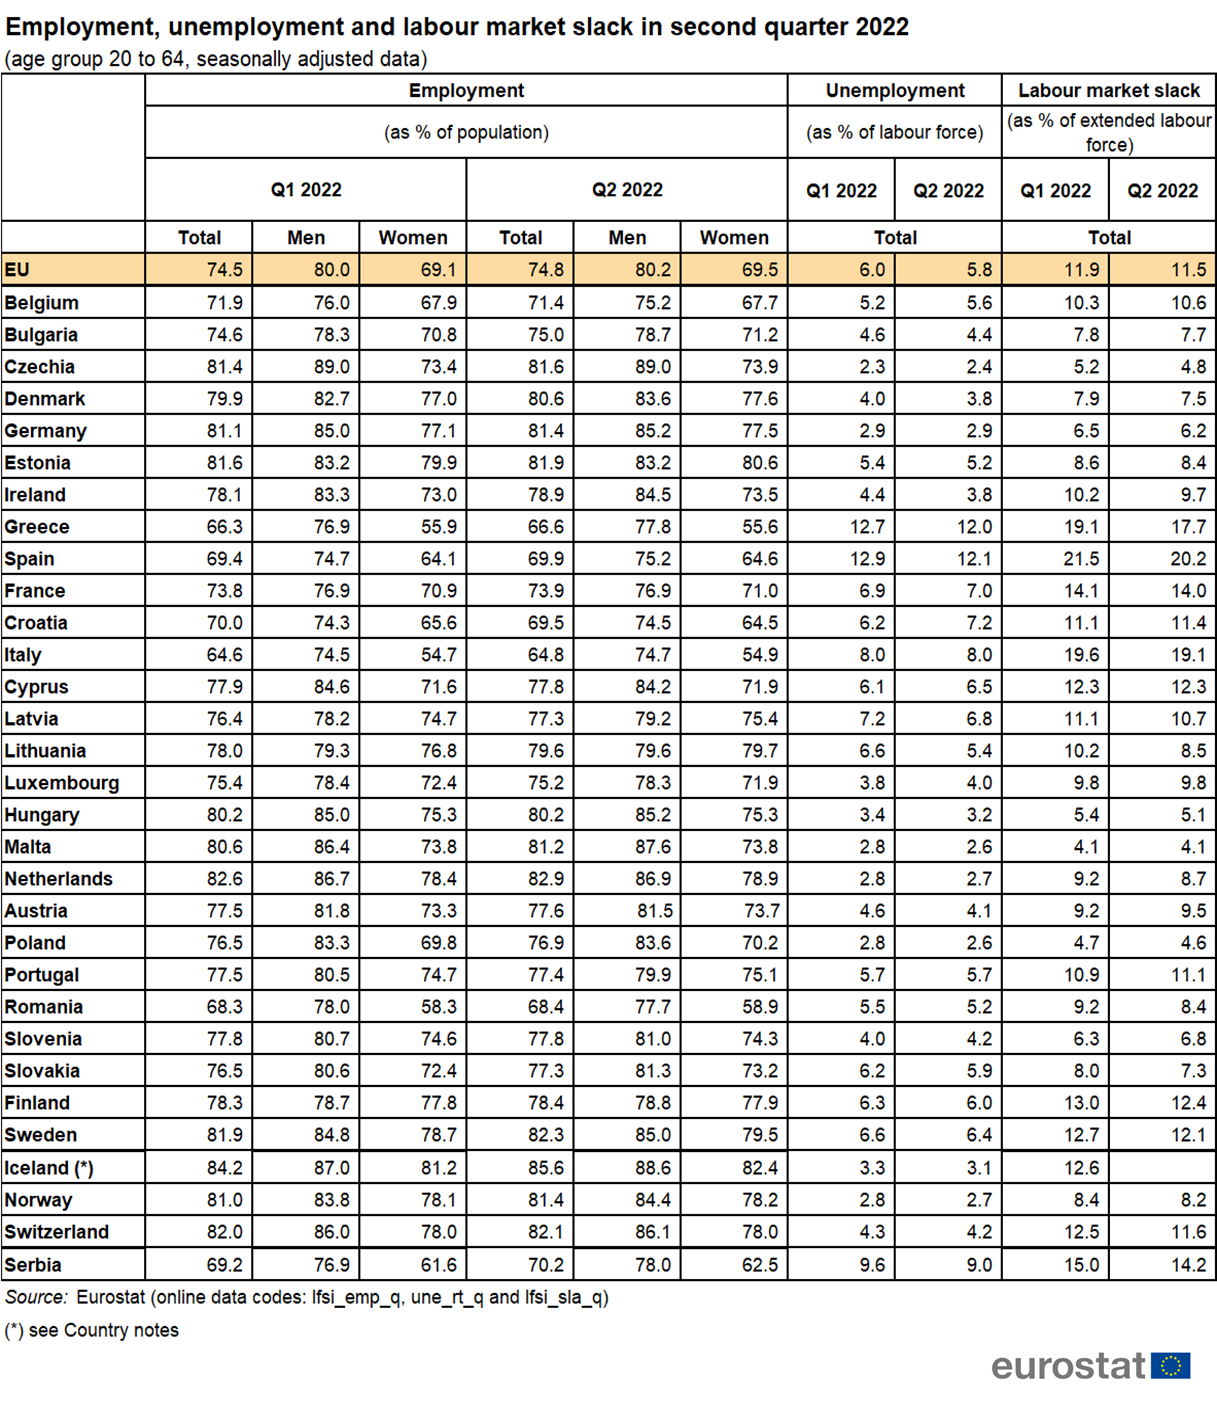
Data second quarter 2022 (age group 20 to 64 seasonally adjusted data).png
(
file
)
614 KB
2
11:20, 27 September 2022
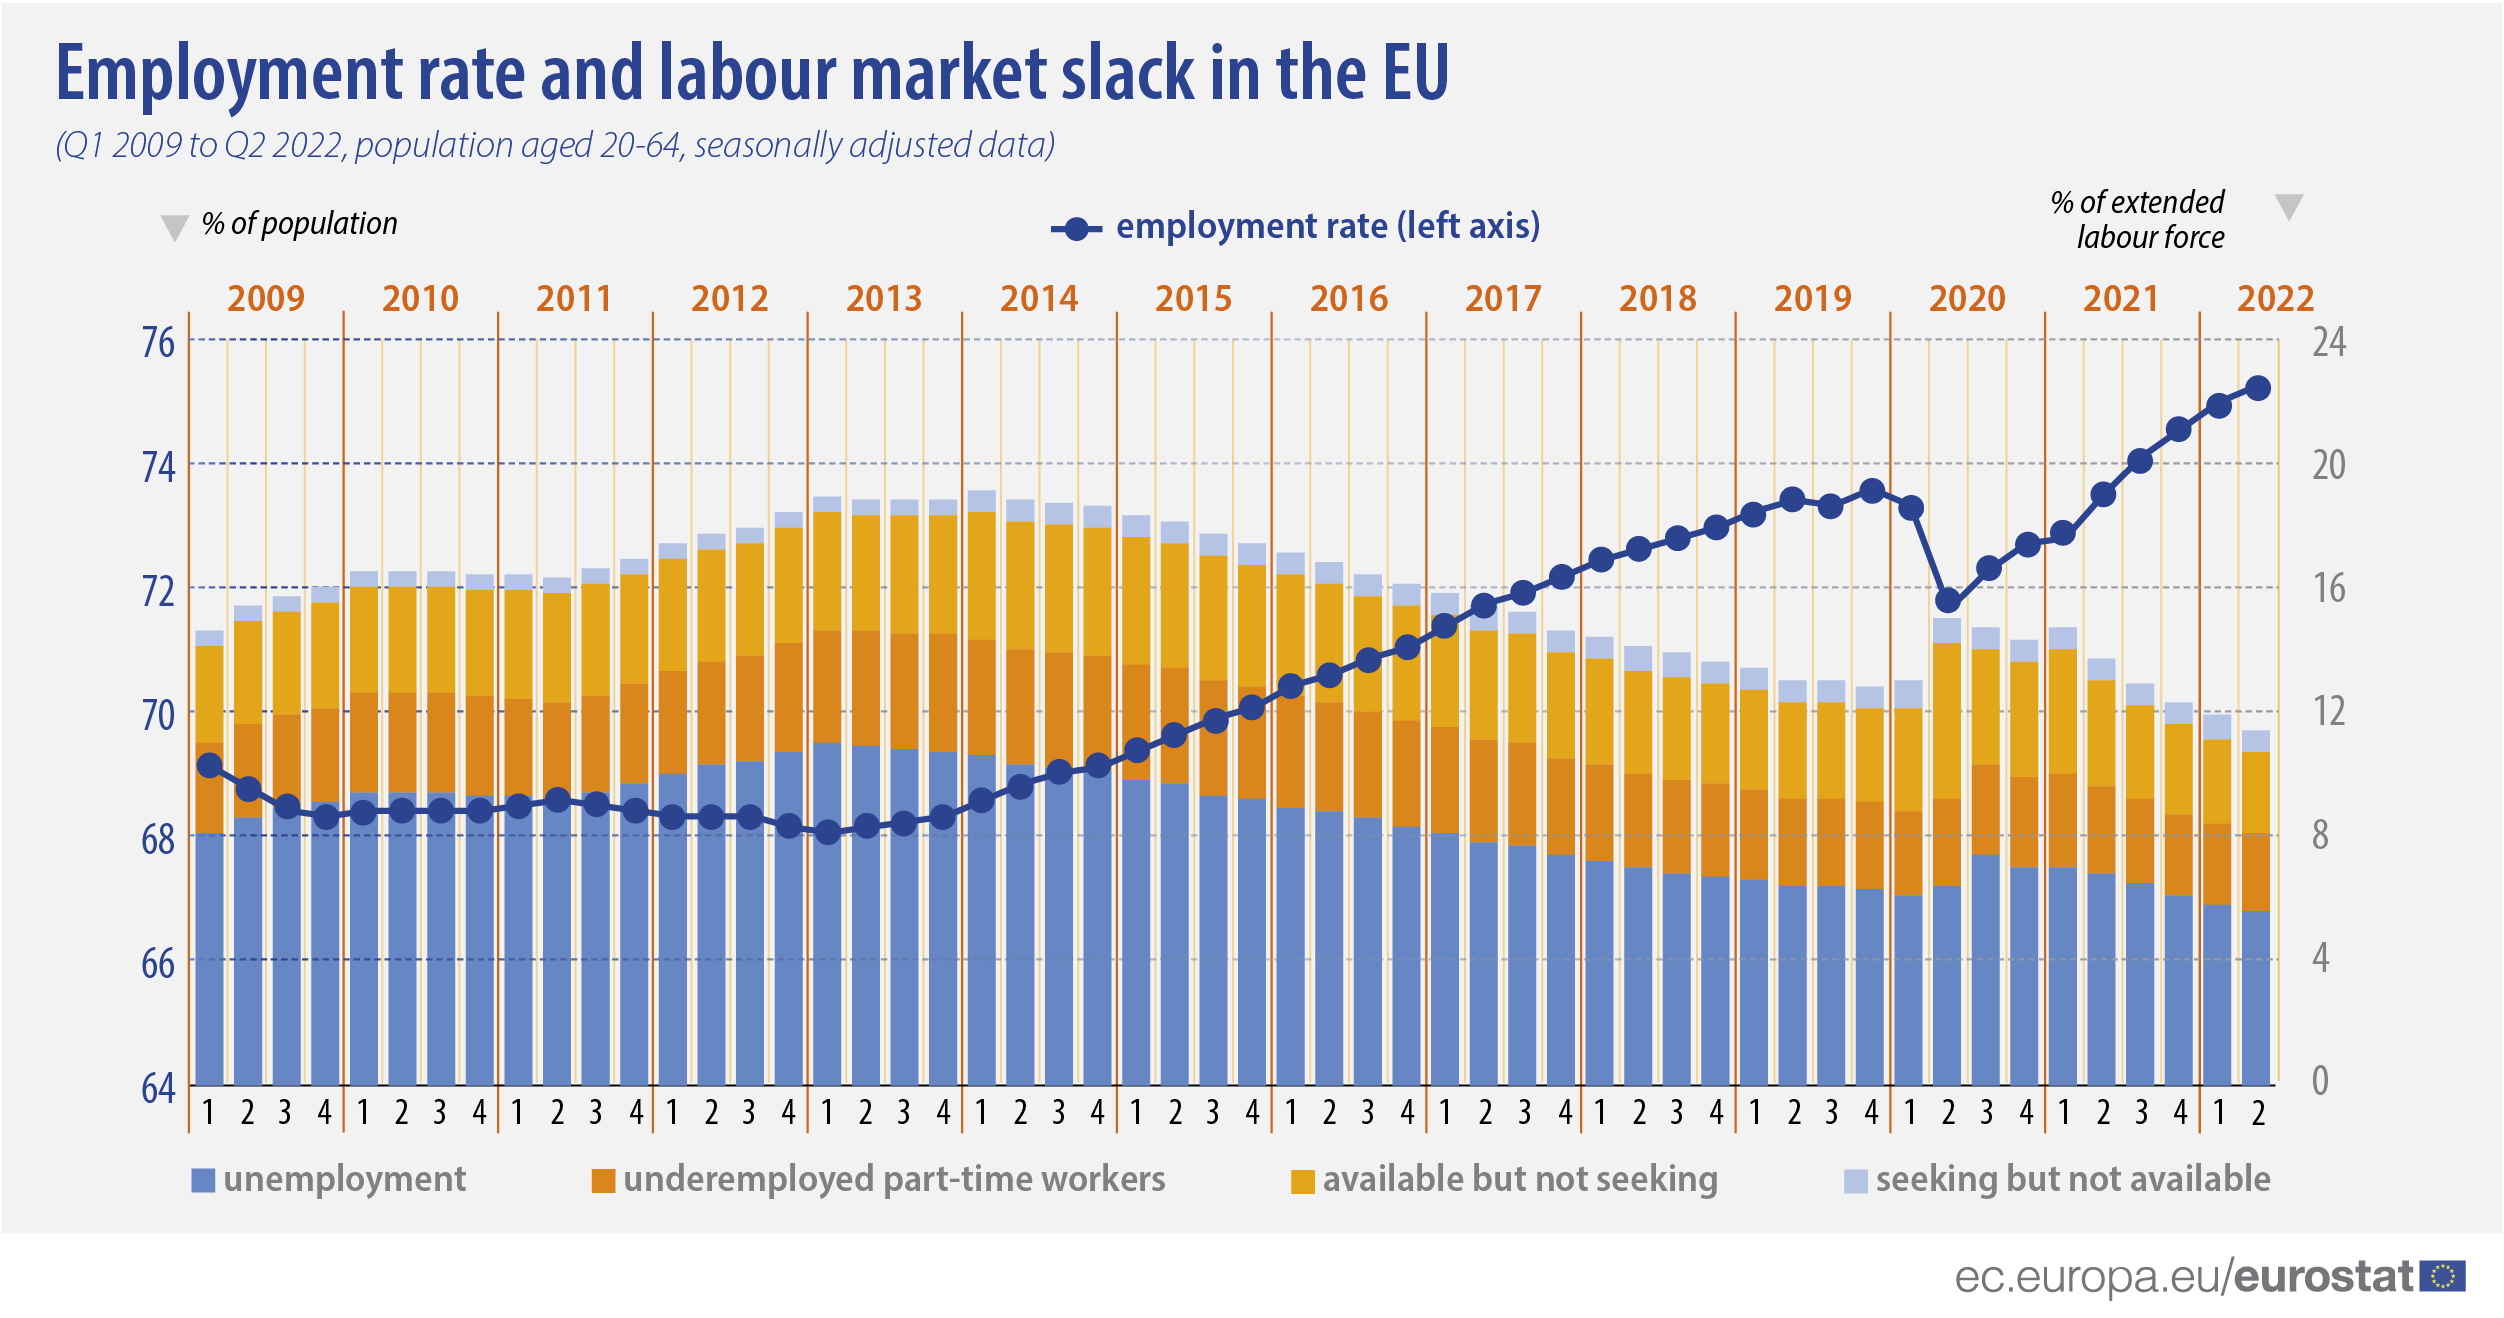
2022Q2newsitemgraph1.jpg
(
file
)
175 KB
2
00:17, 14 December 2022
Change in the unemployment rate (age group 20-64, seasonally adjusted data), 2022Q3 compared with 2022Q3 (percentage point).png
(
file
)
109 KB
5
16:08, 14 December 2022
Change in the employment rate by sex (age group 20-64, seasonally adjusted data), 2022Q2 compared with 2022Q1 (percentage point).png
(
file
)
100 KB
2
13:27, 16 December 2022
2022Q3newsitemgraph1.jpg
(
file
)
382 KB
2
14:46, 16 December 2022
Change in the labour market slack and employment rate (age group 20-64, seasonally adjusted data), 2022Q3 compared with 2022Q3 (percentage point).png
(
file
)
83 KB
Reverted to version as of 23:29, 13 December 2022 (CET)
7
15:25, 16 December 2022
Change in the employment rate by sex (age group 20-64, seasonally adjusted data), 2022Q3 compared with 2022Q2 (percentage point).png
(
file
)
100 KB
1
15:32, 16 December 2022
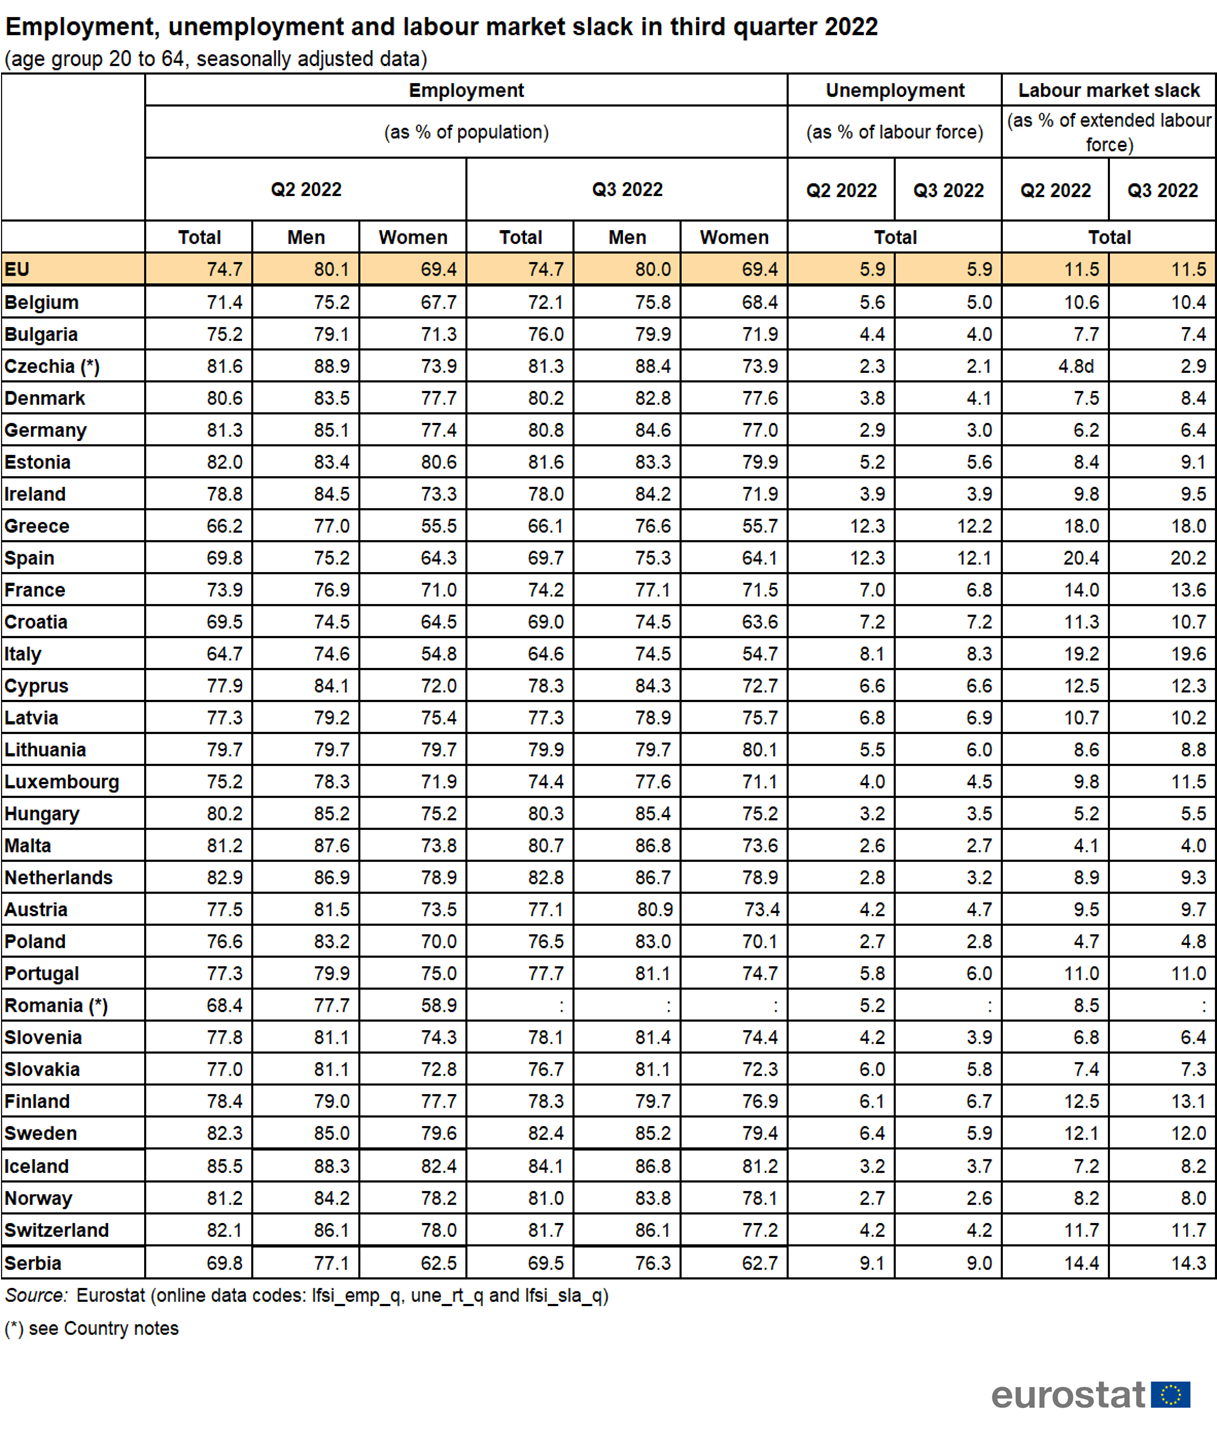
Employment, unemployment and labour market slack (age group 20 to 64, seasonally adjusted data), 2022Q3.png
(
file
)
624 KB
4
15:35, 16 December 2022
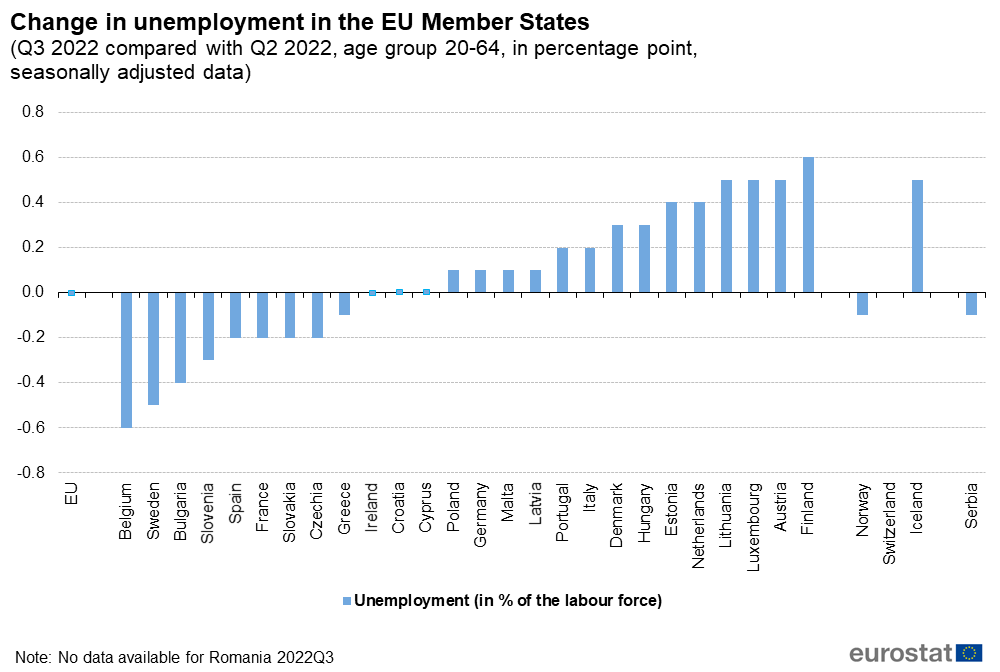
Change in the unemployment rate (age group 20-64, seasonally adjusted data), 2022Q3 compared with 2022Q2 (percentage point).png
(
file
)
57 KB
1
16:44, 12 June 2023
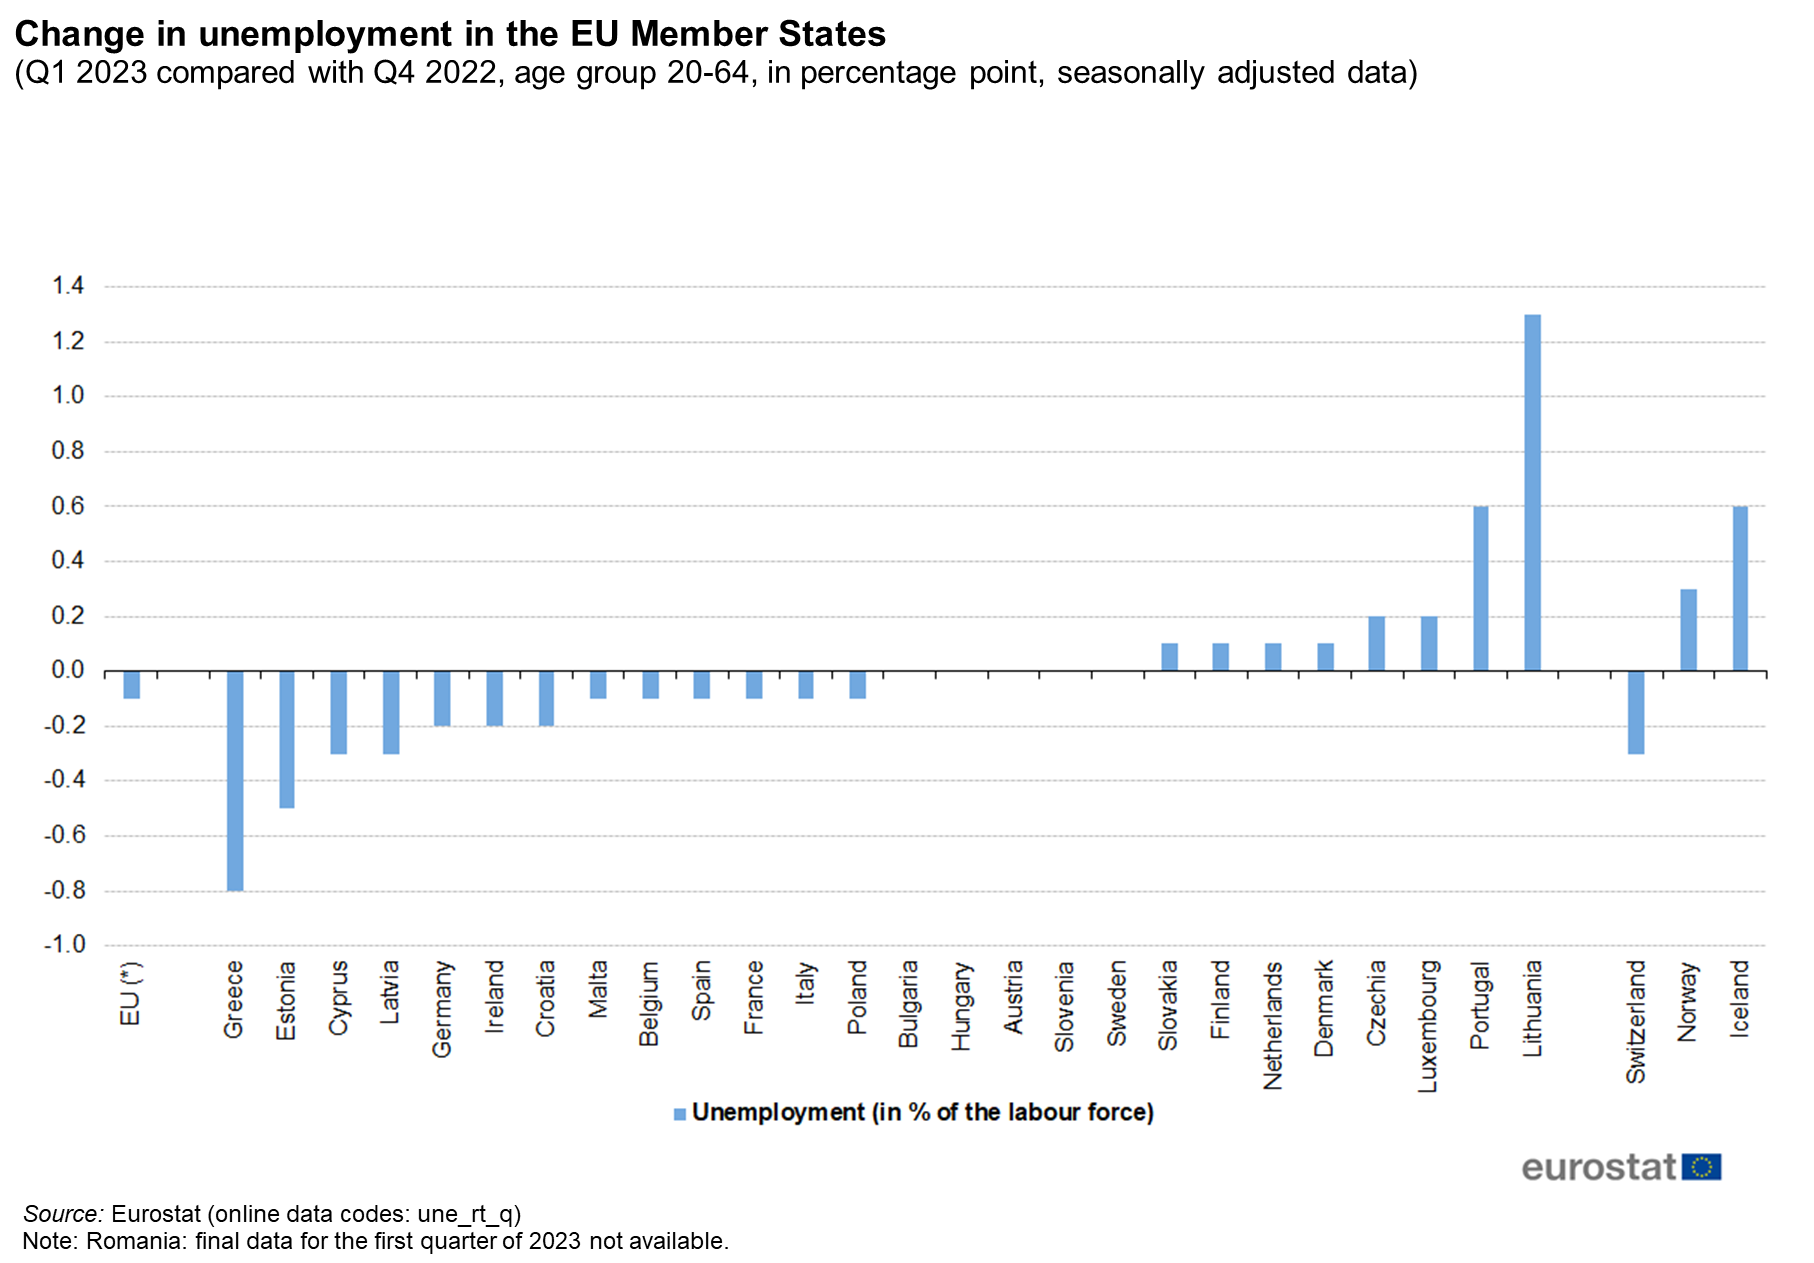
Change in unemployment in the EU Member States Q1 2023.png
(
file
)
211 KB
1
First page
Previous page
Next page
Last page
Special page
ISSN 2443-8219

,_seasonally_adjusted,_January_2011_-_March_2021.png)


,_seasonally_adjusted,_January_2011_-_May_2021.png)


.png)
,_seasonally_adjusted,_January_2011_-_June_2021.png)


_-_countries_ranked_by_increasing_order_of_the_unadjusted_GPG_-_.png)


,_seasonally_adjusted,_January_2011_-_January_2022.png)

,_seasonally_adjusted,_January_2011_-_February_2022.png)


.png)
.png)


,_seasonally_adjusted,_January_2011_-_June_2022.png)


.png)

.png)

,_2022Q3_compared_with_2022Q3_(percentage_point).png)
,_2022Q2_compared_with_2022Q1_(percentage_point).png)

,_2022Q3_compared_with_2022Q3_(percentage_point).png)
,_2022Q3_compared_with_2022Q2_(percentage_point).png)
,_2022Q3.png)
,_2022Q3_compared_with_2022Q2_(percentage_point).png)
