Tutorials
Log in
Statistics Explained
menu
search
search
Navigation
Main page
Statistical themes
Glossary
Categories
Statistics 4 beginners
Tutorials
Help
Eurostat home
Education corner
Online publications
Regional yearbook
Sustainable development
Full list
Tools
User contributions
Logs
View user groups
Special pages
search
Navigation
Main page
Statistical themes
Glossary
Categories
Statistics 4 beginners
Tutorials
Help
Eurostat home
Education corner
Online publications
Regional yearbook
Sustainable development
Full list
Tools
User contributions
Logs
View user groups
Special pages
Navigation
Main page
Statistical themes
Glossary
Categories
Statistics 4 beginners
Tutorials
Help
Eurostat home
Education corner
Online publications
Regional yearbook
Sustainable development
Full list
Tools
User contributions
Logs
View user groups
Special pages
Uploads by Pavlosv
This special page shows all uploaded files.
File list
Items per page:
20
50
100
250
500
Search for media name:
Username:
Include old versions of files
Go
First page
Previous page
Next page
Last page
Date
Name
Thumbnail
Size
Description
Versions
13:08, 14 December 2012
Mean absolute deviation measured in percentage points 2012 11.png
(
file
)
16 KB
1
13:09, 14 December 2012
Inflation direction analysis over 12 months 2012 11.png
(
file
)
33 KB
1
10:54, 1 July 2013
Euro area inflation and its main main components 2002-2013 06-e.png
(
file
)
24 KB
1
10:42, 16 July 2013
Euro area annual inflation and its main components (%), 2013, June 2012 and January - June 2013-p.png
(
file
)
11 KB
1
11:03, 16 July 2013
Euro area annual inflation and its main components (%), 2013, June 2012 and January - June 2013-e.png
(
file
)
11 KB
2
11:10, 16 July 2013
Flash estimate and HICP annual rates for the all-items and main components 2013-06.png
(
file
)
17 KB
1
11:11, 16 July 2013
Mean absolute deviation measured in percentage points 2013-06.png
(
file
)
5 KB
1
11:11, 16 July 2013
Inflation direction analysis over 12 months 2013-06.png
(
file
)
24 KB
1
11:23, 16 July 2013
Euro area inflation and its main main components 2002-2013 06-p.png
(
file
)
24 KB
1
11:24, 16 July 2013
Euro area inflation and its main components, (%) September 2010 - June 2013-e.png
(
file
)
16 KB
2
11:25, 16 July 2013
Euro area inflation and its main components, (%) September 2010 - June 2013-p.png
(
file
)
16 KB
1
11:07, 31 July 2013
Euro area annual inflation and its main components (%), 2013, July 2012 and February - July 2013-e.png
(
file
)
11 KB
1
11:08, 31 July 2013
Euro area inflation and its main main components 2002-2013 07-e.png
(
file
)
24 KB
1
11:09, 31 July 2013
Euro area inflation and its main components, (%) September 2010 - July 2013-e.png
(
file
)
16 KB
1
11:18, 30 September 2013
Euro area annual inflation and its main components (%), 2013, September 2012 and April - September 2013-e.png
(
file
)
11 KB
1
11:18, 30 September 2013
Euro area inflation and its main main components 2002-2013 09-e.png
(
file
)
24 KB
1
11:19, 30 September 2013
Euro area inflation and its main components, (%) September 2010 - September 2013-e.png
(
file
)
16 KB
1
12:17, 31 October 2013
Euro area annual inflation and its main components (%), 2013, October 2012 and May - October 2013-e.png
(
file
)
10 KB
1
12:18, 31 October 2013
Euro area inflation and its main main components 2002-2013 10-e.png
(
file
)
24 KB
1
12:18, 31 October 2013
Euro area inflation and its main components, (%) September 2010 - October 2013-e.png
(
file
)
41 KB
1
10:18, 17 July 2014
Euro area annual inflation and its main components (%), 2014, June 2013 and January - June 2014-p.png
(
file
)
12 KB
2
10:25, 17 July 2014
Euro area annual inflation and its main components (%), July 2012 - June 2014-p.png
(
file
)
22 KB
1
10:57, 17 July 2014
Flash estimate and HICP annual rates for the all-items and main components 2014-06.png
(
file
)
17 KB
1
10:58, 17 July 2014
Mean absolute deviation measured in percentage points 2014-06.png
(
file
)
6 KB
1
11:00, 17 July 2014
Inflation direction analysis over 12 months 2014-06.png
(
file
)
22 KB
2
12:30, 31 July 2014
Euro area annual inflation and its main components (%), 2014, July 2013 and February - July 2014-e.png
(
file
)
13 KB
1
12:31, 31 July 2014
Euro area annual inflation and its main components, 2002-2014-06-p.png
(
file
)
33 KB
2
12:32, 31 July 2014
Euro area annual inflation and its main components, 2002-2014-07-e.png
(
file
)
33 KB
1
12:33, 31 July 2014
Euro area annual inflation and its main components (%), August 2012 - July 2014-e.png
(
file
)
21 KB
1
11:02, 16 July 2015
Euro area annual inflation and its main components (%), 2015, June 2014 and January - June 2015-p.png
(
file
)
31 KB
1
11:03, 16 July 2015
Euro area annual inflation and its main components, 2005-June-2015-p.png.png
(
file
)
34 KB
1
11:04, 16 July 2015
Euro area annual inflation and its main components (%), July 2013 - June 2015-p.png.png
(
file
)
25 KB
1
11:33, 17 July 2017
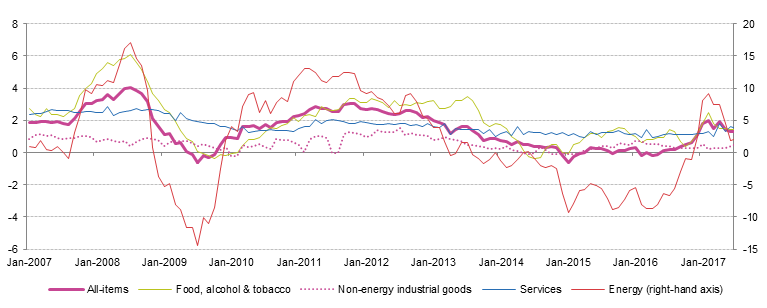
Euro area annual inflation and its main components, January 2007-June 2017.png
(
file
)
27 KB
1
11:34, 17 July 2017
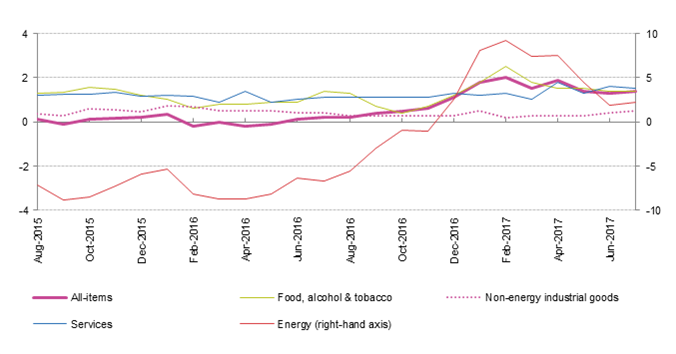
Euro area annual inflation and its main components (%), July 2015-June 2017.png
(
file
)
47 KB
1
11:40, 17 July 2017
Euro area annual inflation and its main components (%), 2017, June 2016 and January-June 2017.png
(
file
)
20 KB
5
11:50, 17 July 2017
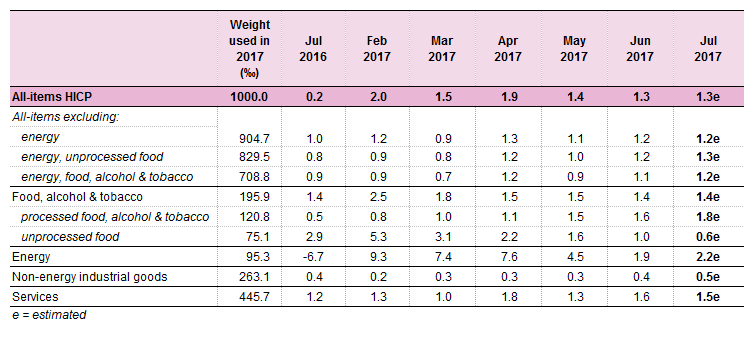
Flash estimate and HICP annual rates for the all-items and main components 2017-06.png
(
file
)
34 KB
1
11:55, 17 July 2017
Inflation direction analysis over 12 months 2017-05.png
(
file
)
40 KB
1
11:59, 17 July 2017
Mean absolute deviation measured in percentage points 2017-06.png
(
file
)
28 KB
1
11:52, 31 July 2017
Euro area annual inflation and its main components (%), 2017, July 2016 and February-July 2017-e.png
(
file
)
20 KB
1
11:53, 31 July 2017
Euro area annual inflation and its main components, January 2007-July 2017-e.png
(
file
)
27 KB
1
11:53, 31 July 2017
Euro area annual inflation and its main components (%), August 2015-July 2017-e.png
(
file
)
47 KB
1
12:11, 31 January 2018
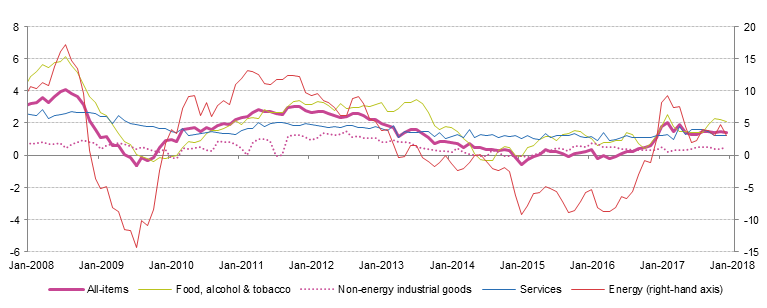
Euro area annual inflation and its main components, January 2008-January 2018-e.png
(
file
)
26 KB
1
12:12, 31 January 2018
Euro area annual inflation and its main components (%), February 2016-January 2018-e.png
(
file
)
46 KB
1
12:19, 31 January 2018
Weights of the main components of the euro area HICP - 2018-e.png
(
file
)
11 KB
1
12:24, 31 January 2018
Euro area annual inflation and its main components (%), 2018, January 2017 and August 2017-January 2018-e.png
(
file
)
20 KB
1
11:31, 18 July 2018
Euro area annual inflation and its main components (%), January 2008-June 2018 (estimated).png
(
file
)
34 KB
2
11:32, 18 July 2018
Euro area annual inflation and its main components (%), July 2016-June 2018 (estimated).png
(
file
)
24 KB
2
11:34, 18 July 2018
Euro area annual inflation and its main components (%), January 2008-June 2018.png
(
file
)
34 KB
1
11:35, 18 July 2018
Euro area annual inflation and its main components (%), July 2016-June 2018.png
(
file
)
24 KB
1
11:41, 18 July 2018
Euro area annual inflation and its main components (%), 2018, June 2017 and January-June 2018.png
(
file
)
34 KB
4
First page
Previous page
Next page
Last page
Special page
ISSN 2443-8219


,_2013,_June_2012_and_January_-_June_2013-p.png)
,_2013,_June_2012_and_January_-_June_2013-e.png)


_September_2010_-_June_2013-e.png)
_September_2010_-_June_2013-p.png)
,_2013,_July_2012_and_February_-_July_2013-e.png)

_September_2010_-_July_2013-e.png)
,_2013,_September_2012_and_April_-_September_2013-e.png)

_September_2010_-_September_2013-e.png)
,_2013,_October_2012_and_May_-_October_2013-e.png)

_September_2010_-_October_2013-e.png)
,_2014,_June_2013_and_January_-_June_2014-p.png)
,_July_2012_-_June_2014-p.png)


,_2014,_July_2013_and_February_-_July_2014-e.png)


,_August_2012_-_July_2014-e.png)
,_2015,_June_2014_and_January_-_June_2015-p.png)

,_July_2013_-_June_2015-p.png.png)

,_July_2015-June_2017.png)
,_2017,_June_2016_and_January-June_2017.png)


,_2017,_July_2016_and_February-July_2017-e.png)

,_August_2015-July_2017-e.png)

,_February_2016-January_2018-e.png)

,_2018,_January_2017_and_August_2017-January_2018-e.png)
,_January_2008-June_2018_(estimated).png)
,_July_2016-June_2018_(estimated).png)
,_January_2008-June_2018.png)
,_July_2016-June_2018.png)
,_2018,_June_2017_and_January-June_2018.png)