Tutorials
Log in
Statistics Explained
menu
search
search
Navigation
Main page
Statistical themes
Glossary
Categories
Statistics 4 beginners
Tutorials
Help
Eurostat home
Education corner
Online publications
Regional yearbook
Sustainable development
Full list
Tools
User contributions
Logs
View user groups
Special pages
search
Navigation
Main page
Statistical themes
Glossary
Categories
Statistics 4 beginners
Tutorials
Help
Eurostat home
Education corner
Online publications
Regional yearbook
Sustainable development
Full list
Tools
User contributions
Logs
View user groups
Special pages
Navigation
Main page
Statistical themes
Glossary
Categories
Statistics 4 beginners
Tutorials
Help
Eurostat home
Education corner
Online publications
Regional yearbook
Sustainable development
Full list
Tools
User contributions
Logs
View user groups
Special pages
Uploads by Mrliata
This special page shows all uploaded files.
File list
Items per page:
20
50
100
250
500
Search for media name:
Username:
Include old versions of files
Go
Date
Name
Thumbnail
Size
Description
Versions
12:04, 6 August 2009
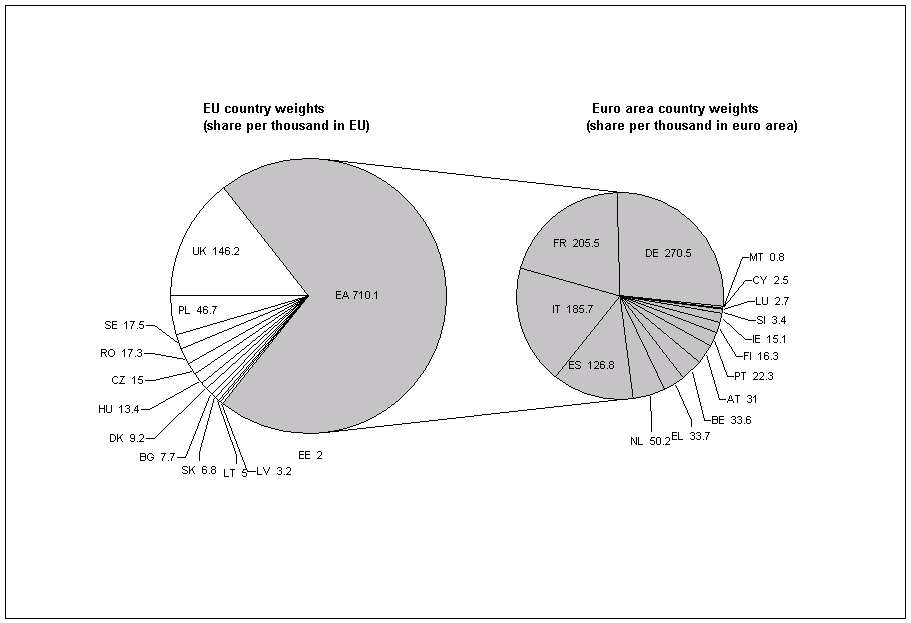
EU and euro area - country weights, 2008.PNG
(
file
)
24 KB
1
12:14, 6 August 2009
EU and euro area - country weights, 2008.png
(
file
)
24 KB
1
12:23, 6 August 2009
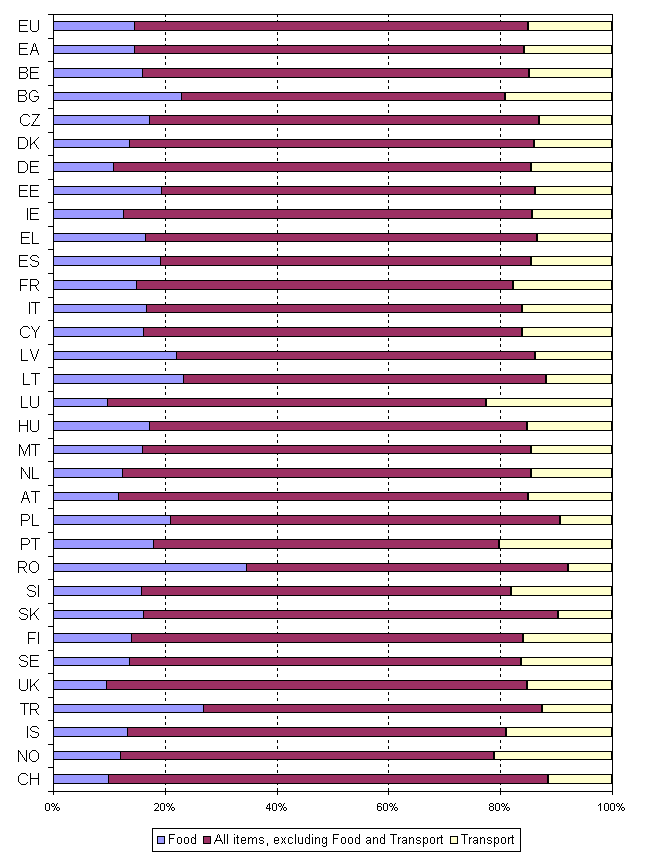
Share of HICP main headings in HFMCE, 2008.PNG
(
file
)
21 KB
1
13:55, 6 August 2009
HICP all-items annual average inflation rate 2001 2008.png
(
file
)
18 KB
1
13:59, 6 August 2009
Share of HICP main headings in HFCME, 2008.PNG
(
file
)
21 KB
1
14:29, 6 August 2009
HICP all-items annual average inflation rate 2001 2008.PNG
(
file
)
33 KB
1
14:35, 6 August 2009
HICP all-items annual average inflation rates JP US 2001 2008.PNG
(
file
)
17 KB
1
14:56, 6 August 2009
HICP main headings, annual average infl ation rate, EU, 2008 (%change compared with previous year).PNG
(
file
)
9 KB
1
09:16, 11 August 2009
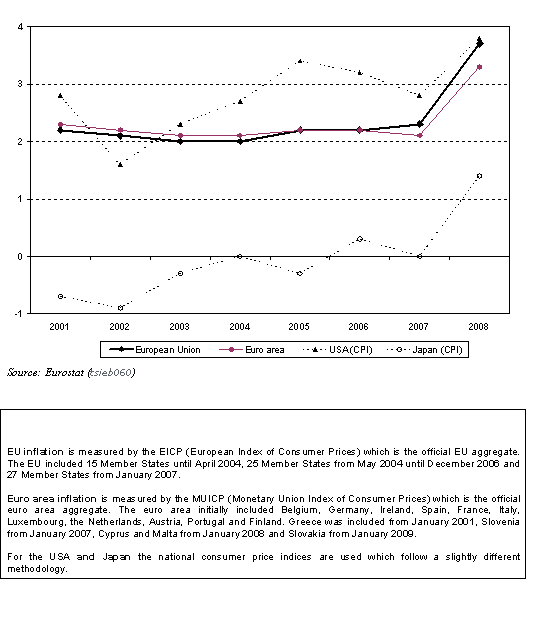
HICP all-items annual average inflation rates 2001-2008.PNG
(
file
)
12 KB
1
09:18, 11 August 2009
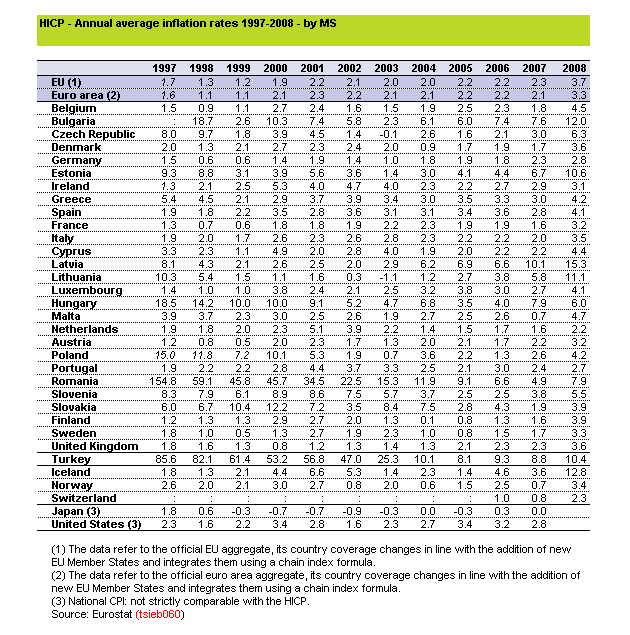
HICP all-items, annual average inflation rate (% change compared with previous year).PNG
(
file
)
31 KB
1
12:27, 17 August 2009
Annual average inflation rates, 2001-2008, in %.PNG
(
file
)
19 KB
1
14:59, 18 August 2009
Euro area - HICP main headings, annual average inflation rates, in %.PNG
(
file
)
12 KB
1
15:04, 18 August 2009
EU - HICP main headings, annual average inflation rates, in %.PNG
(
file
)
12 KB
1
15:57, 18 August 2009
EU - HICP all items & special aggregates, annual average inflation rates, in %.PNG
(
file
)
11 KB
1
16:54, 12 September 2014
Comparison foreign-controlled and domestic-controlled enterprises 2009.PNG
(
file
)
41 KB
3
16:59, 12 September 2014
Enterprises by ownership in EU28.JPG
(
file
)
41 KB
1
15:11, 23 September 2014
Share of foreign-controlled companies controlled by a non-EU country, in %.JPG
(
file
)
122 KB
1
Special page
ISSN 2443-8219


.PNG)

.PNG)


