Tutorials
Log in
Statistics Explained
menu
search
search
Navigation
Main page
Statistical themes
Glossary
Categories
Statistics 4 beginners
Tutorials
Help
Eurostat home
Education corner
Online publications
Regional yearbook
Sustainable development
Full list
Tools
User contributions
Logs
View user groups
Special pages
search
Navigation
Main page
Statistical themes
Glossary
Categories
Statistics 4 beginners
Tutorials
Help
Eurostat home
Education corner
Online publications
Regional yearbook
Sustainable development
Full list
Tools
User contributions
Logs
View user groups
Special pages
Navigation
Main page
Statistical themes
Glossary
Categories
Statistics 4 beginners
Tutorials
Help
Eurostat home
Education corner
Online publications
Regional yearbook
Sustainable development
Full list
Tools
User contributions
Logs
View user groups
Special pages
Uploads by Lupuiul
This special page shows all uploaded files.
File list
Items per page:
20
50
100
250
500
Search for media name:
Username:
Include old versions of files
Go
Date
Name
Thumbnail
Size
Description
Versions
12:33, 13 December 2017
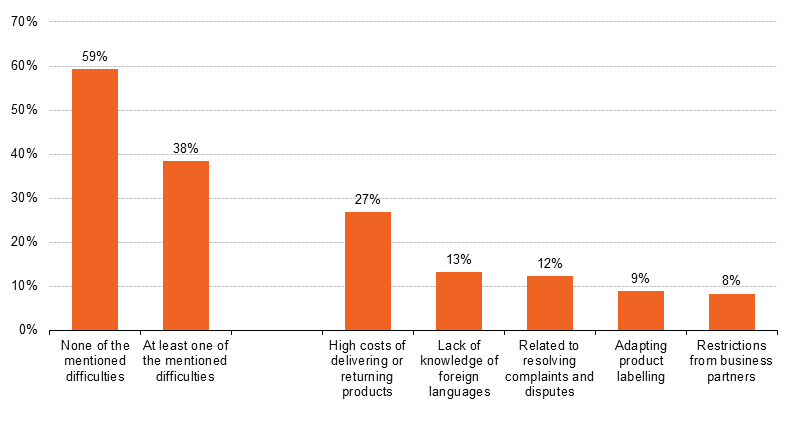
Difficulties experienced when selling to other EU countries, EU-28, 2016 (% of enterprises with web sales to other EU countries).png
(
file
)
16 KB
2
14:06, 13 December 2017
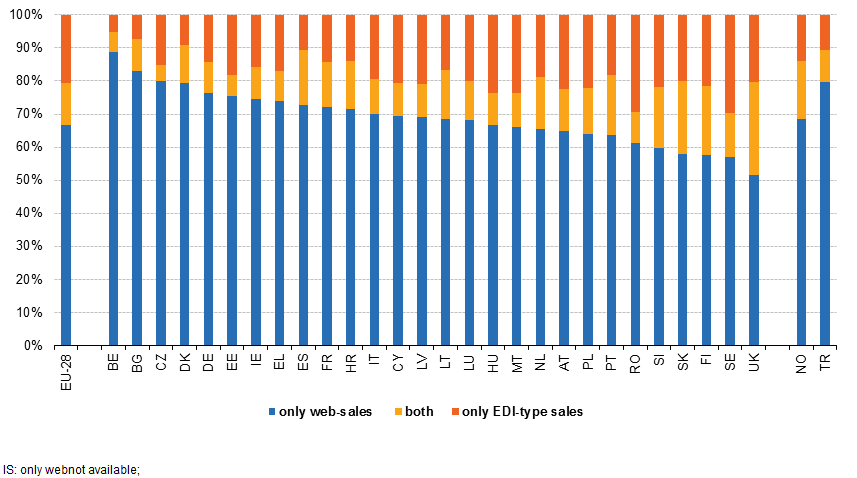
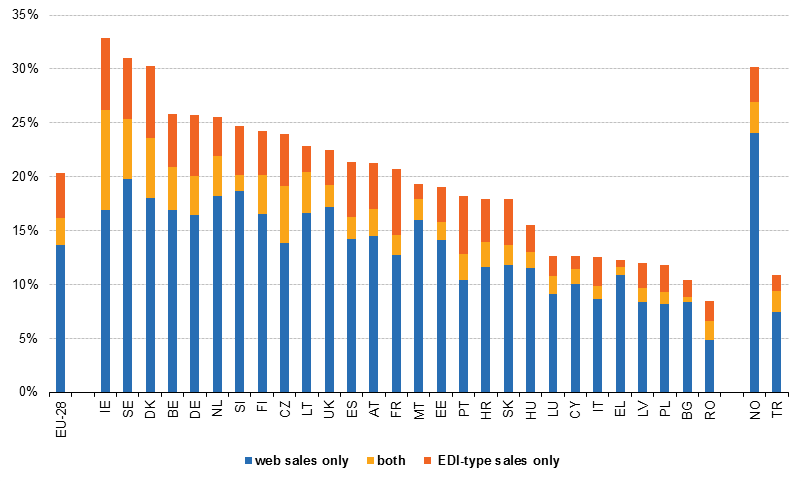
E-sales broken down by web and EDI-type sales, 2016 (% enterprises with e-sales).png
(
file
)
41 KB
4
15:31, 13 December 2017
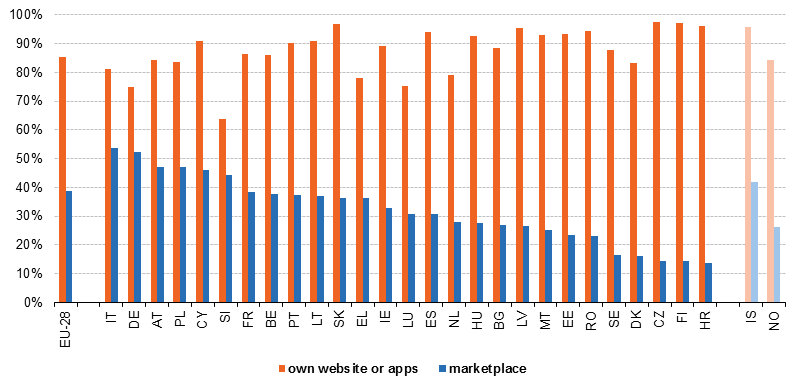
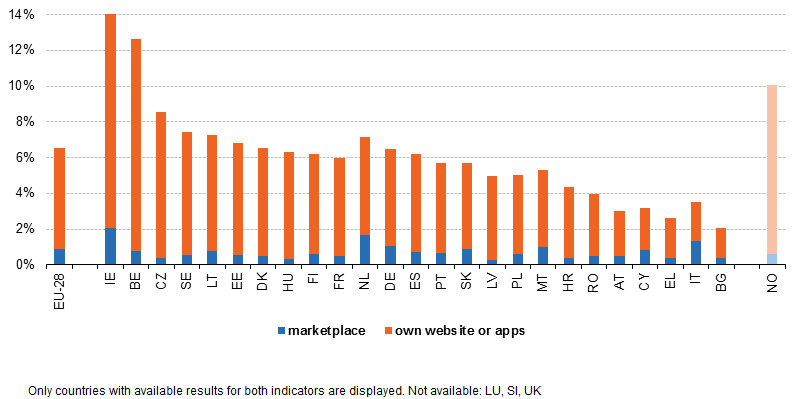
Web sales broken down by own website or apps and marketplace, 2016 (% enterprises with web sales).png
(
file
)
39 KB
6
15:40, 13 December 2017
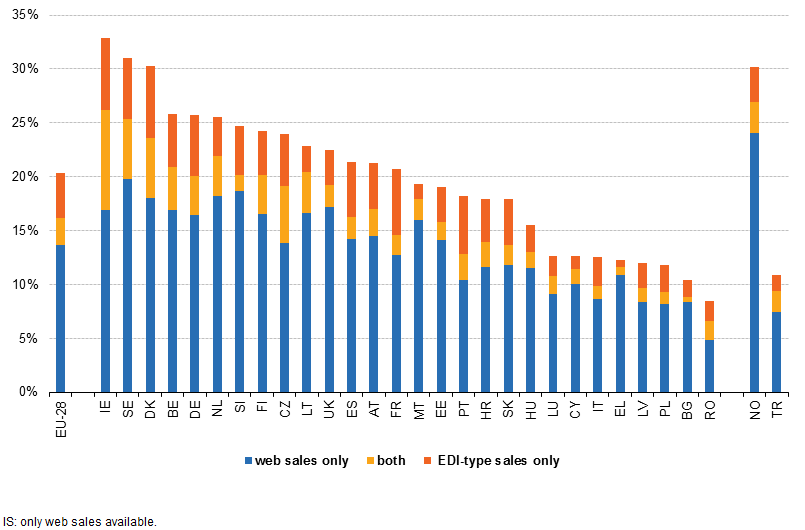
Web sales and EDI-type sales, 2016 (% enterprises).png
(
file
)
32 KB
6
16:25, 13 December 2017
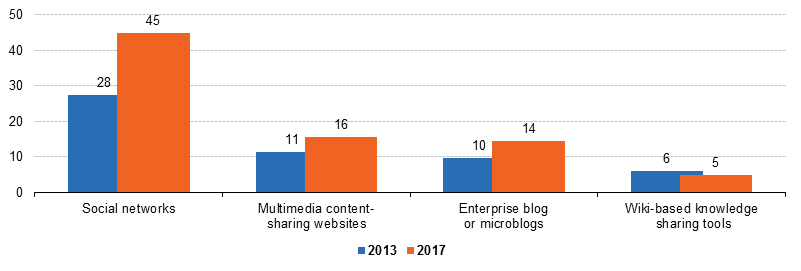
V1 Enterprises using social media, by type of social media, EU-28, 2017 and 2013 (% of enterprises).png
(
file
)
10 KB
2
16:43, 13 December 2017
Turnover from web sales broken down by own website or apps and marketplace, 2016 (% total turnover).png
(
file
)
20 KB
2
10:59, 14 December 2017
E-sales, 2015 (% enterprises) V2.png
(
file
)
30 KB
2
11:01, 14 December 2017
V1 E-sales broken down by web and EDI-type sales, 2016 (% enterprises).png
(
file
)
30 KB
2
11:02, 14 December 2017
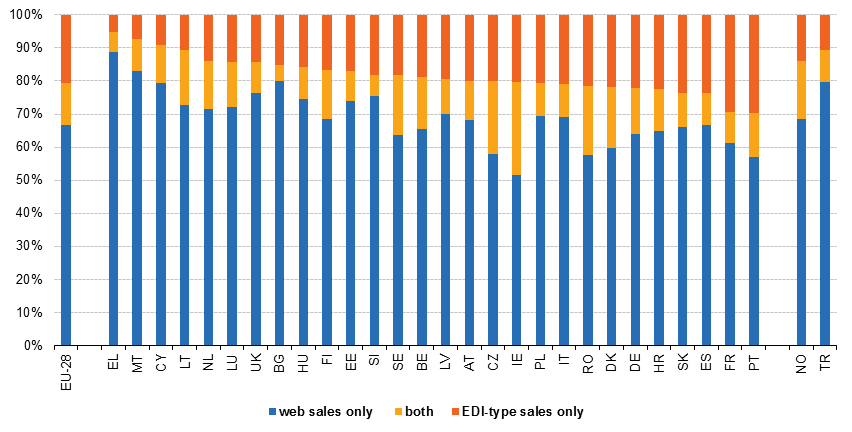
V1 E-sales broken down by web and EDI-type sales, 2016 (% enterprises with e-sales).png
(
file
)
40 KB
2
14:25, 15 December 2017
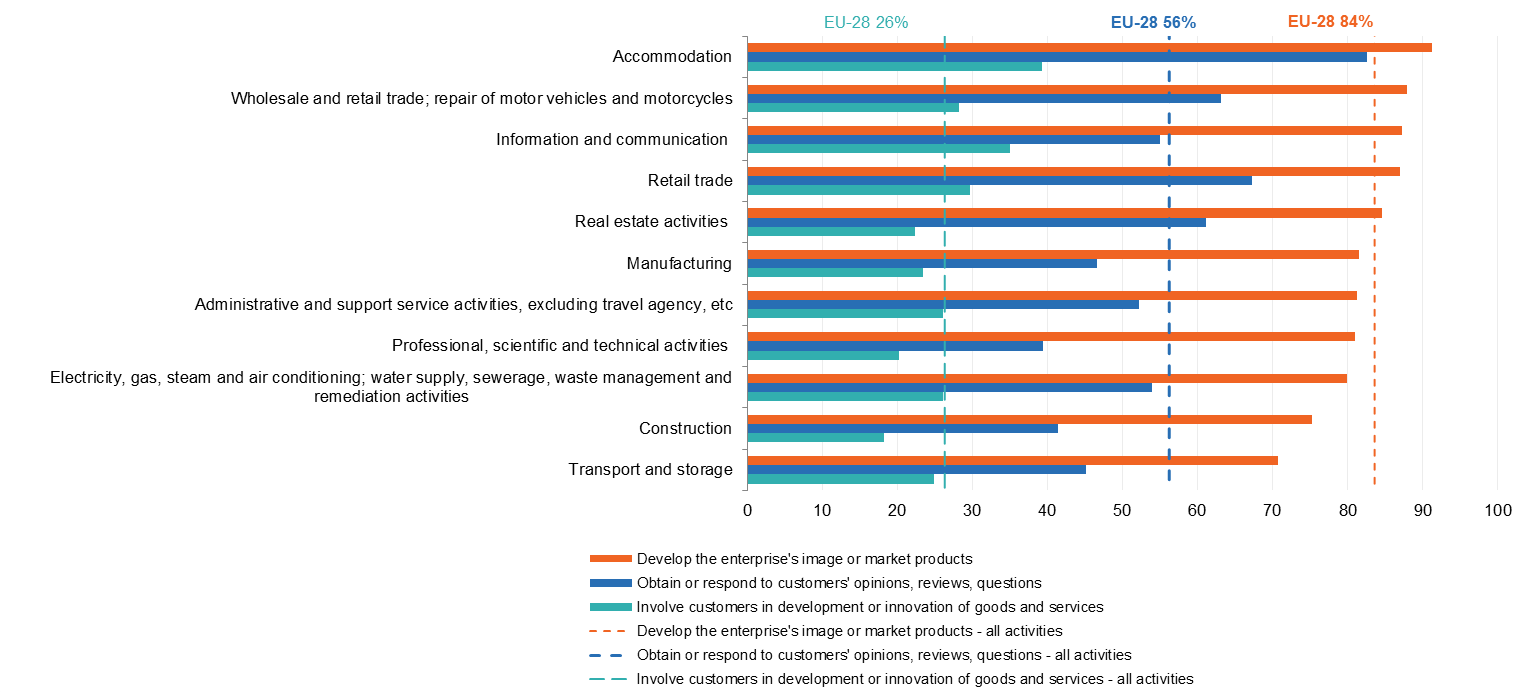
Enterprises using social media, by purpose and economic activity, EU28, 2017 (% of enterprises using social media).png
(
file
)
49 KB
2
15:30, 15 December 2017
Enterprises using social networks, 2013 and 2015 (% of enterprises).png
(
file
)
29 KB
2
18:09, 18 December 2017
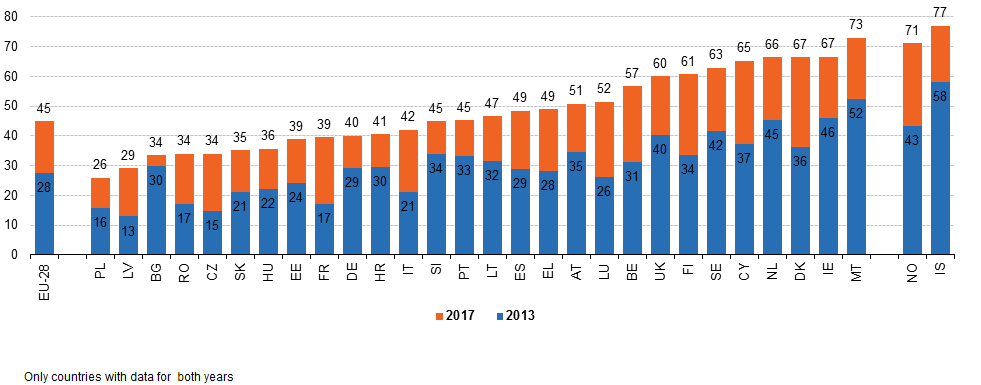
Enterprises using social networks, 2017 and 2013 (% of enterprises).png
(
file
)
29 KB
2
18:10, 18 December 2017
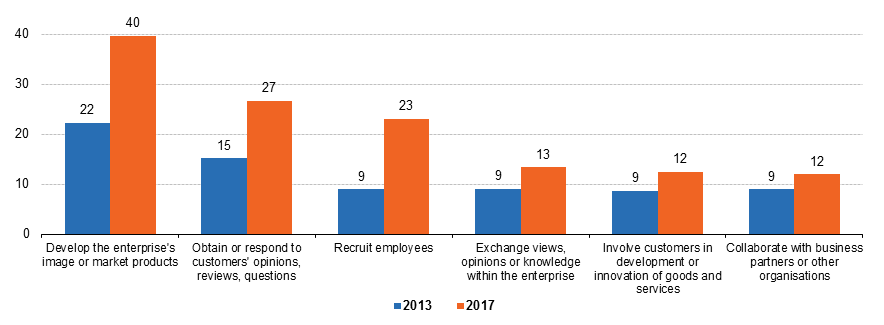
Enterprises using social media, by purpose of use, EU-28, 2017 and 2013 (% of enterprises).png
(
file
)
16 KB
3
11:53, 3 April 2018
Digital economy and society - enterprises FP2018 03042018.xlsx
(
file
)
110 KB
2
Special page
ISSN 2443-8219
.png)
.png)
.png)
.png)
.png)
.png)
_V2.png)
.png)
.png)
.png)
.png)
.png)
.png)