Tutorials
Log in
Statistics Explained
menu
search
search
Navigation
Main page
Statistical themes
Glossary
Categories
Statistics 4 beginners
Tutorials
Help
Eurostat home
Education corner
Online publications
Regional yearbook
Sustainable development
Full list
Tools
User contributions
Logs
View user groups
Special pages
search
Navigation
Main page
Statistical themes
Glossary
Categories
Statistics 4 beginners
Tutorials
Help
Eurostat home
Education corner
Online publications
Regional yearbook
Sustainable development
Full list
Tools
User contributions
Logs
View user groups
Special pages
Navigation
Main page
Statistical themes
Glossary
Categories
Statistics 4 beginners
Tutorials
Help
Eurostat home
Education corner
Online publications
Regional yearbook
Sustainable development
Full list
Tools
User contributions
Logs
View user groups
Special pages
Uploads by Lienhav
This special page shows all uploaded files.
File list
Items per page:
20
50
100
250
500
Search for media name:
Username:
Include old versions of files
Go
First page
Previous page
Next page
Last page
Date
Name
Thumbnail
Size
Description
Versions
17:56, 8 March 2016
Untitled1.gif
(
file
)
558 KB
employment rate, 20-64, 2002-2015
1
16:22, 9 March 2016
V2-20-per-cent.gif
(
file
)
244 KB
1
16:08, 22 April 2016
Empl rate 2015 1.png
(
file
)
458 KB
1
16:09, 22 April 2016
Empl rate 2015 3.png
(
file
)
16 KB
1
16:10, 22 April 2016
Empl rate 2015 4.1.png
(
file
)
87 KB
1
16:10, 22 April 2016
Empl rate 2015 4.2.png
(
file
)
71 KB
1
12:16, 25 April 2016
Empl rate 2015 4.1 updated.png
(
file
)
59 KB
1
12:17, 25 April 2016
Empl rate 2015 4.2 updated.png
(
file
)
49 KB
1
10:01, 11 May 2016
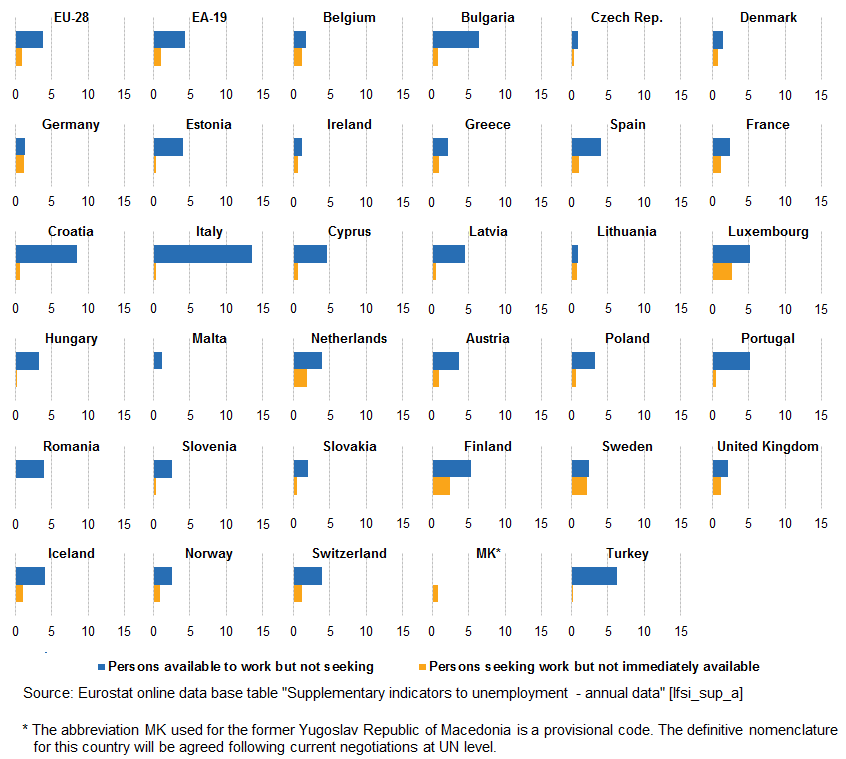
Lfs supplementary indicators 2015 figure 1.png
(
file
)
24 KB
1
10:01, 11 May 2016
Lfs supplementary indicators 2015 figure 2.png
(
file
)
28 KB
1
10:01, 11 May 2016
Lfs supplementary indicators 2015 figure 3.png
(
file
)
23 KB
1
10:02, 11 May 2016
Lfs supplementary indicators 2015 figure 5.png
(
file
)
17 KB
1
10:02, 11 May 2016
Lfs supplementary indicators 2015 figure 6.png
(
file
)
20 KB
1
10:03, 11 May 2016
Lfs supplementary indicators 2015 figure 7.png
(
file
)
17 KB
1
11:58, 11 May 2016
Lfs supplementary indicators 2015 figure 1b.png
(
file
)
19 KB
1
14:50, 11 May 2016
Lfs supplementary indicators 2015 figure 2b.png
(
file
)
27 KB
1
16:18, 11 May 2016
Lfs supplementary indicators 2015 figure 3b.png
(
file
)
189 KB
1
14:13, 13 May 2016
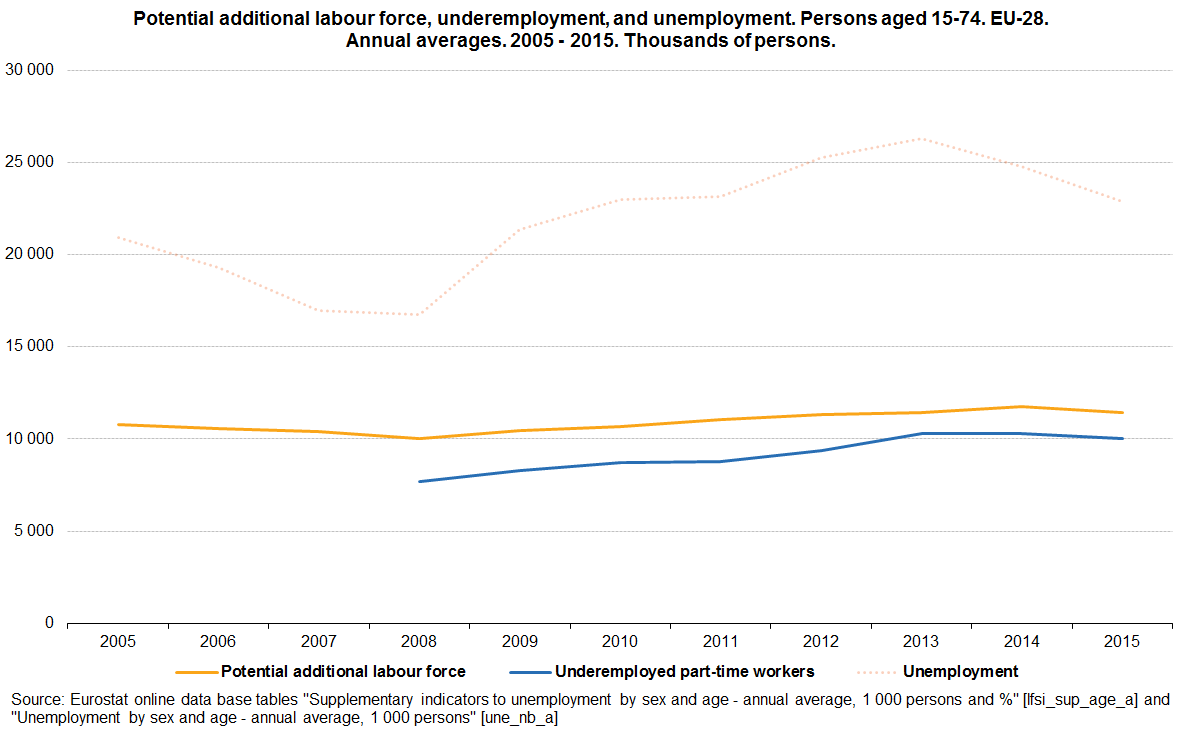
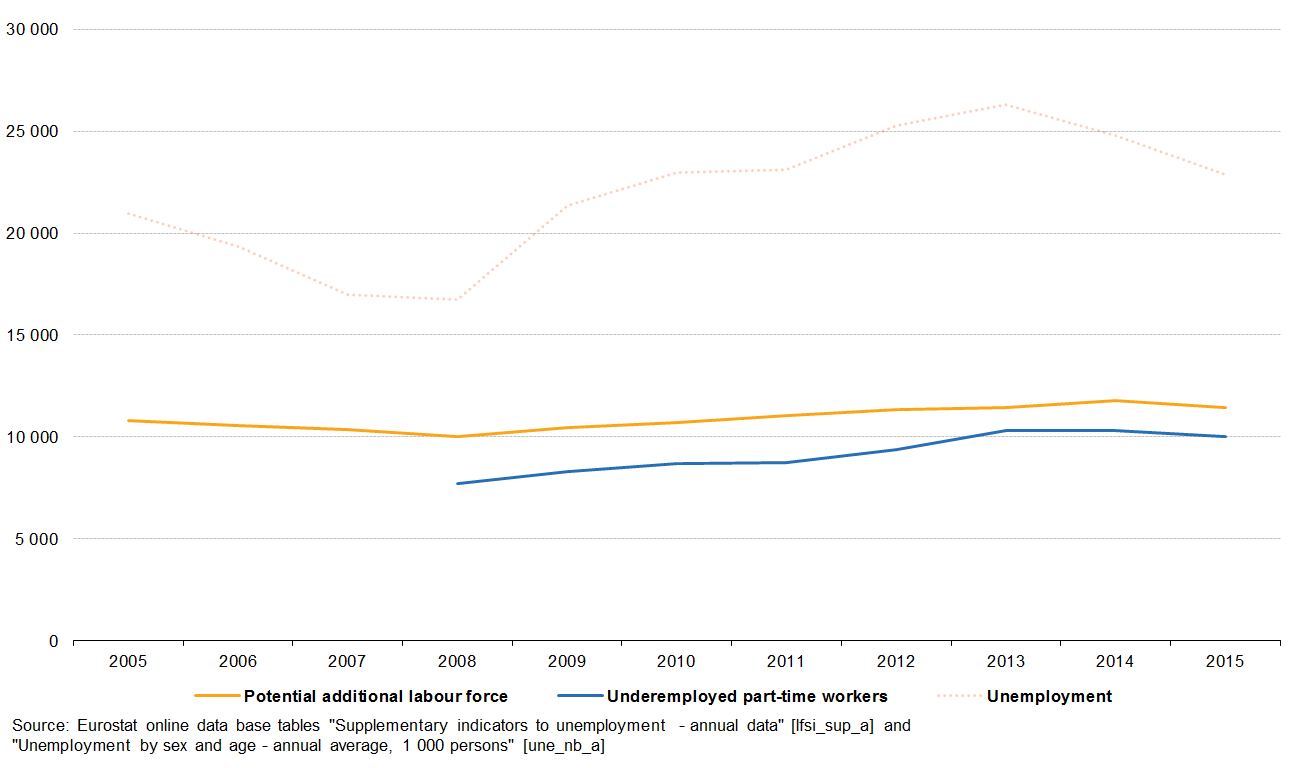
Potential additional labour force, underemployment and unemployment, persons aged 15-74, EU-28, annual averages, 2005 - 2015 (thousand persons).png
(
file
)
21 KB
1
14:14, 13 May 2016
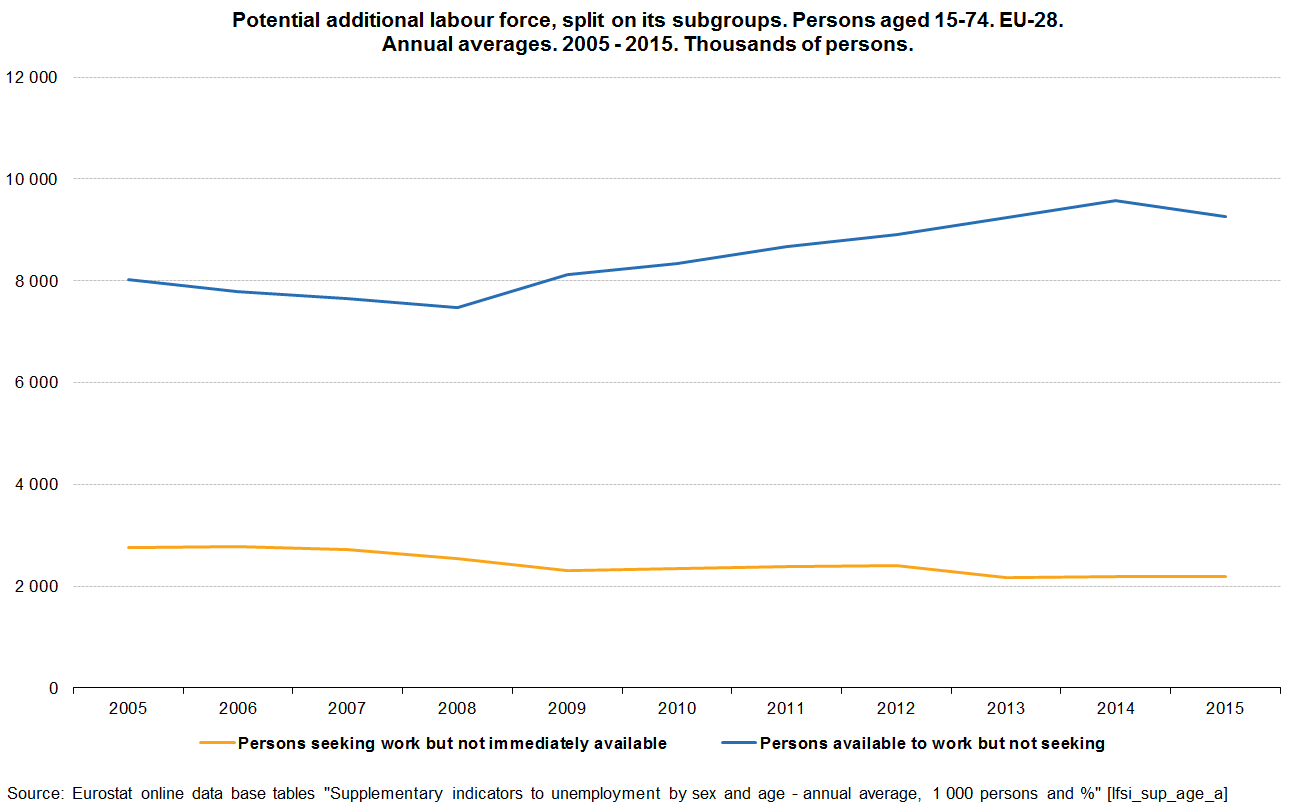
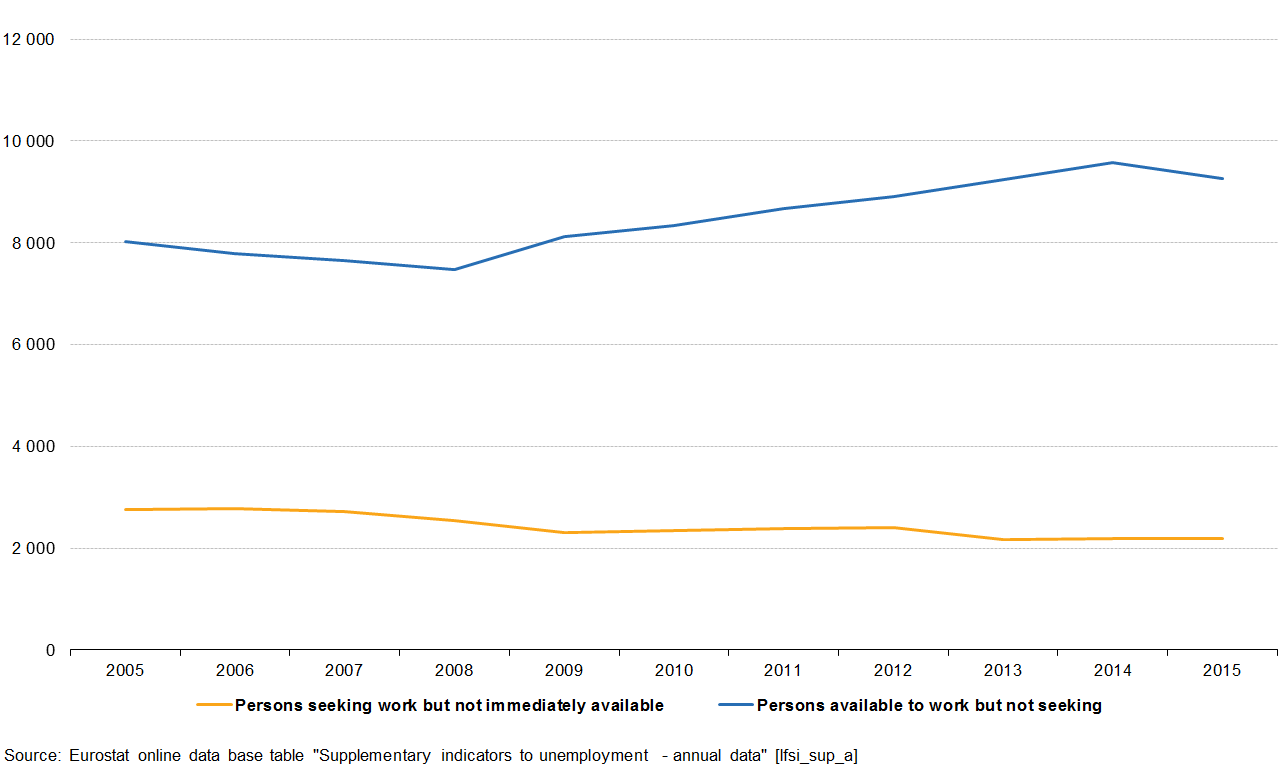
Potential additional labour force, split on its subgroups, persons aged 15-74, EU-28, annual averages, 2005 - 2015 (thousand persons).png
(
file
)
15 KB
1
14:16, 13 May 2016
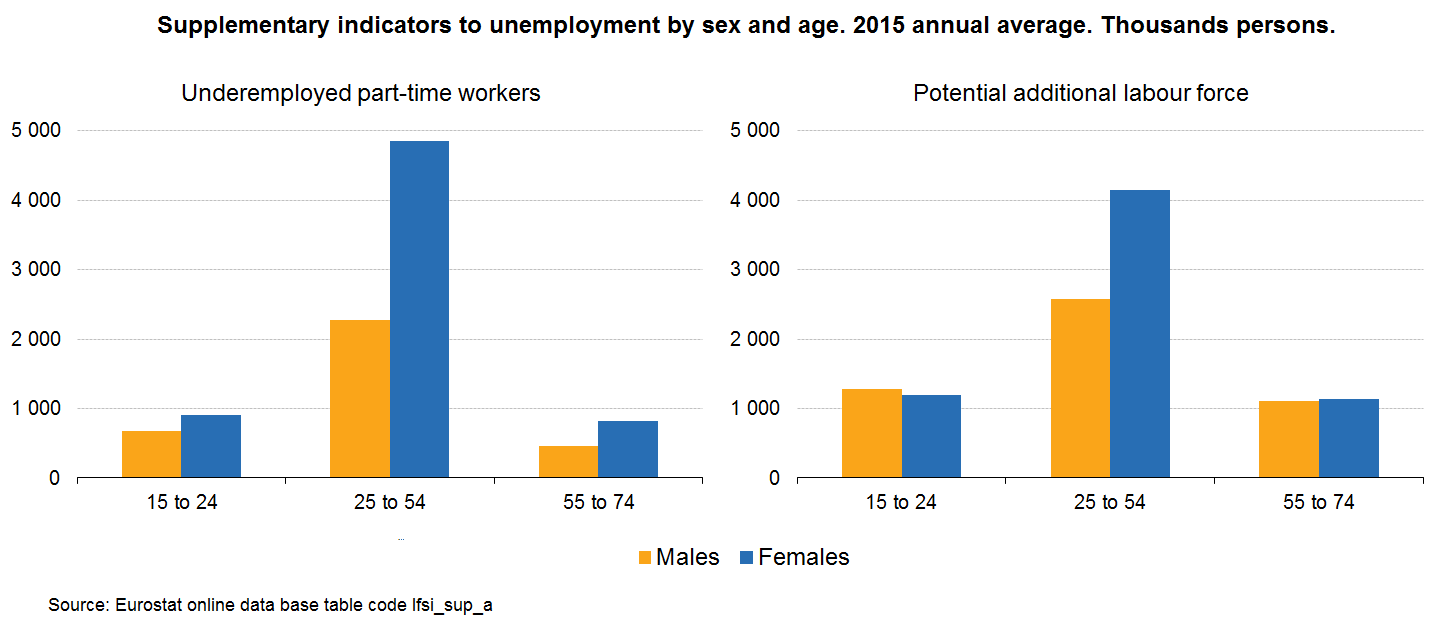
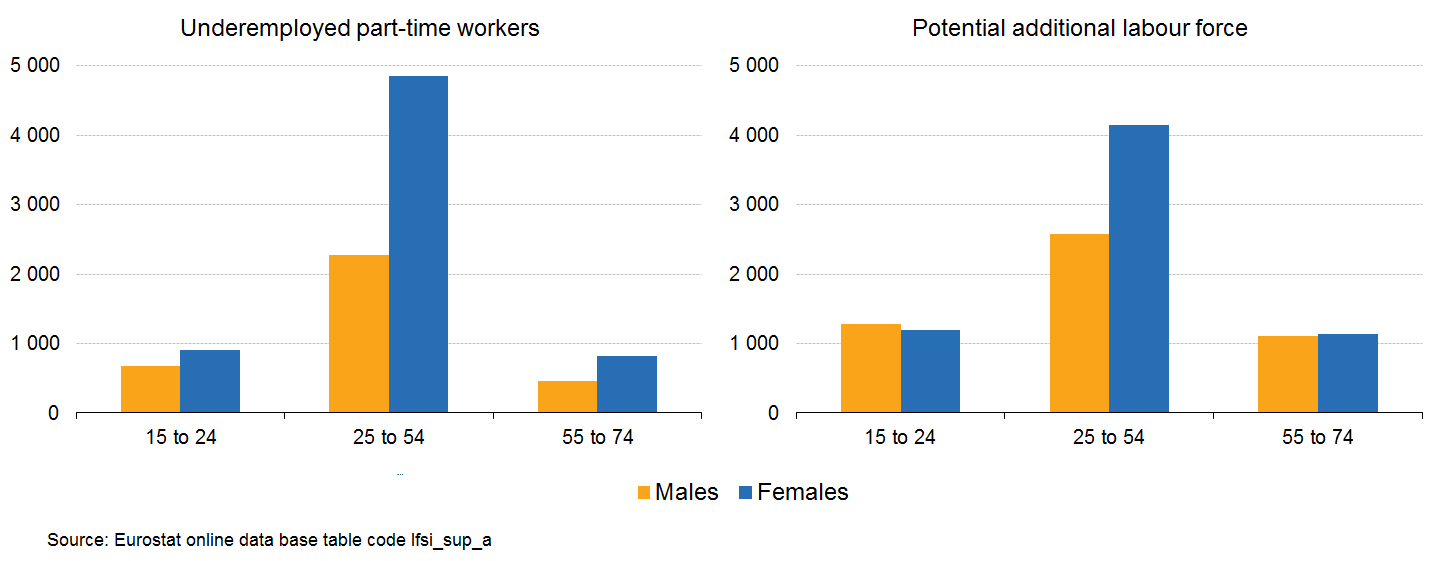
Supplementary indicators to unemployment by sex and age, persons aged 15-74, EU-28, annual average, 2015 (thousand persons).png
(
file
)
13 KB
1
14:16, 13 May 2016
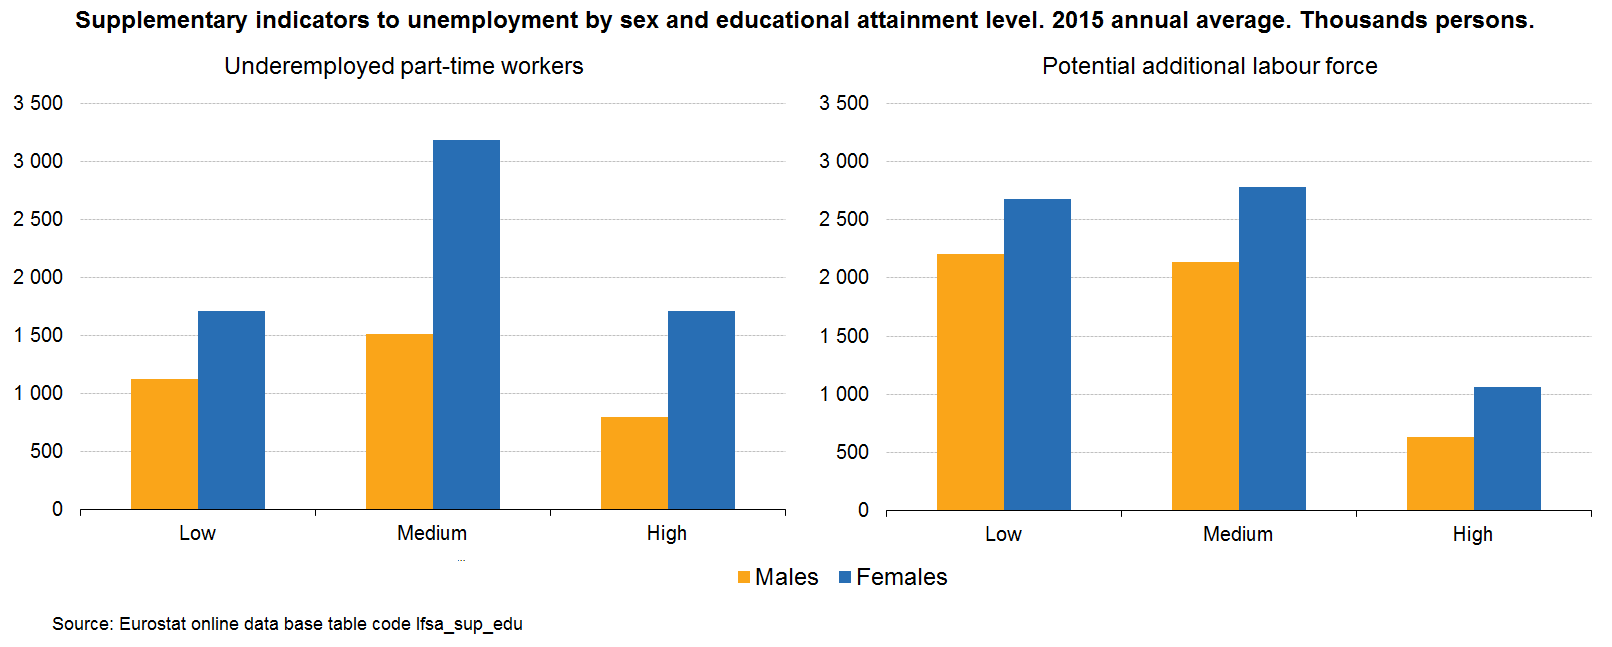
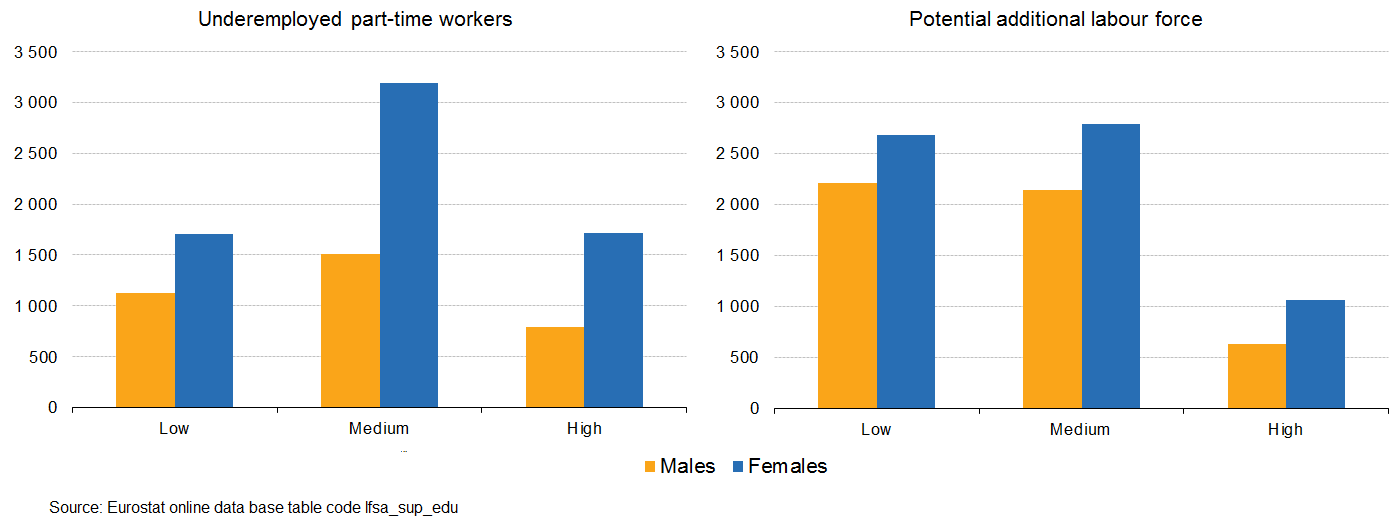
Supplementary indicators to unemployment by sex and educational attainment level, persons aged 15-74, EU-28, annual average, 2015 (thousand persons).png
(
file
)
14 KB
1
14:22, 13 May 2016
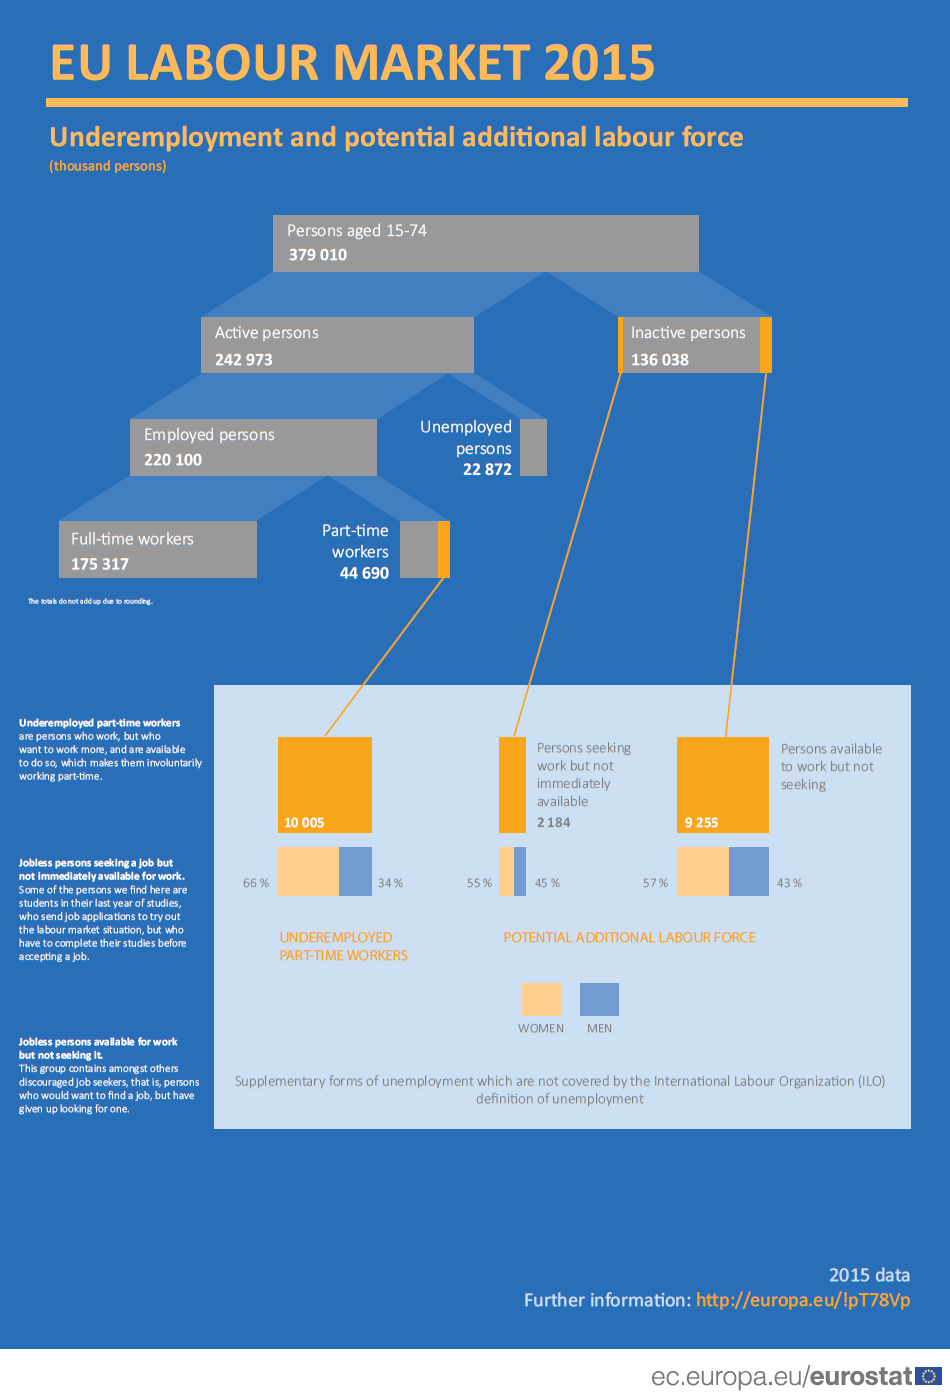
Supplementary indicators to unemployment. Population definition. Persons aged 15-74. EU-28. 2015. Thousands of persons and per cent.png
(
file
)
139 KB
1
11:48, 18 May 2016
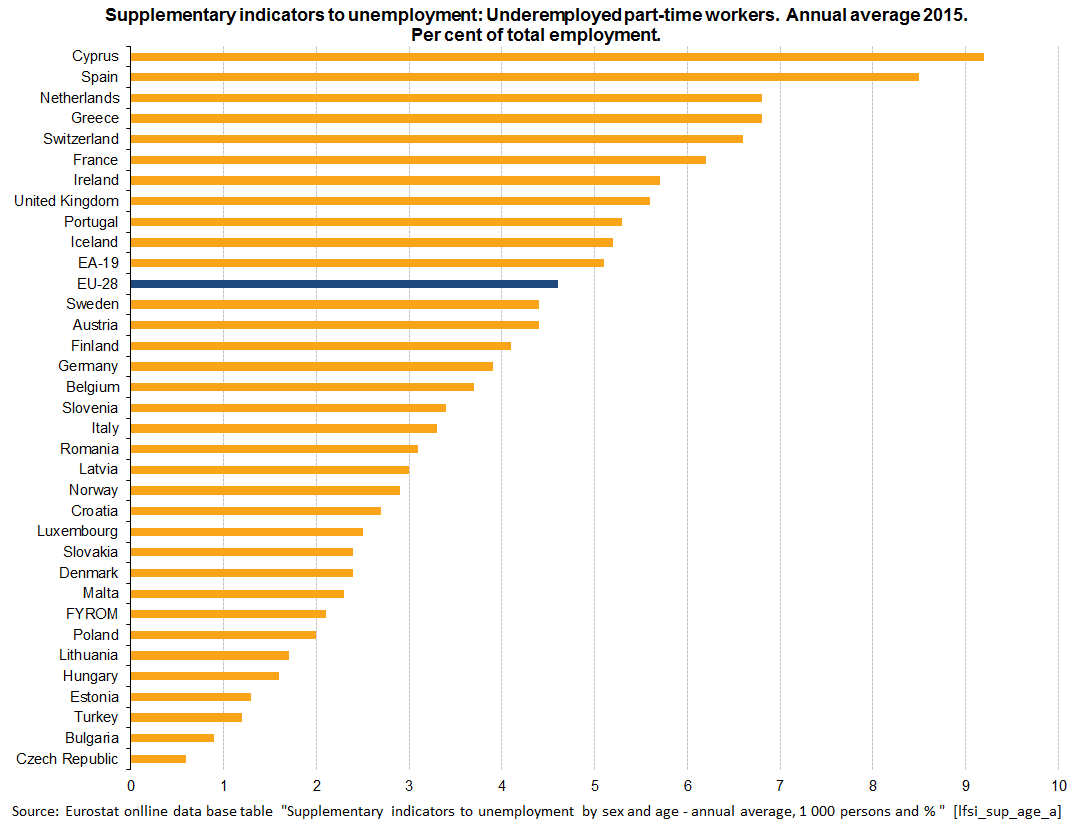
Underemployed part-time workers, persons aged 15-74, all countries, EA-19 and EU-28, annual average, 2015 (% of total employment).png
(
file
)
24 KB
note for MK
3
11:50, 18 May 2016
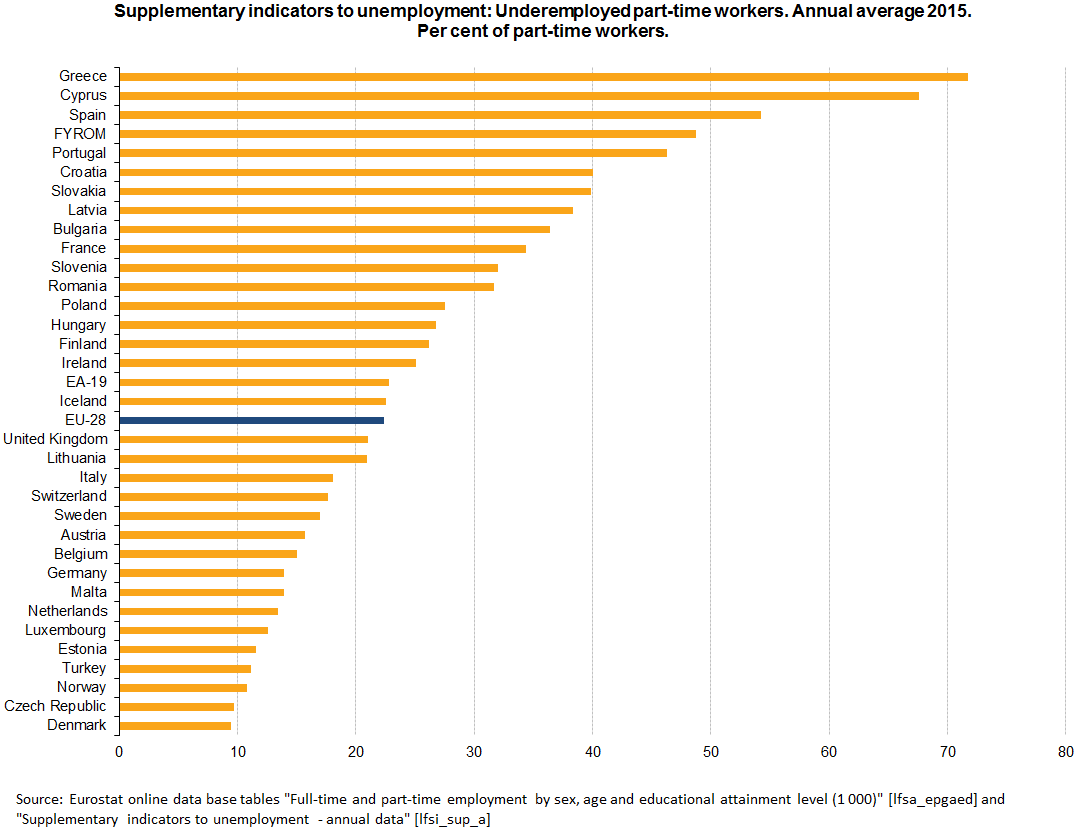
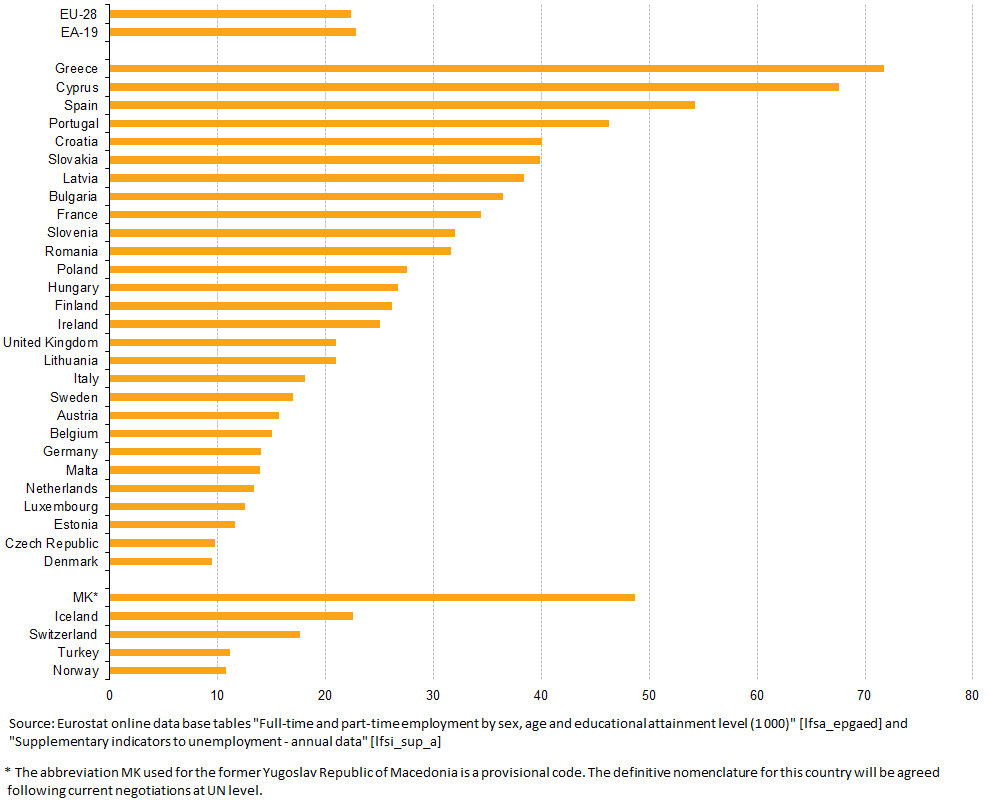
Underemployed part-time workers, persons aged 15-74, all countries, EA-19 and EU-28, annual average, 2015 (% of part-time workers).png
(
file
)
25 KB
note for MK
4
11:52, 18 May 2016
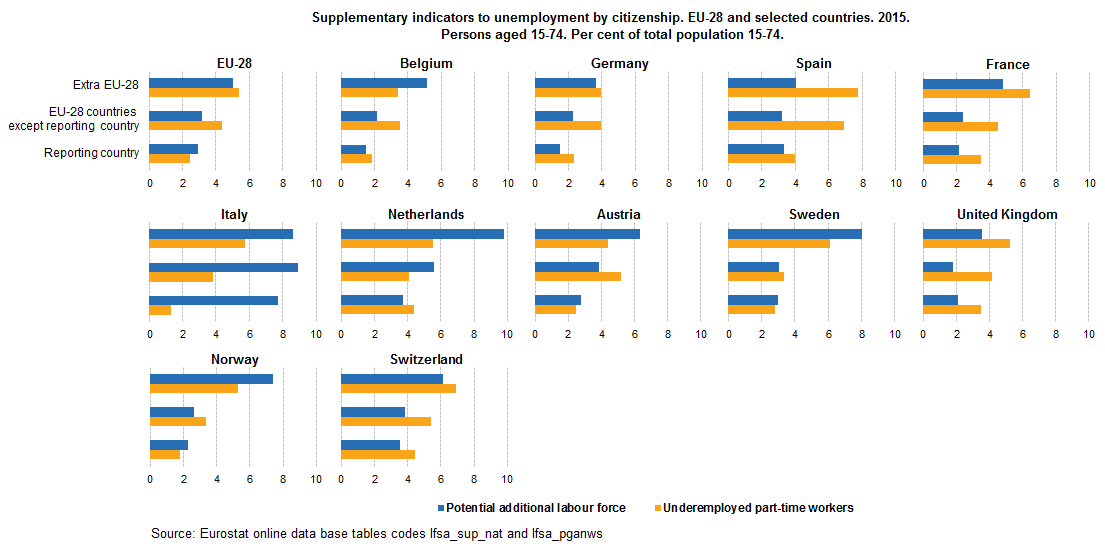
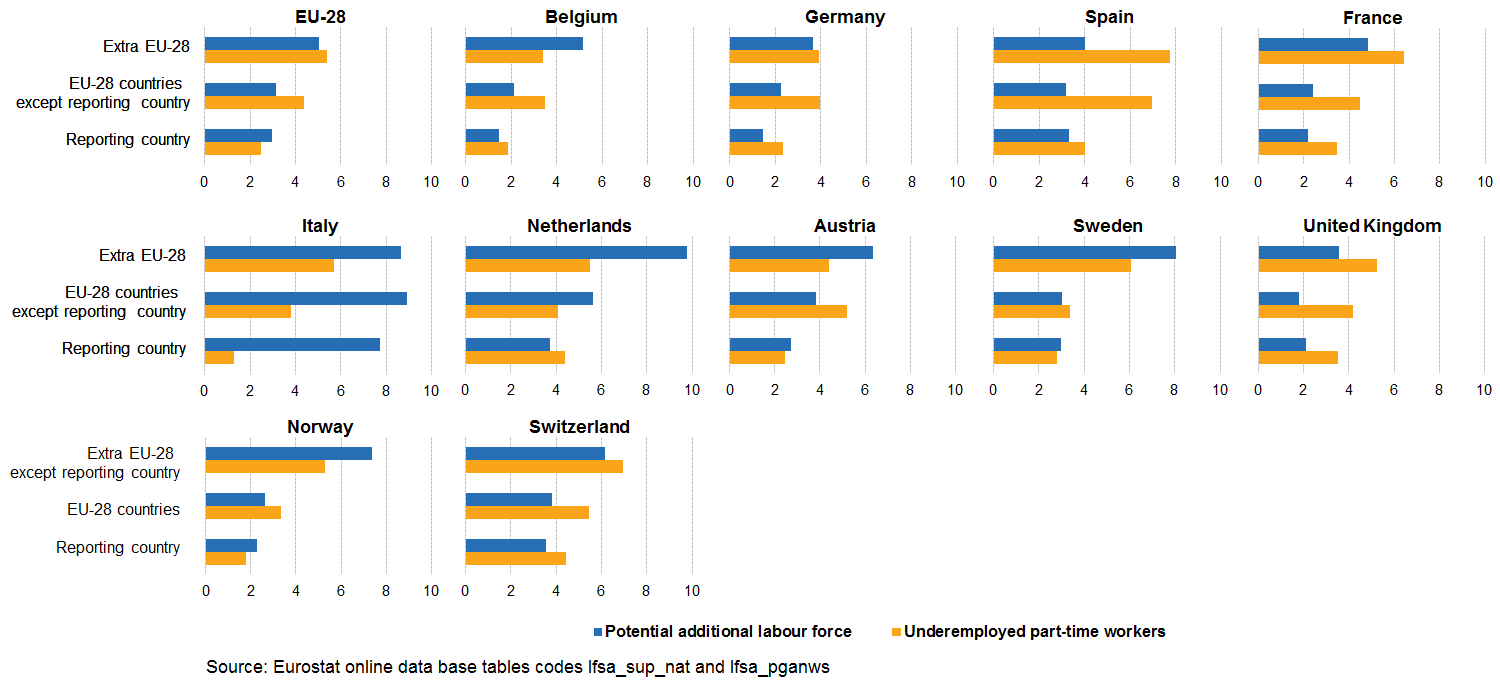
Supplementary indicators to unemployment by citizenship, persons aged 15-74, EU-28 and selected countries, annual average, 2015 (% of total population aged 15-74).png
(
file
)
28 KB
removed title line
3
12:18, 18 May 2016
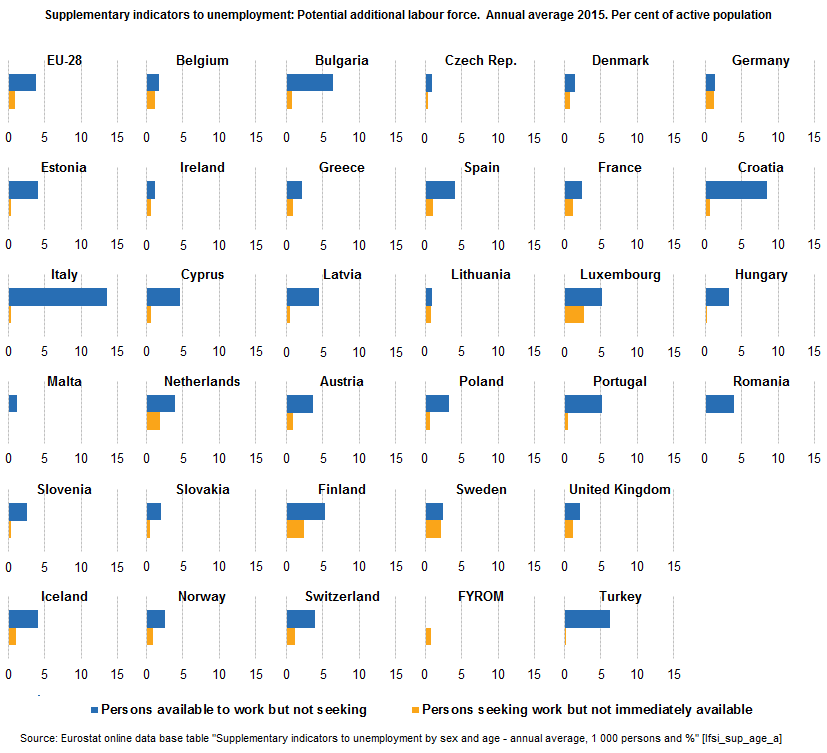
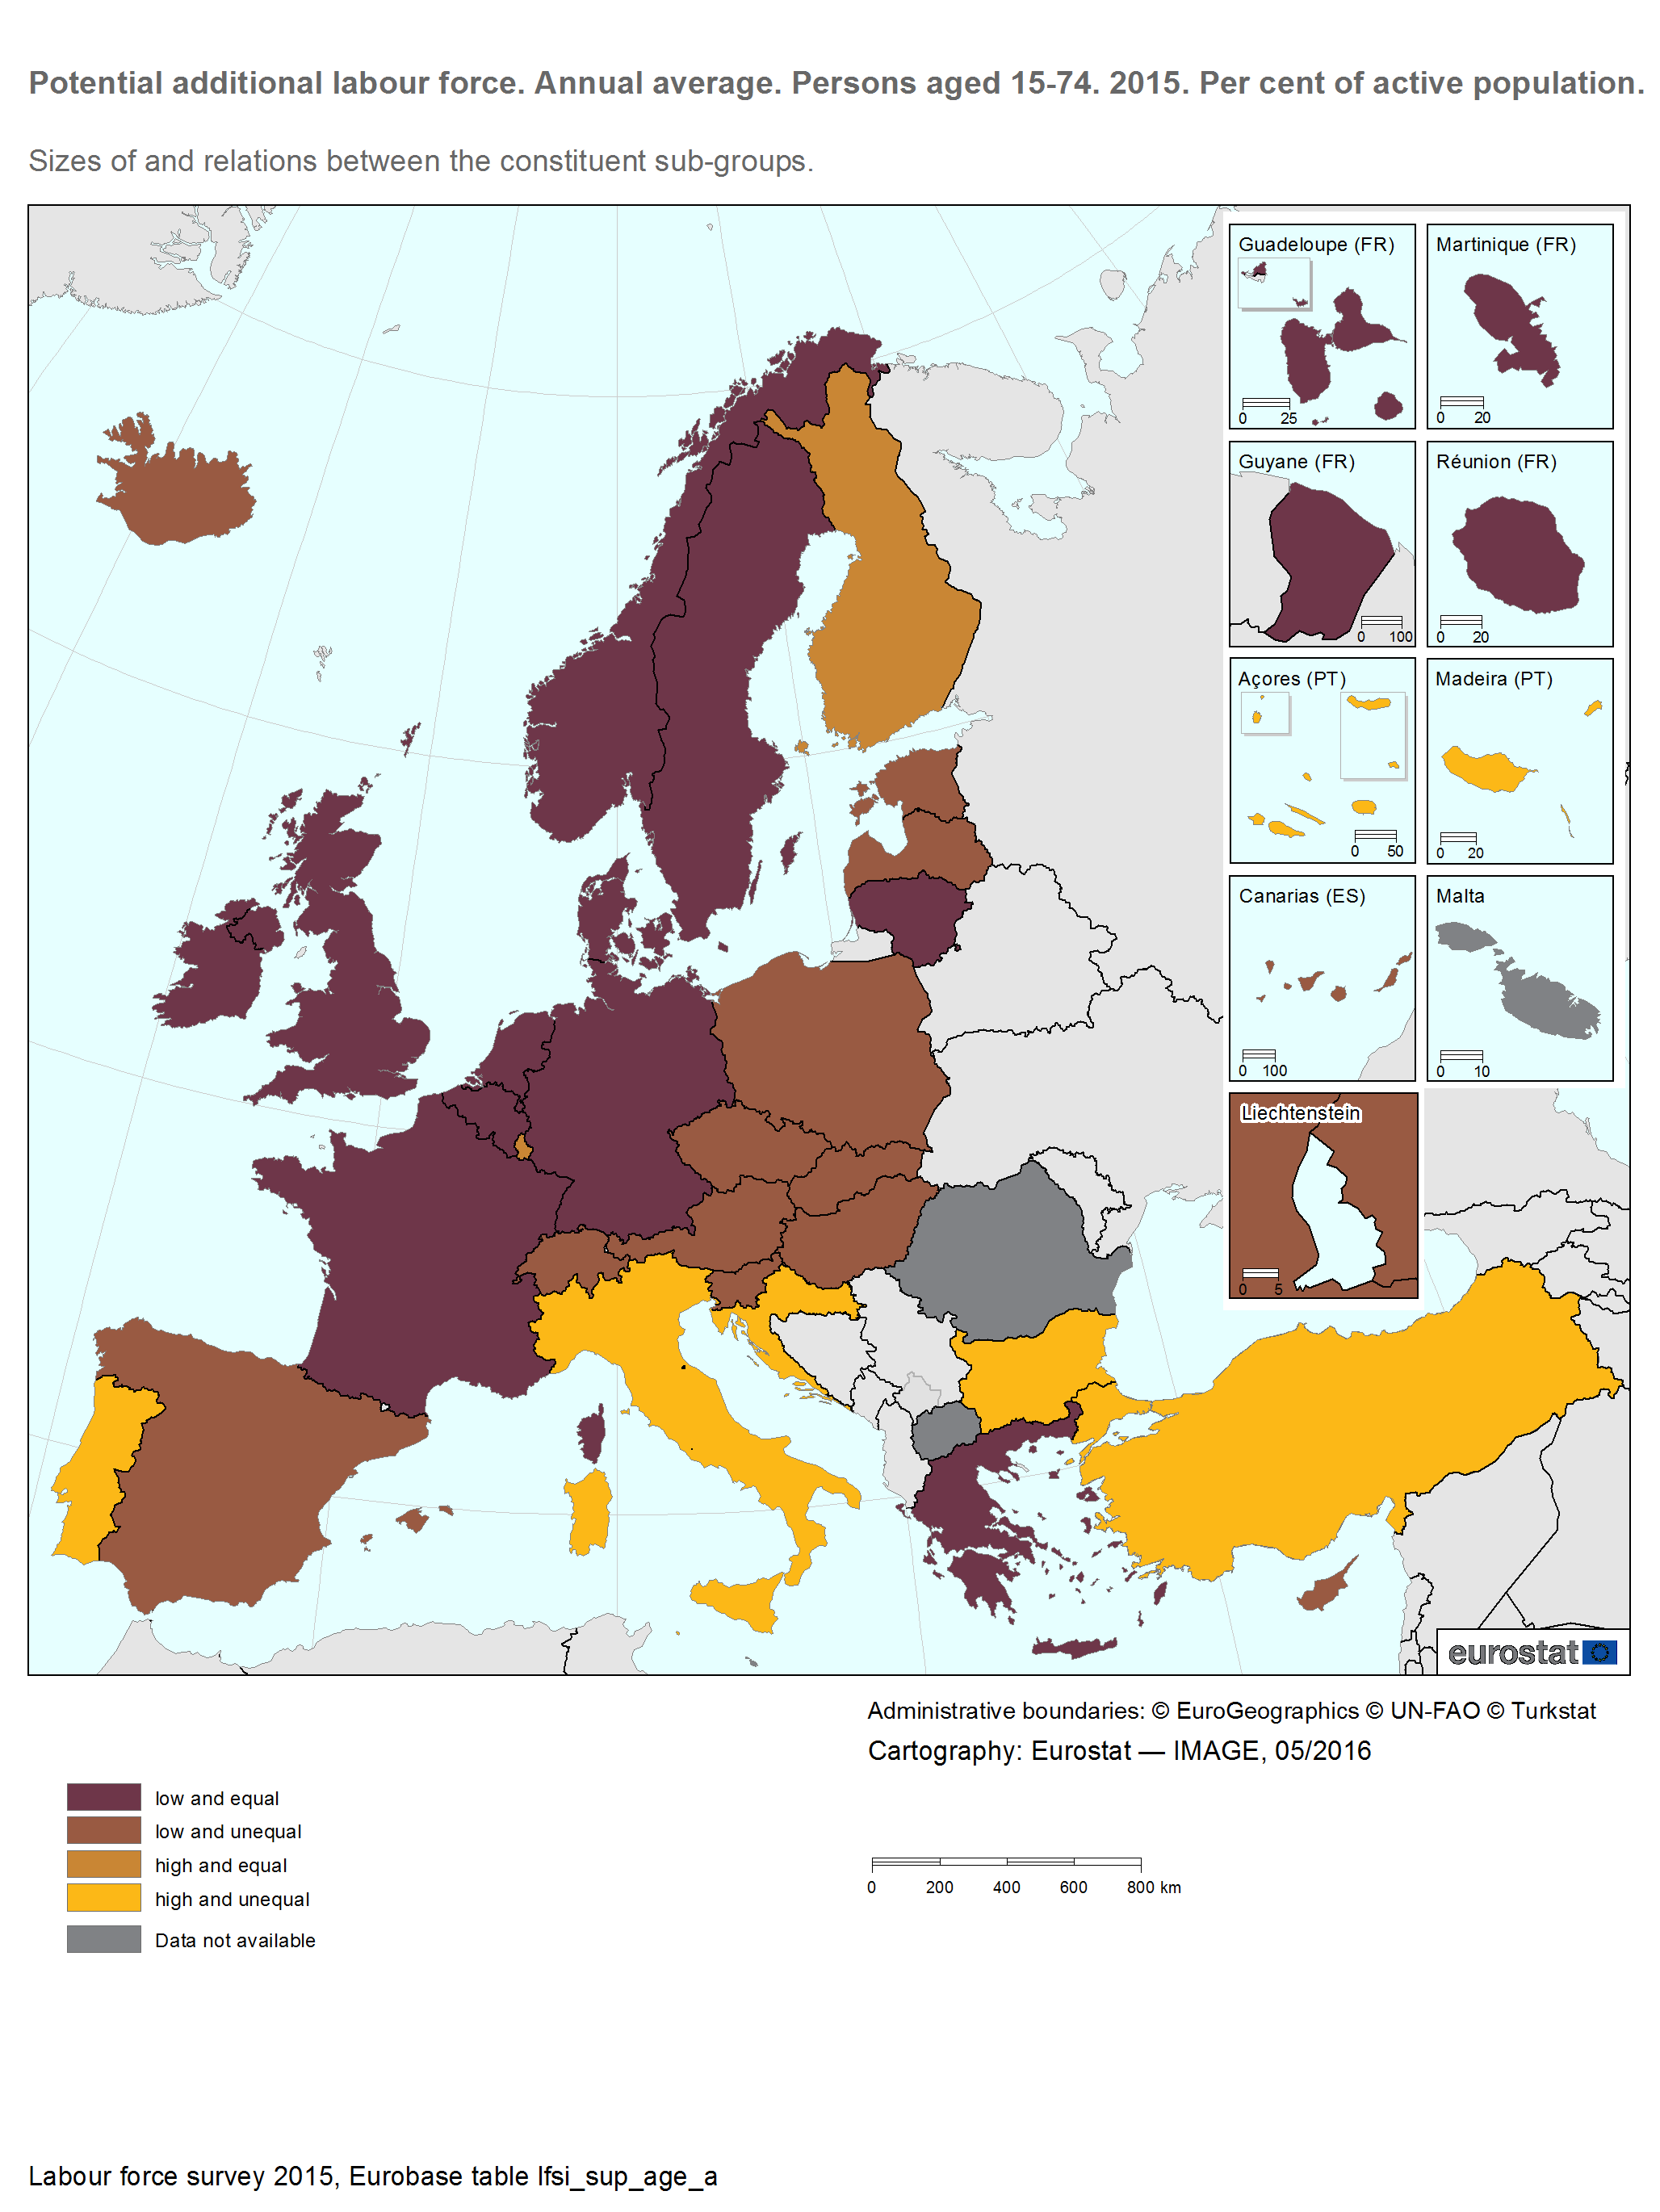
Potential additional labour force by its subgroups, persons aged 15-74, all countries, EA-19 and EU-28, annual average, 2015 (% of active population).png
(
file
)
25 KB
added note for MK
2
16:20, 18 May 2016
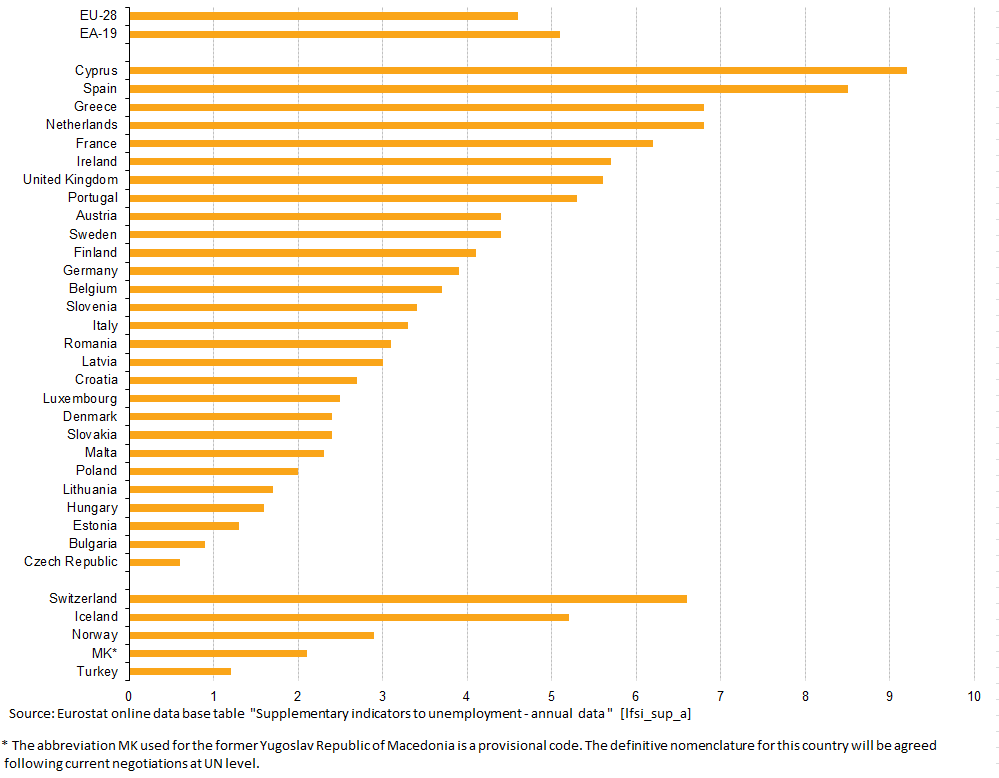
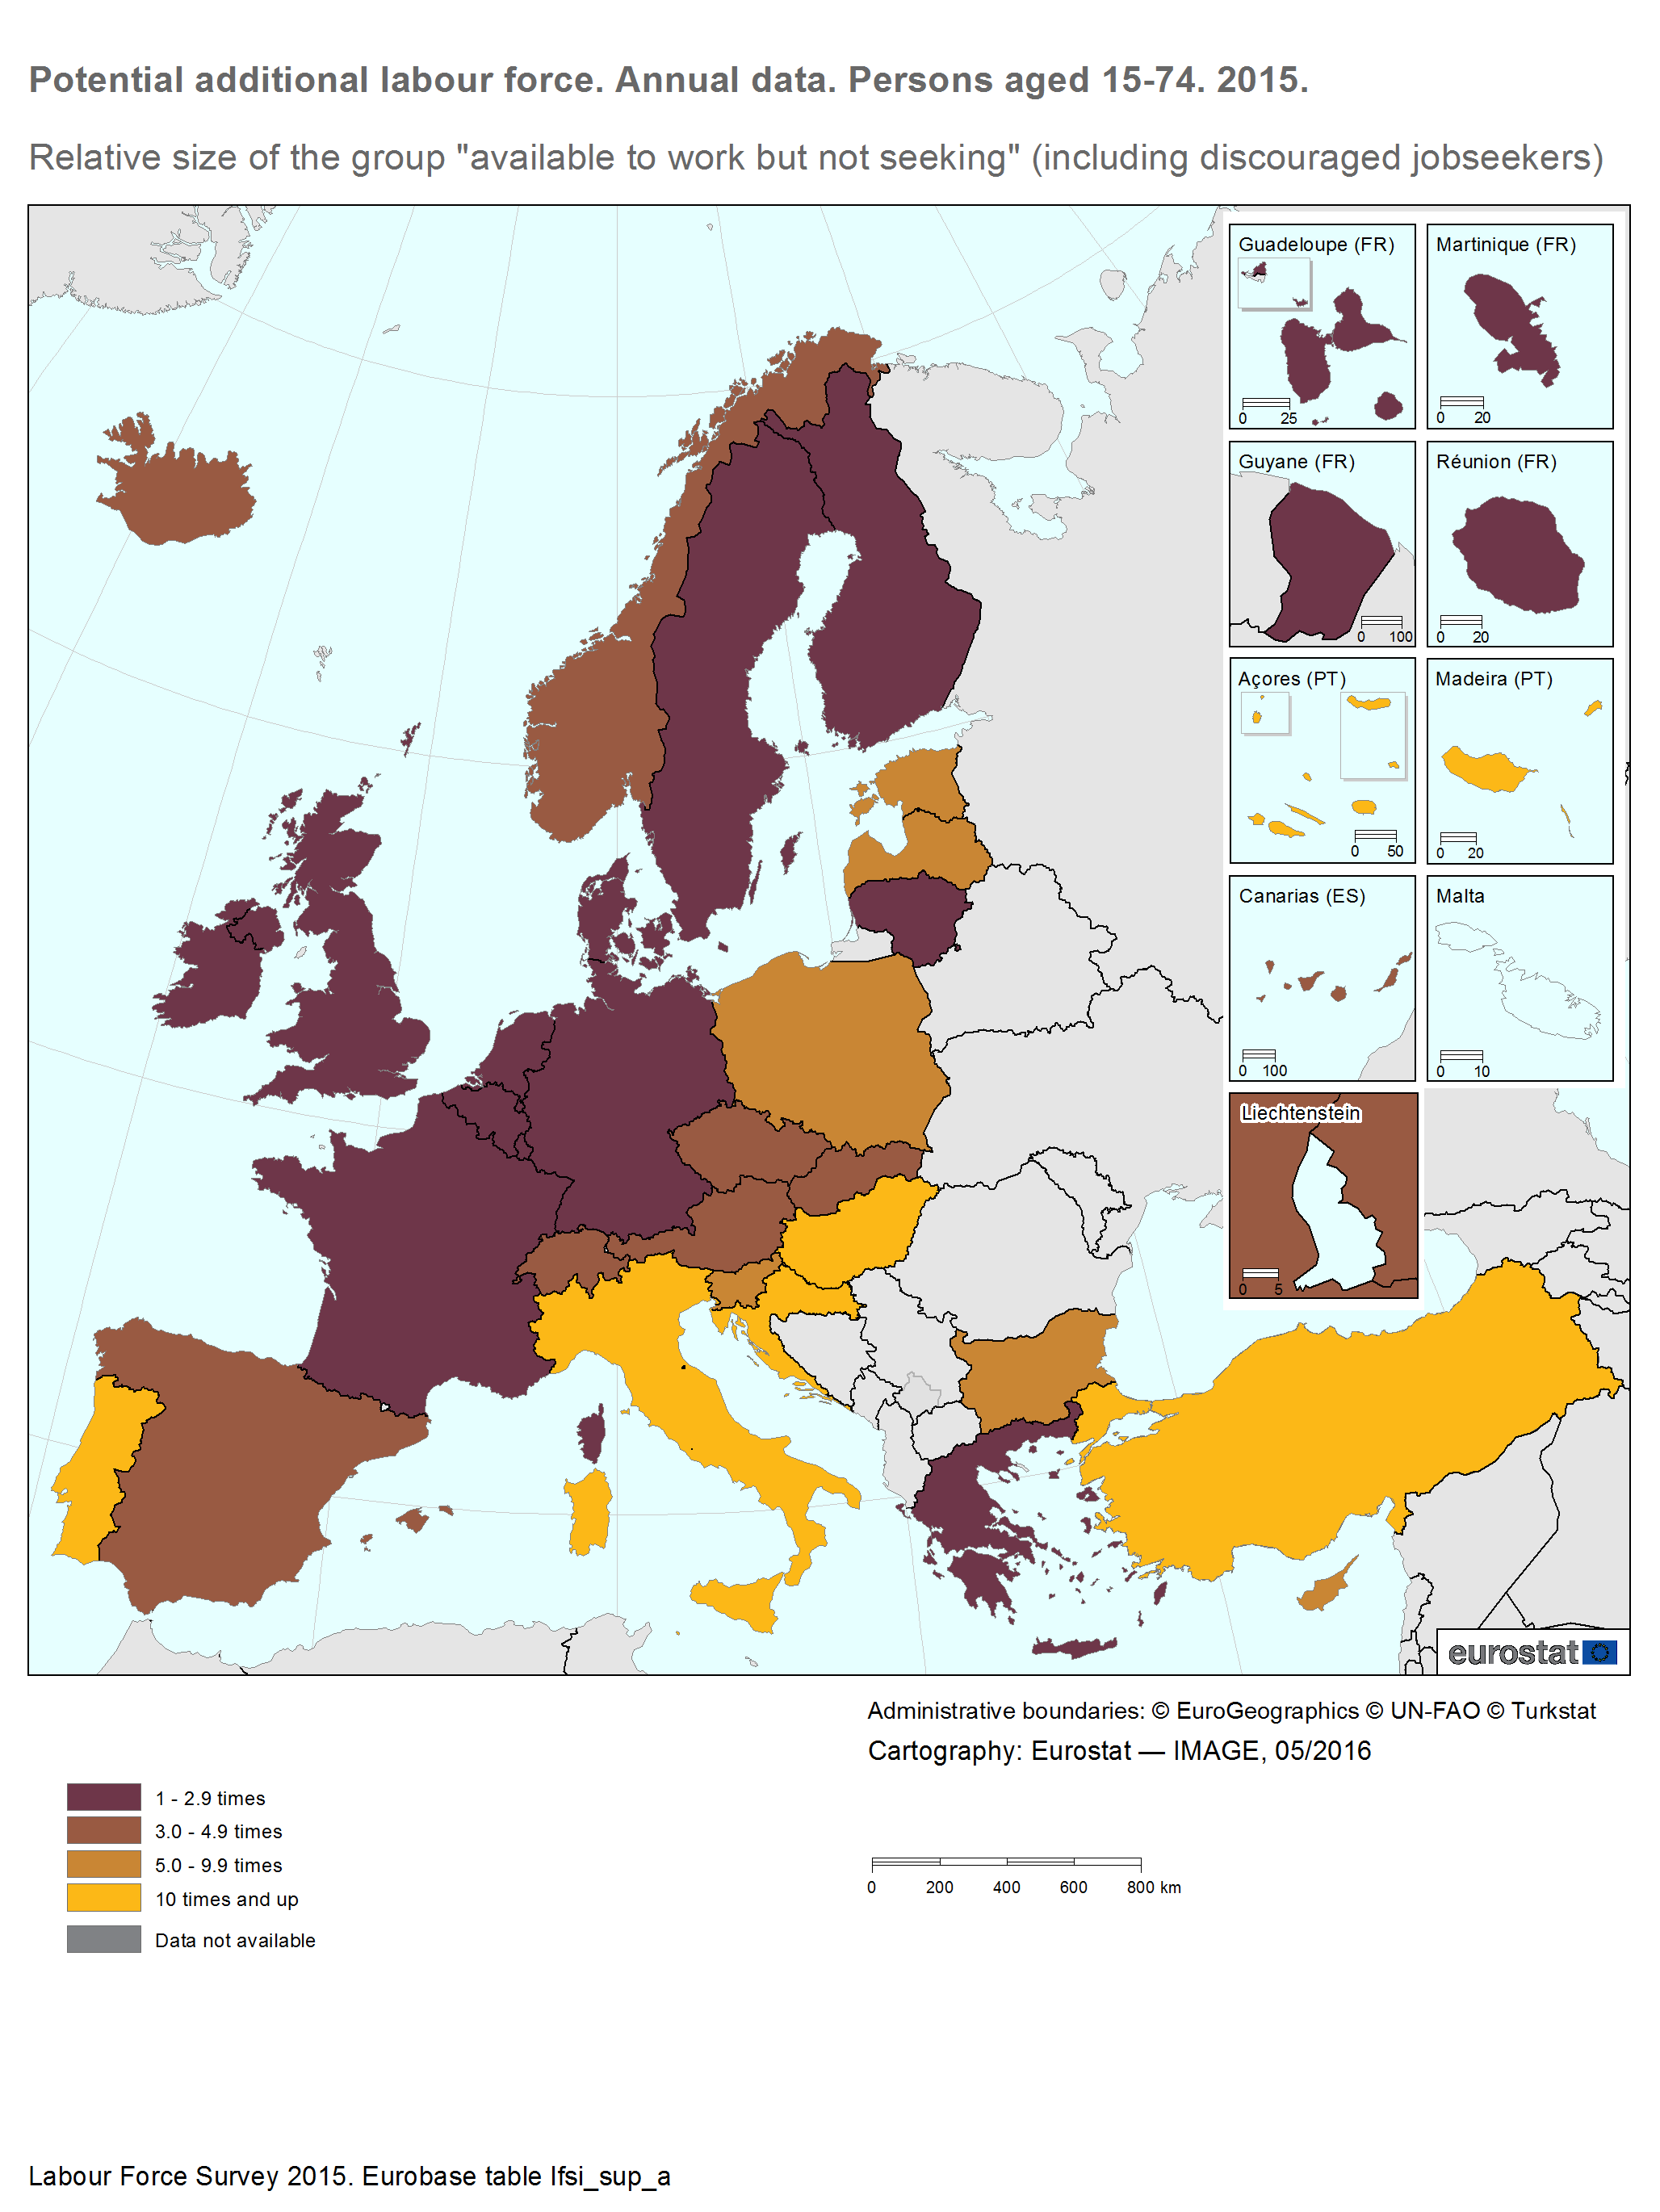
Potential additional labour force, relative size of the group available to work but not seeking. Persons aged 15-74. Annual average. 2015.png
(
file
)
192 KB
1
14:12, 22 June 2016
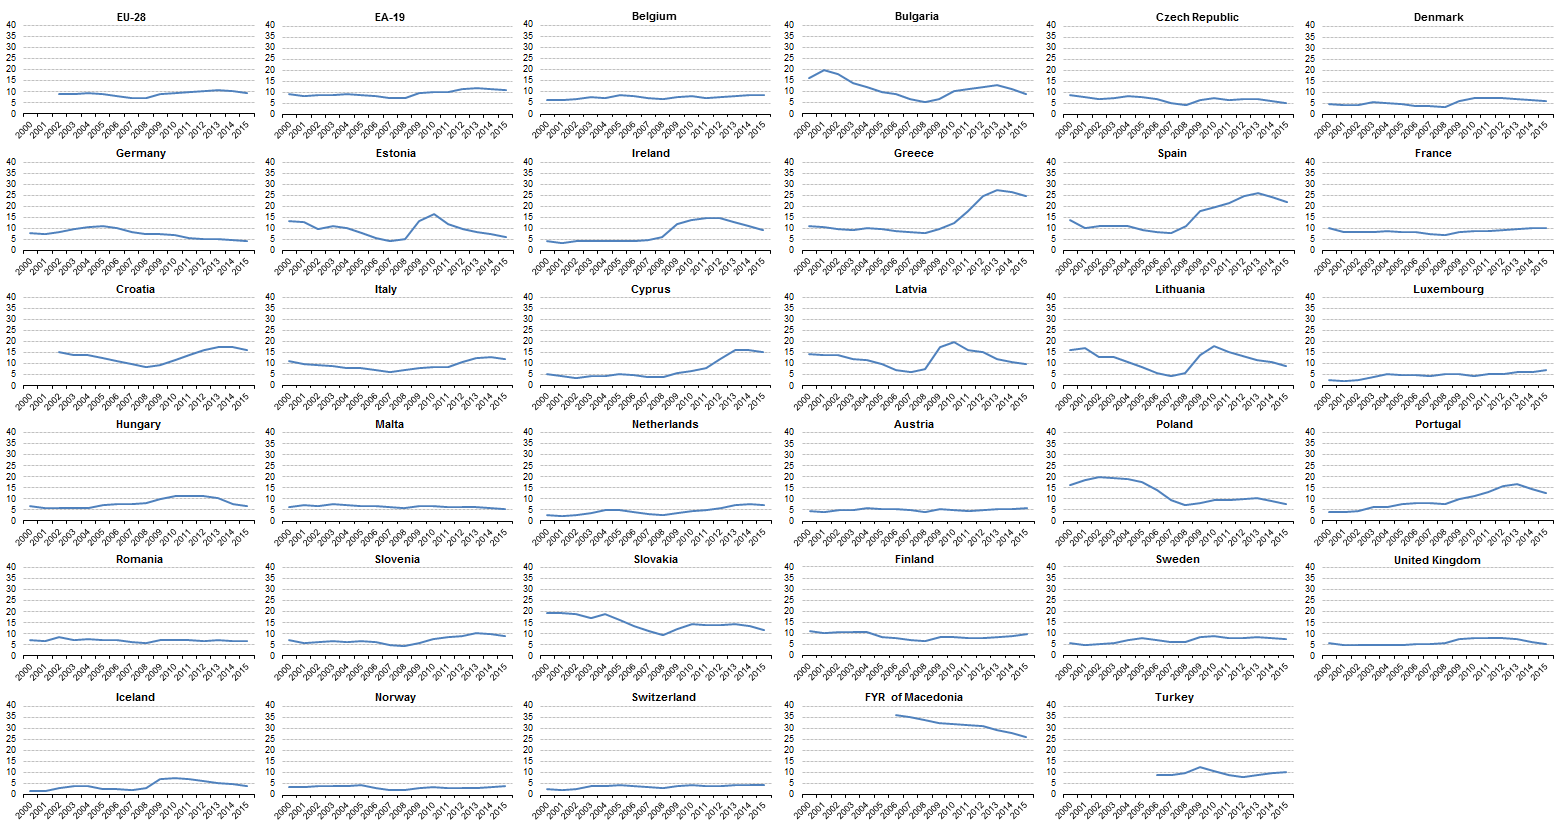
Unemployment rate, persons aged 15-74, 2000-2015, annual data, per cent.png
(
file
)
102 KB
1
14:45, 25 August 2016
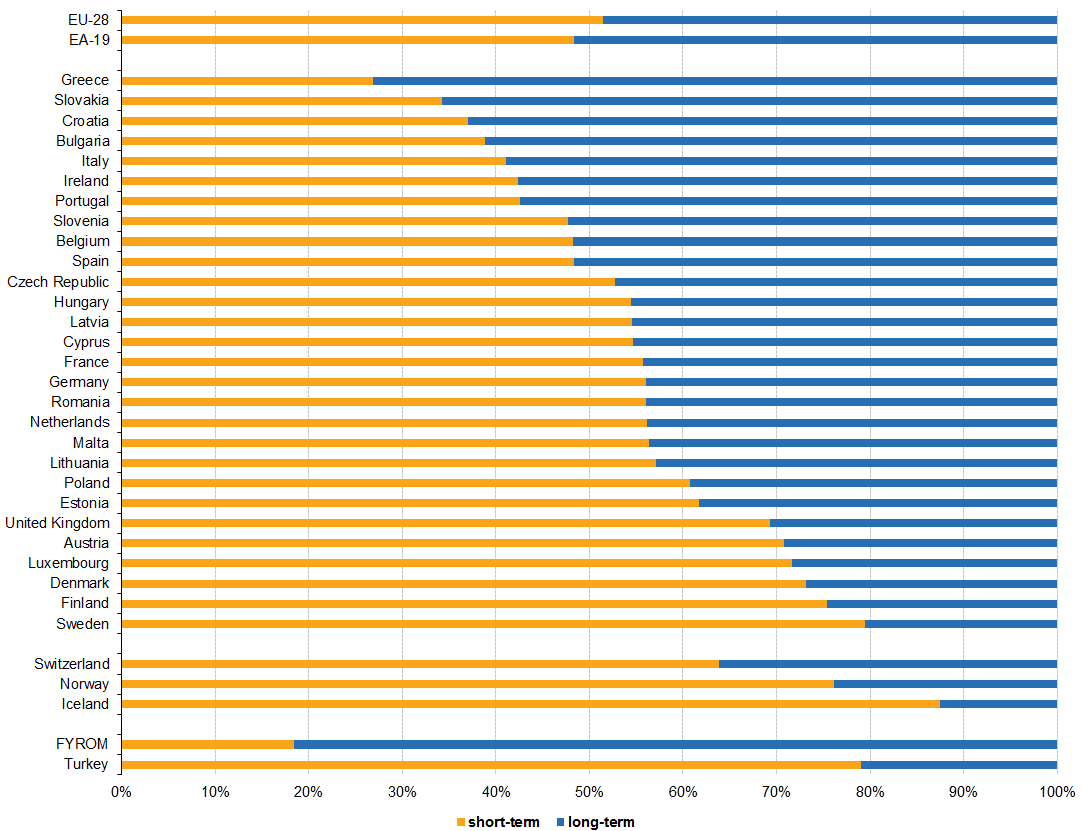
Long-term unemployment (12 months or more) as a percentage of the total unemployment, persons aged 15-74, 2015, annual data, per cent.png
(
file
)
22 KB
1
14:49, 25 August 2016
Long-term unemployment (12 months or more) as a percentage of the total unemployment, persons aged 15-74, by five year age groups, 2015, annual data, per cent.png
(
file
)
59 KB
1
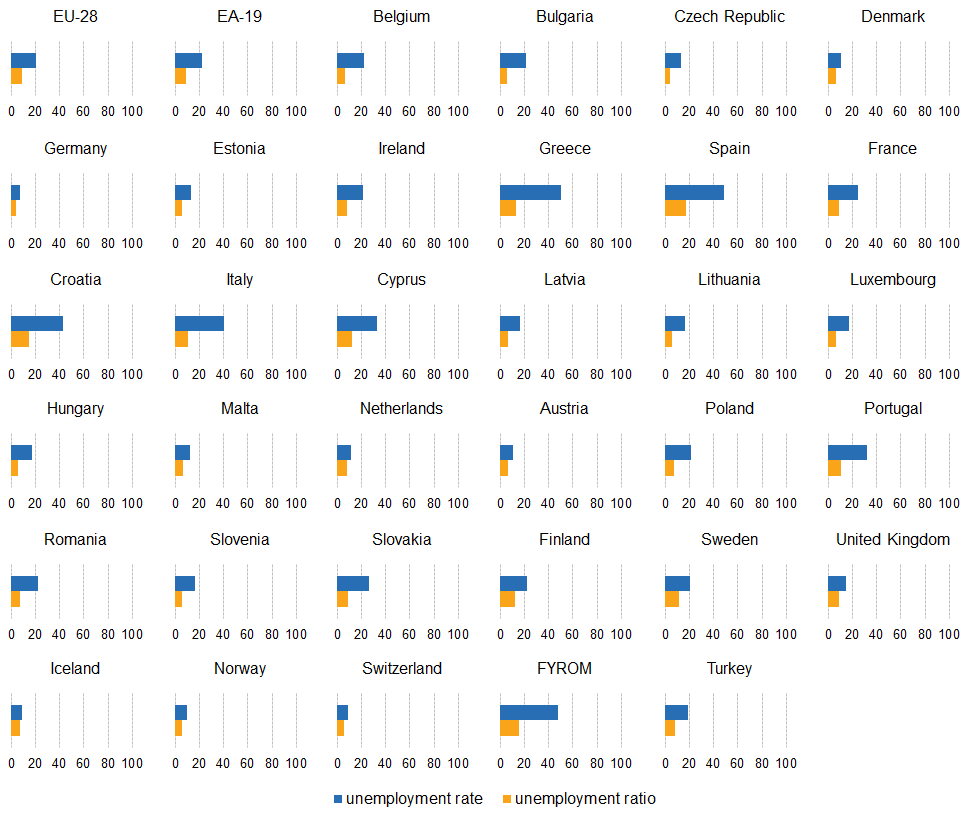
16:32, 25 August 2016
Unemployment rate and unemployment ratio, persons aged 15-24, 2015, annual data, per cent.png
(
file
)
21 KB
1
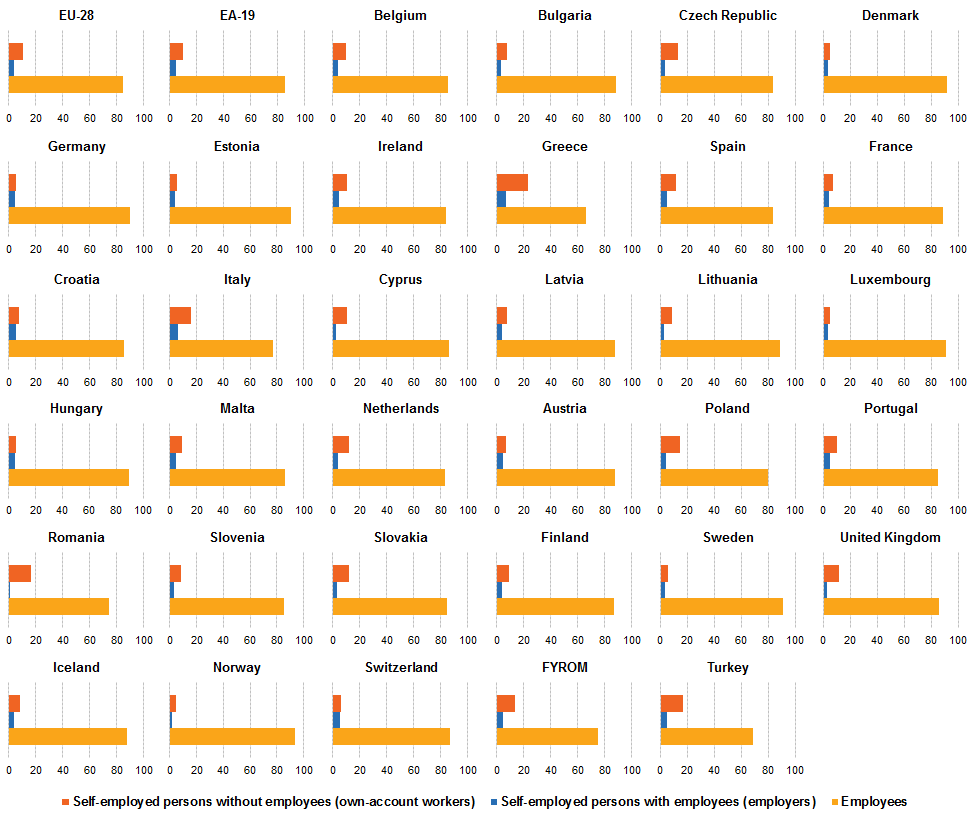
10:54, 26 August 2016
Employment by professional status, persons in employment aged 20-64, 2015, annual data, per cent.png
(
file
)
21 KB
1
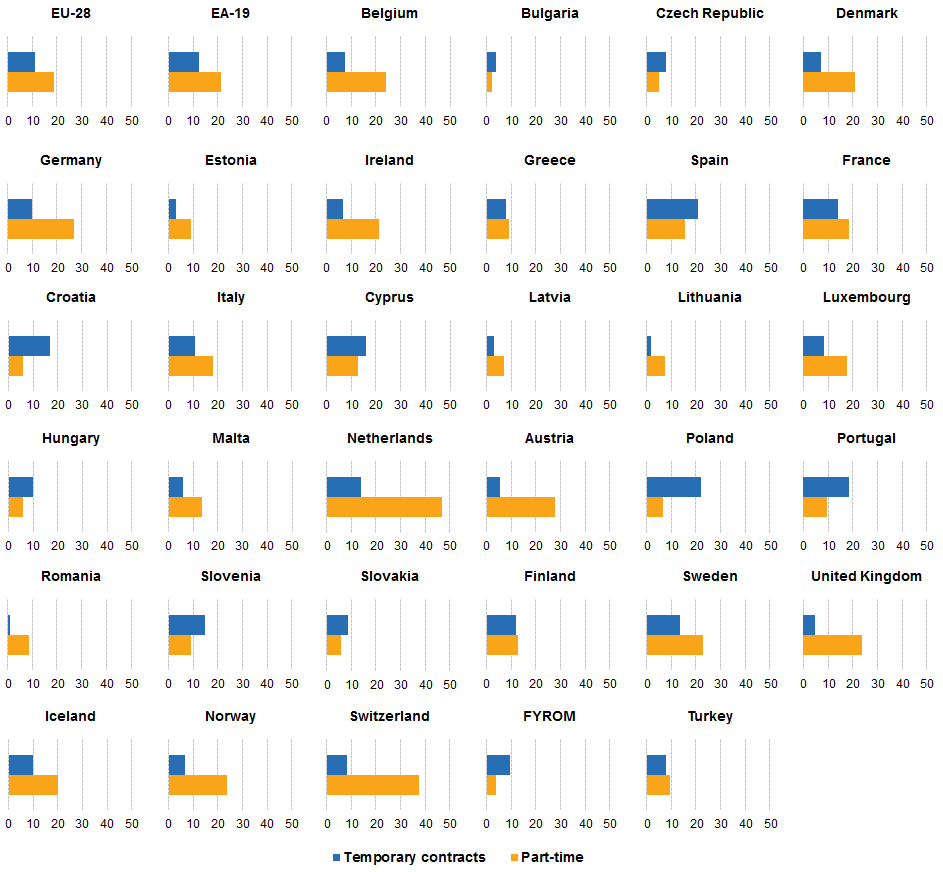
11:09, 26 August 2016
Part-time employment and temporary contracts, persons in employment aged 20-64, 2015, annual data, per cent.png
(
file
)
23 KB
1
11:20, 26 August 2016
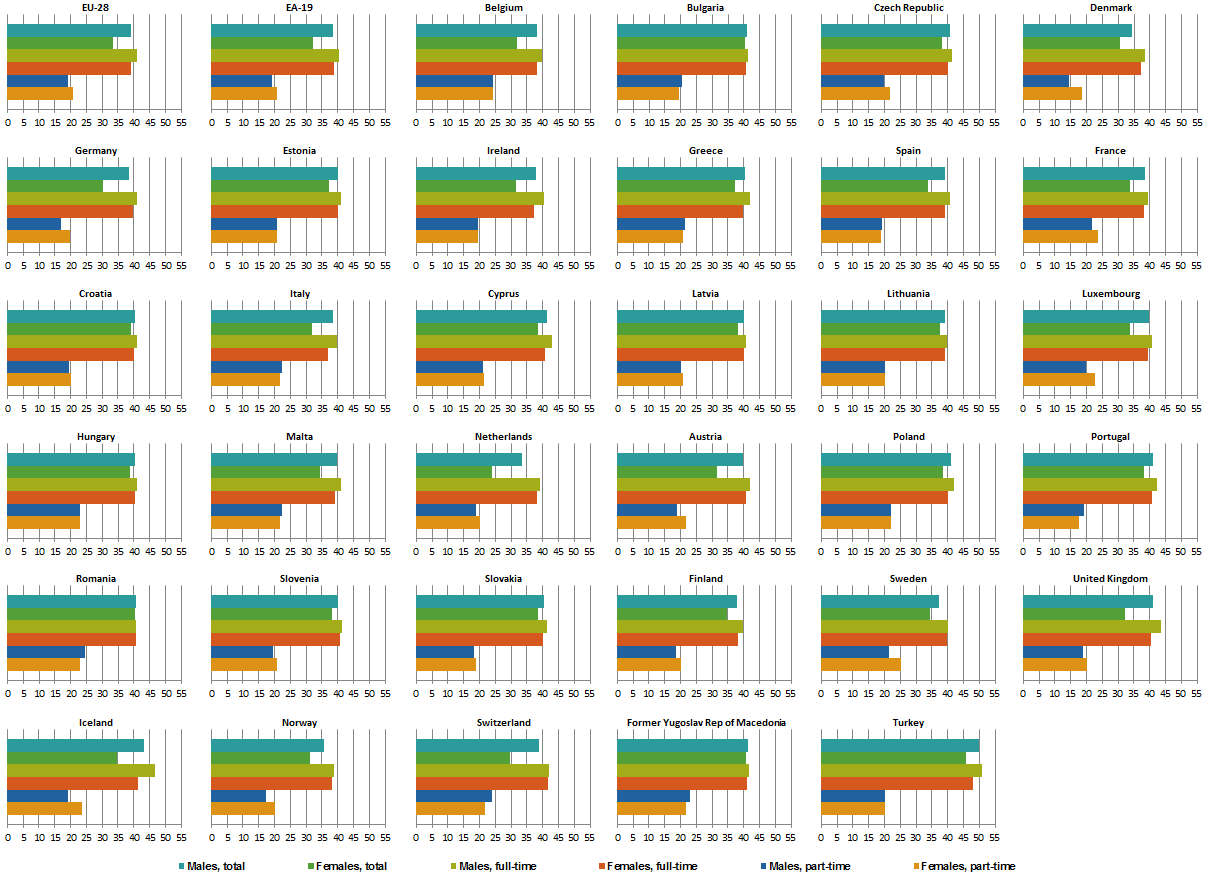
Usual weekly hours in the main job, employees aged 15-74, by sex and working time, 2015, annual data, average number of hours.png
(
file
)
25 KB
1
11:27, 26 August 2016
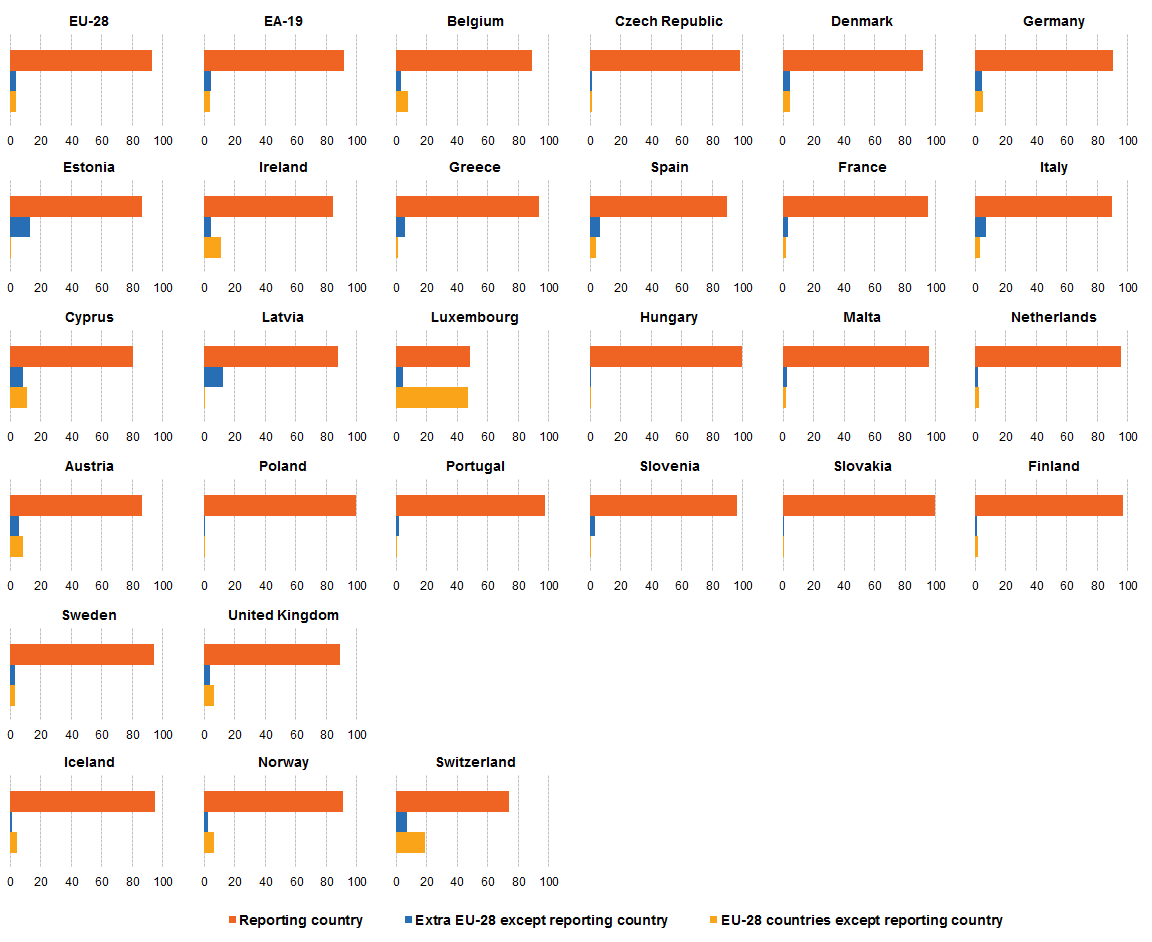
Employment by citizenship, persons aged 20-64, 2015, annual data, per cent.png
(
file
)
25 KB
1
11:39, 26 August 2016
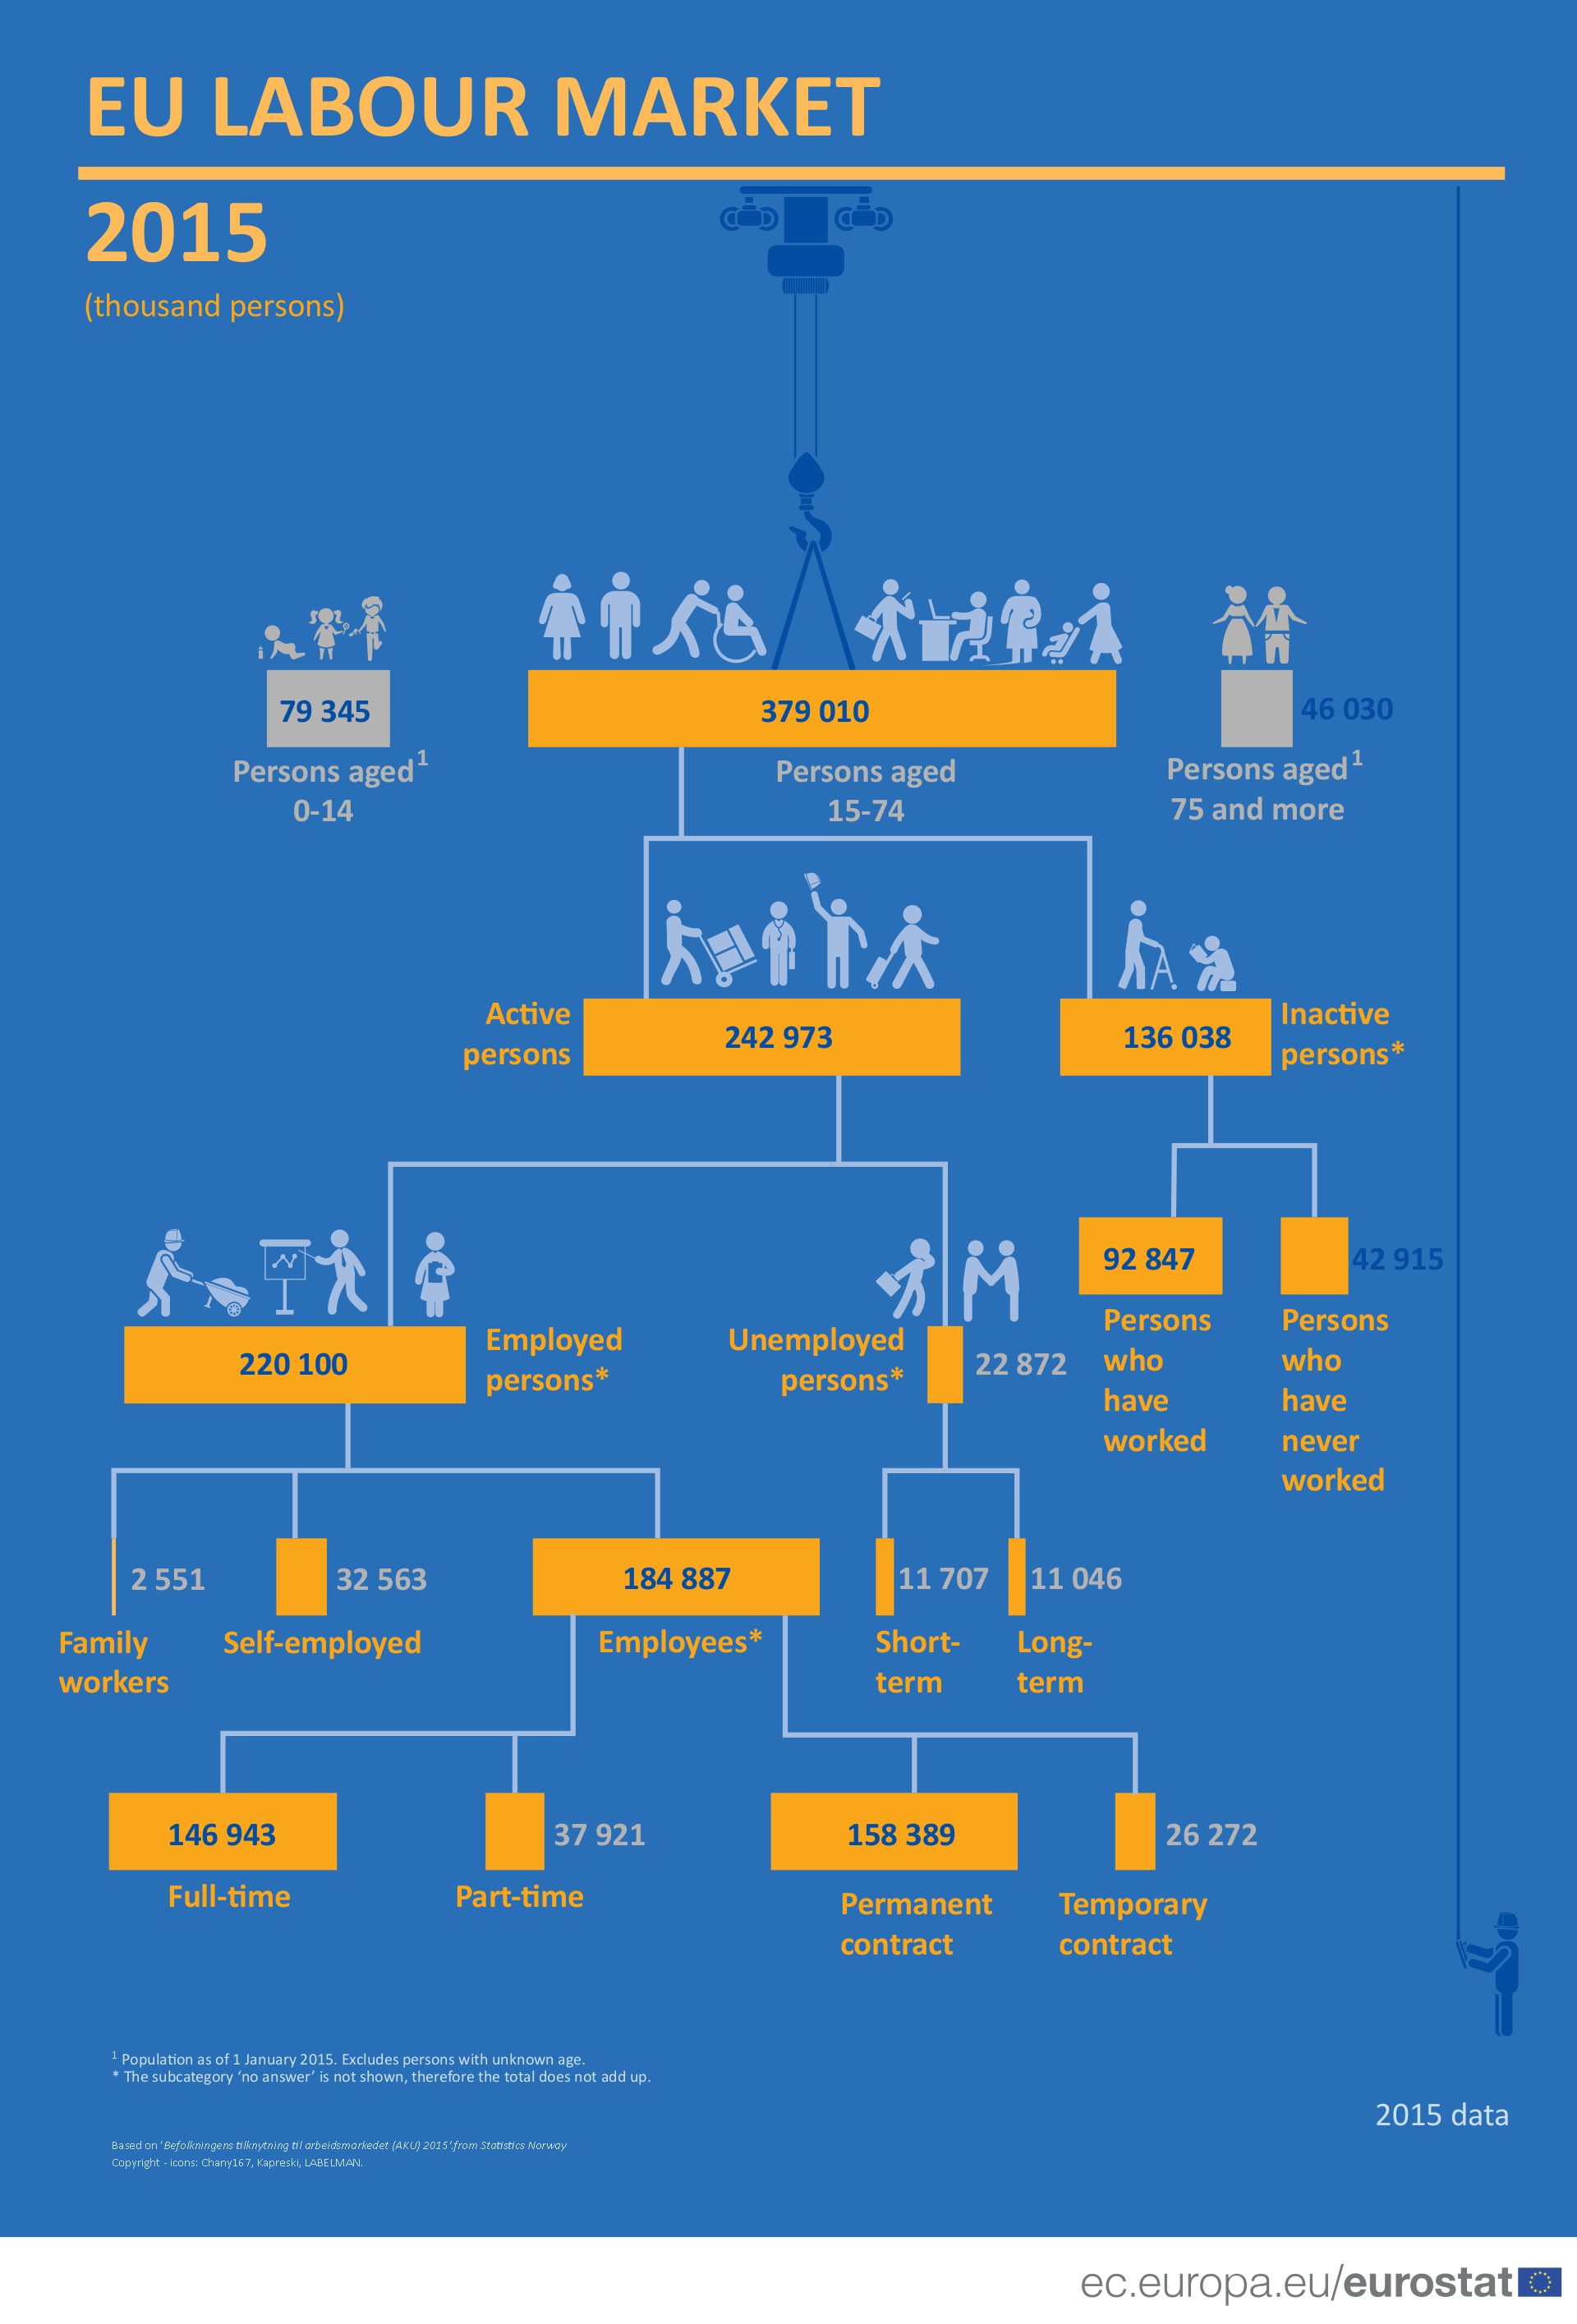
EU Labour Force Survey population sub-groups, EU-28, 2015, annual data, thousands of persons.png
(
file
)
308 KB
1
12:12, 29 August 2016
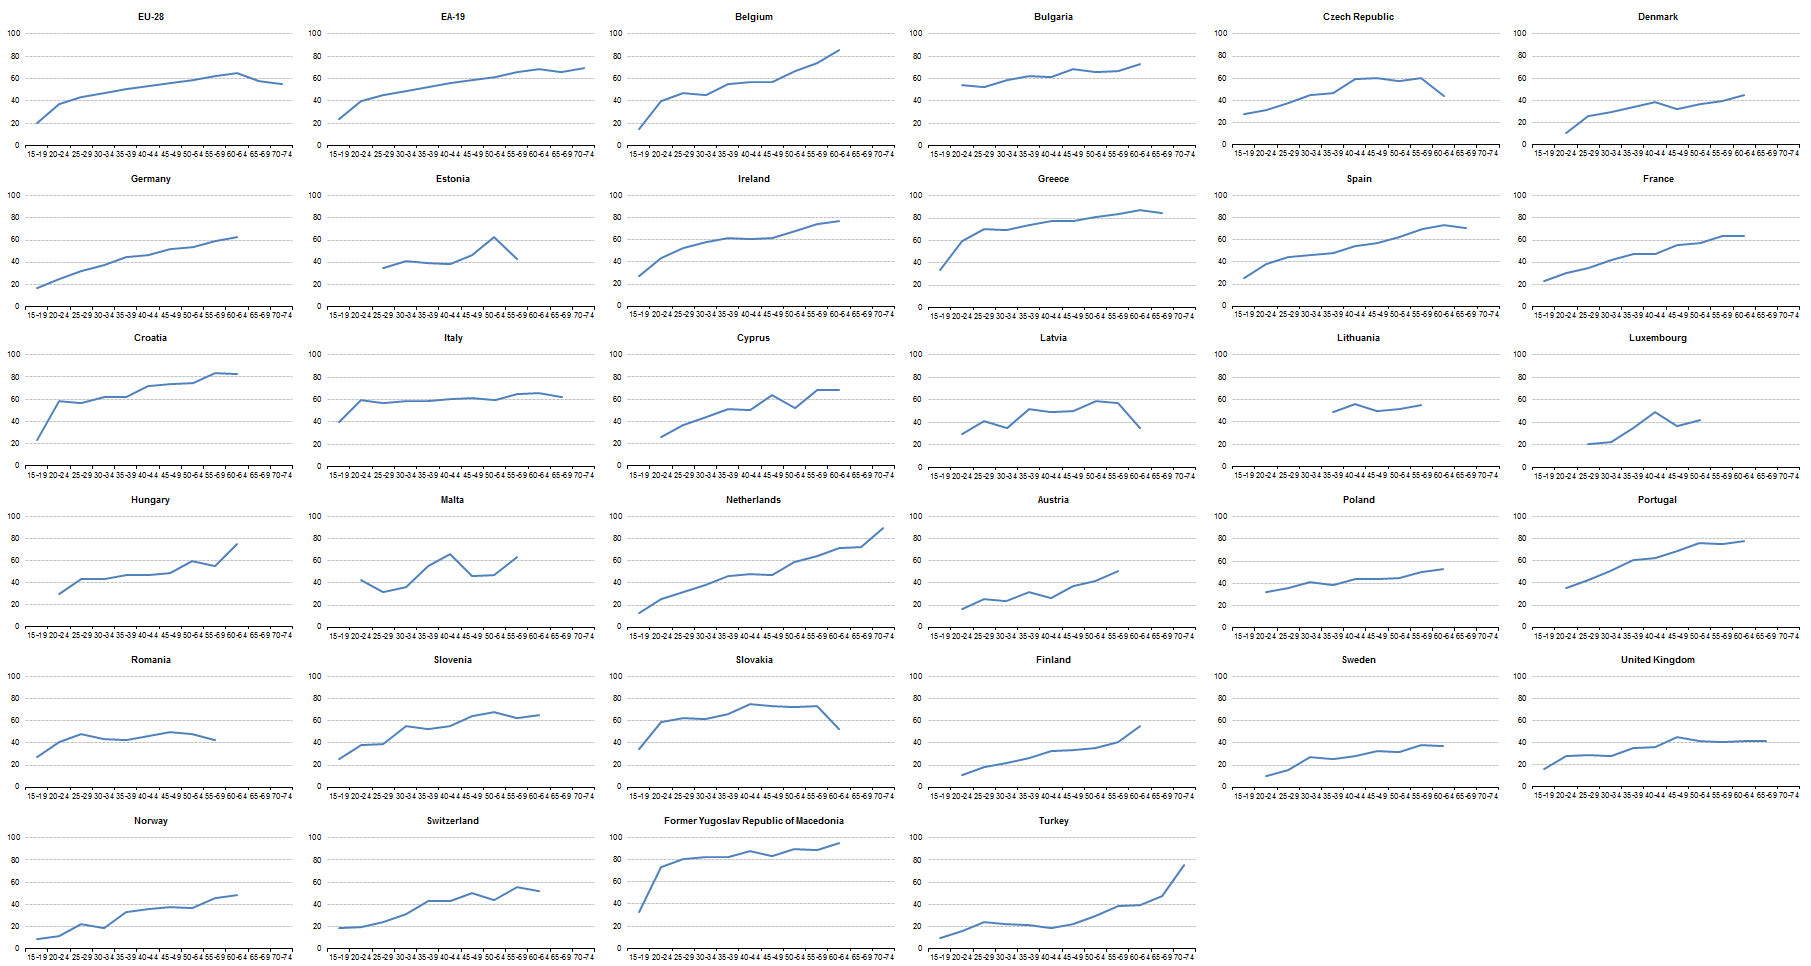
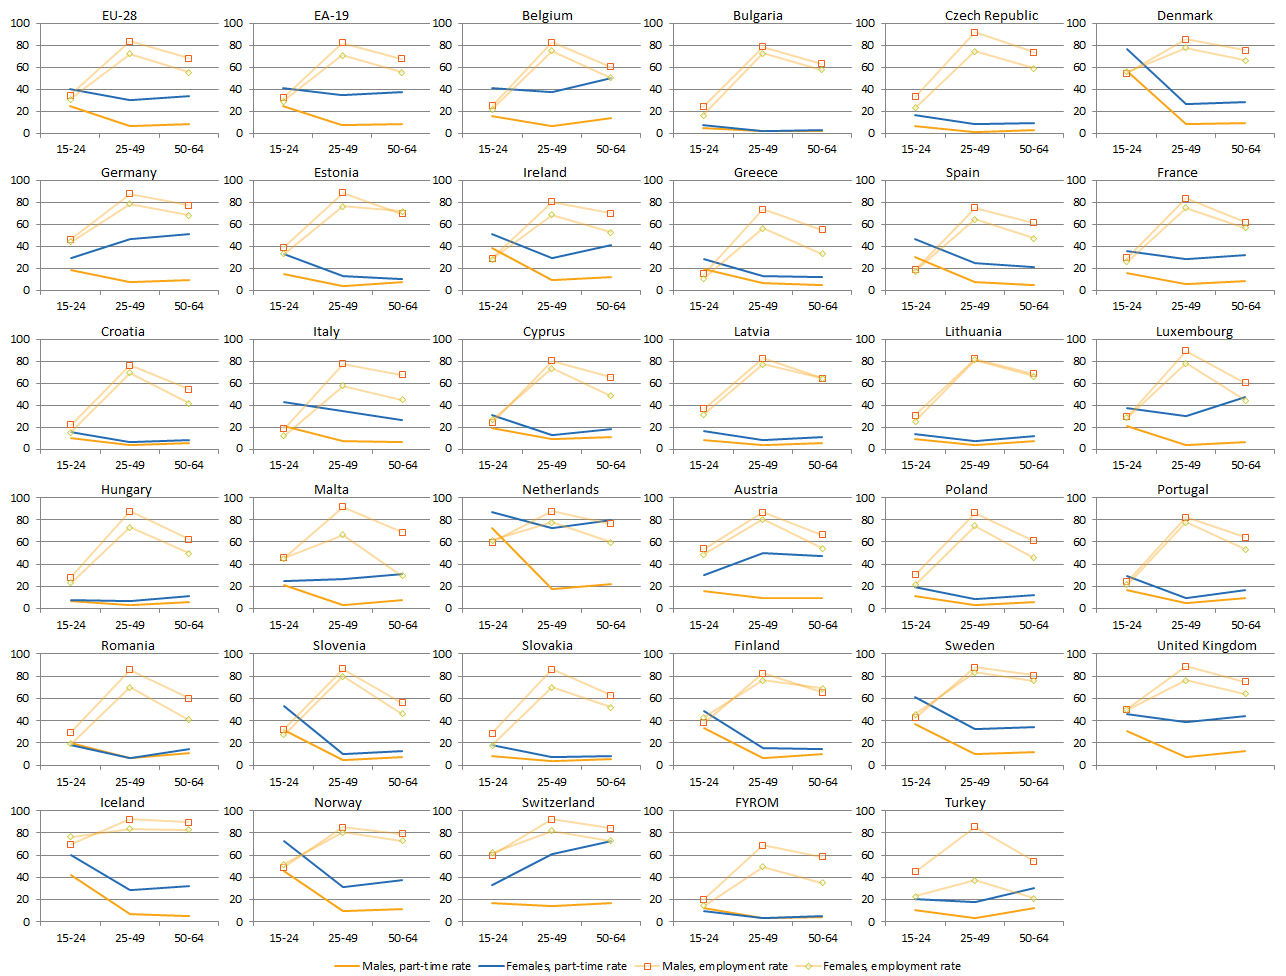
Part-time employment as a proportion of total employment, and employment rate, by age and sex, persons 15-64, 2015, annual data, per cent.png
(
file
)
103 KB
1
15:12, 29 August 2016
Temporary contracts as a proportion of total employment, by age and sex, persons 15-64, 2015, annual data, per cent.png
(
file
)
65 KB
1
13:06, 6 September 2016
Unemployment rate, persons aged 15-74, 2015, annual data, per cent.png
(
file
)
Error creating thumbnail: File with dimensions greater than 30 MP
1.12 MB
3
14:48, 8 September 2016
Unemployment rate , persons aged 15-74, 2015, annual data, per cent.png
(
file
)
Error creating thumbnail: File with dimensions greater than 30 MP
1.12 MB
1
14:51, 8 September 2016
Unemployment map 2015.jpg
(
file
)
3.53 MB
1
14:04, 19 April 2017
Figure 1 Employment rate 2001-2016 and required growth 2017-2020, persons aged 20-64, EU-28, per cent.png
(
file
)
25 KB
1
14:14, 19 April 2017
Figure 2 Year-on-year percentage point change in employment rate, 2002-2016, persons aged 20-64, EU-28, percentage points.png
(
file
)
16 KB
1
14:16, 19 April 2017
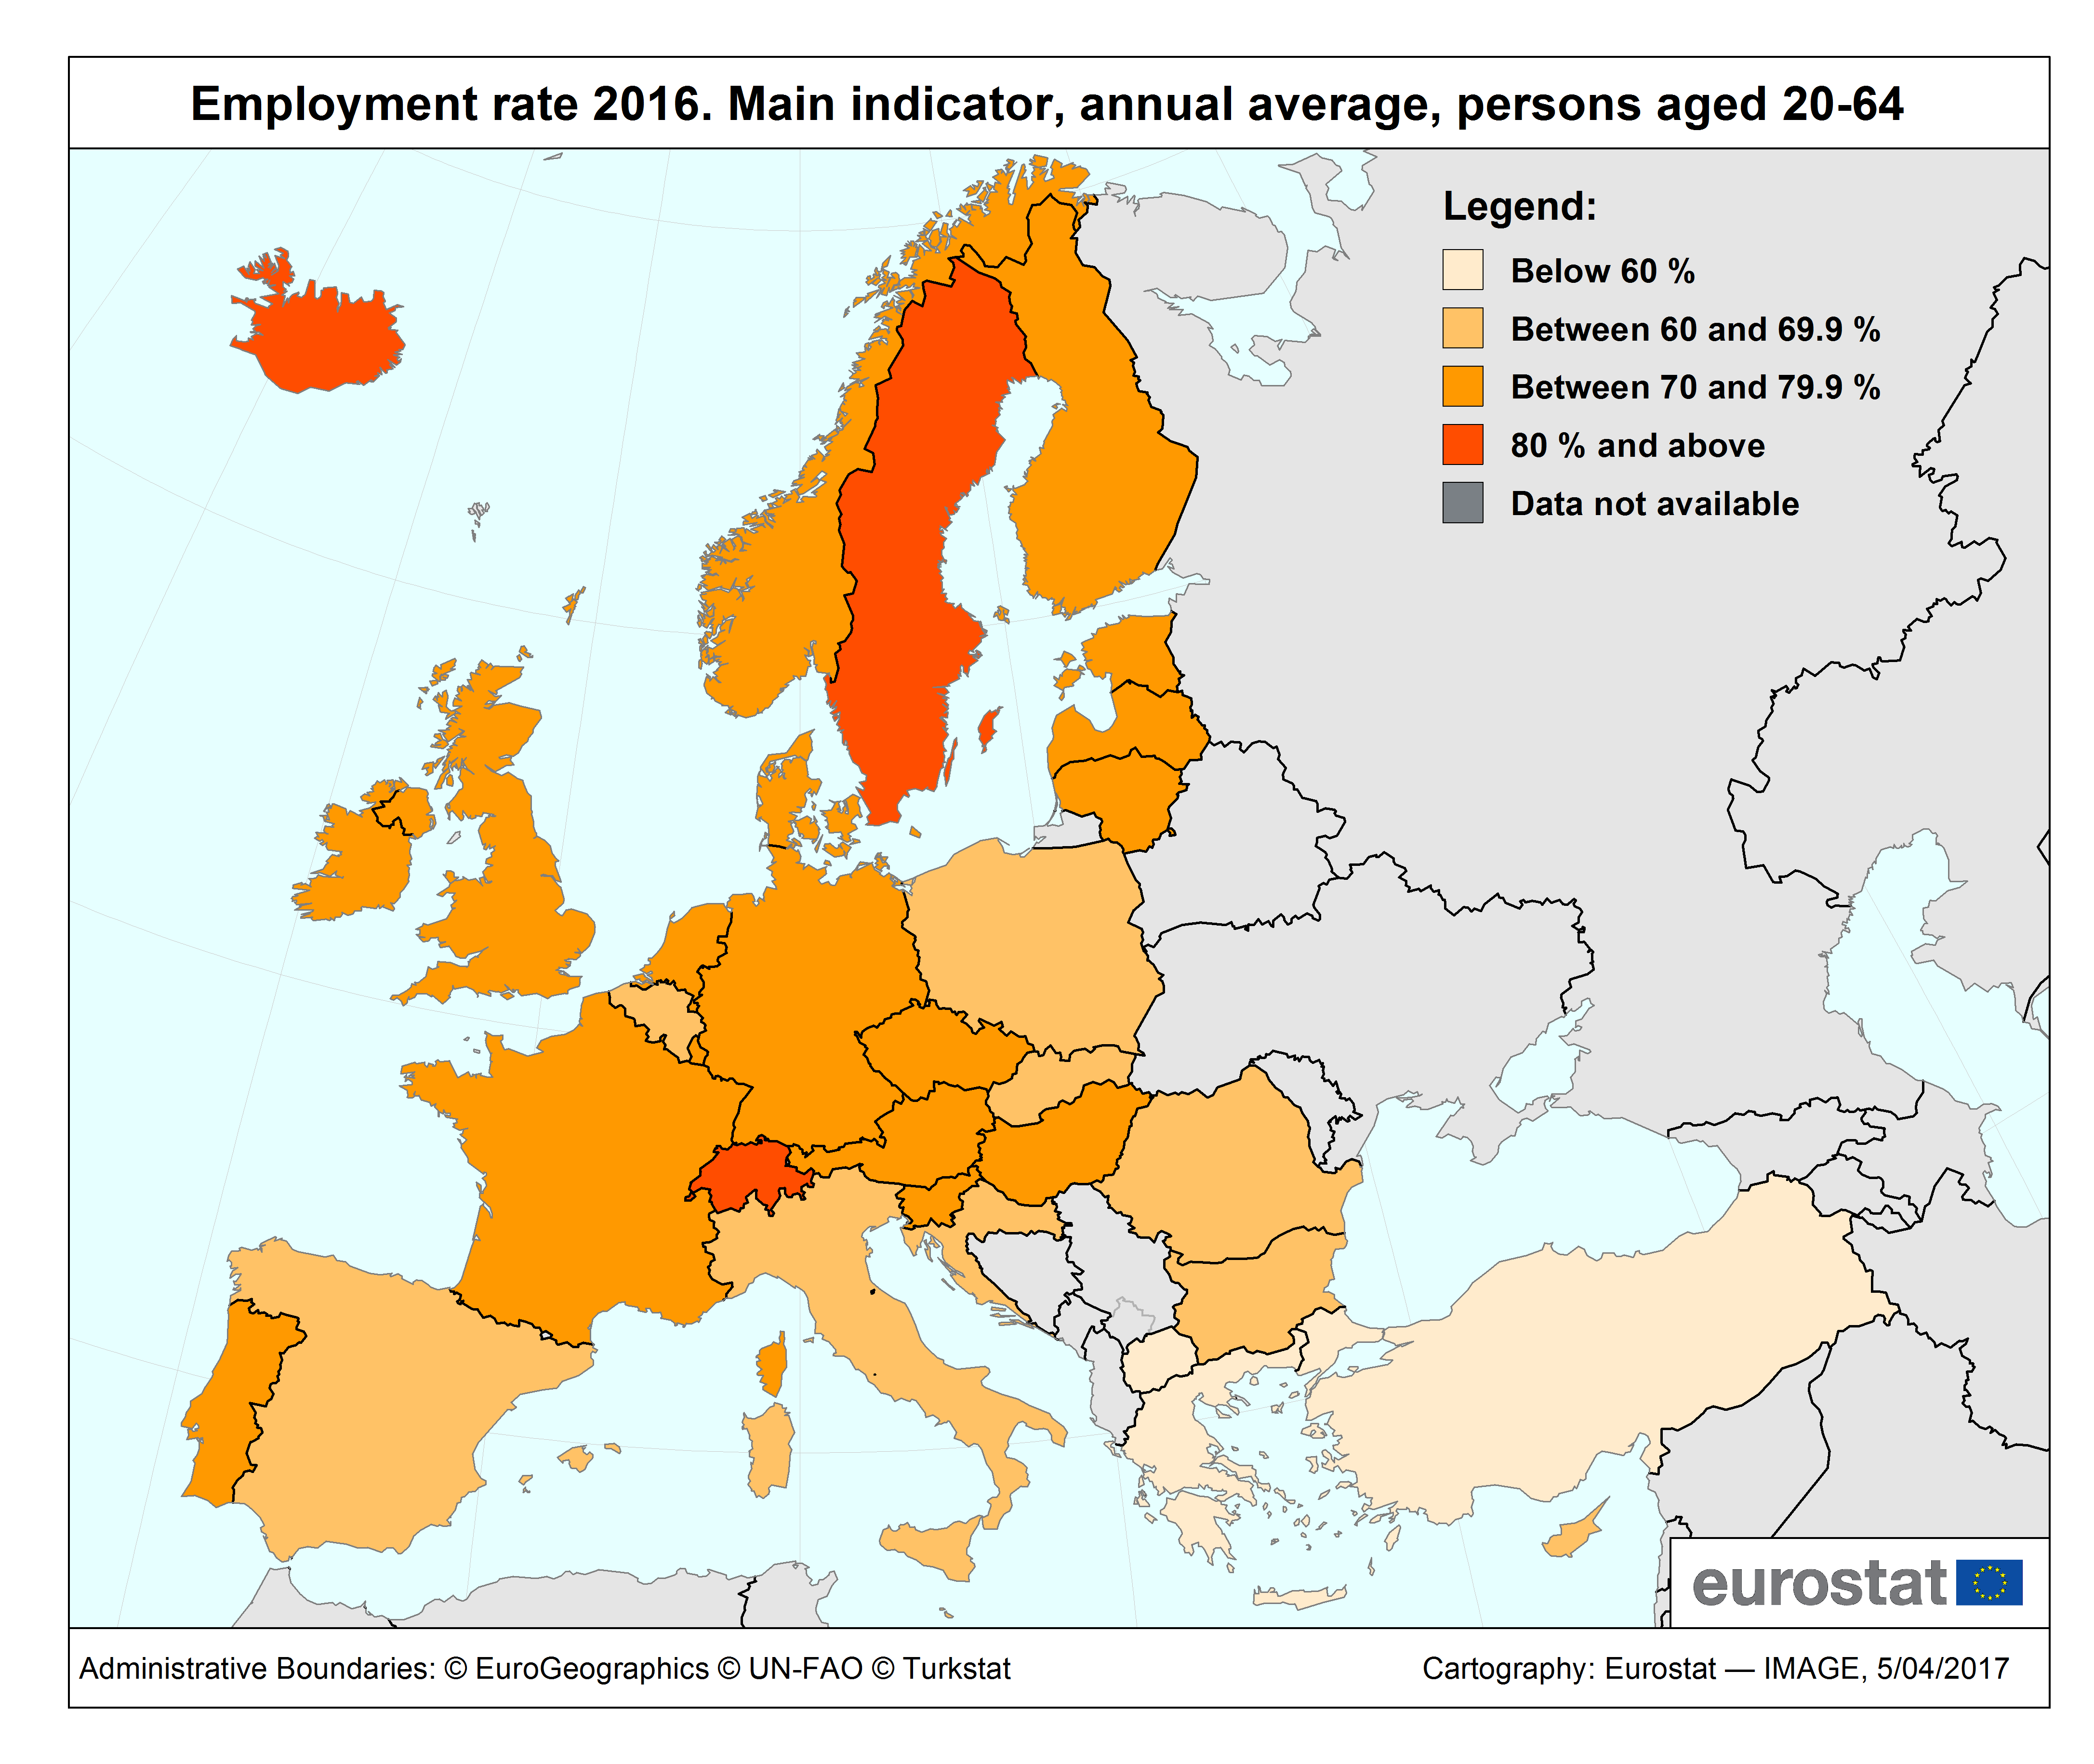
Employment rates, 2016, persons aged 20-64, country level, EU Member States, EFTA countries and candidate countries, %.png
(
file
)
364 KB
1
14:19, 19 April 2017
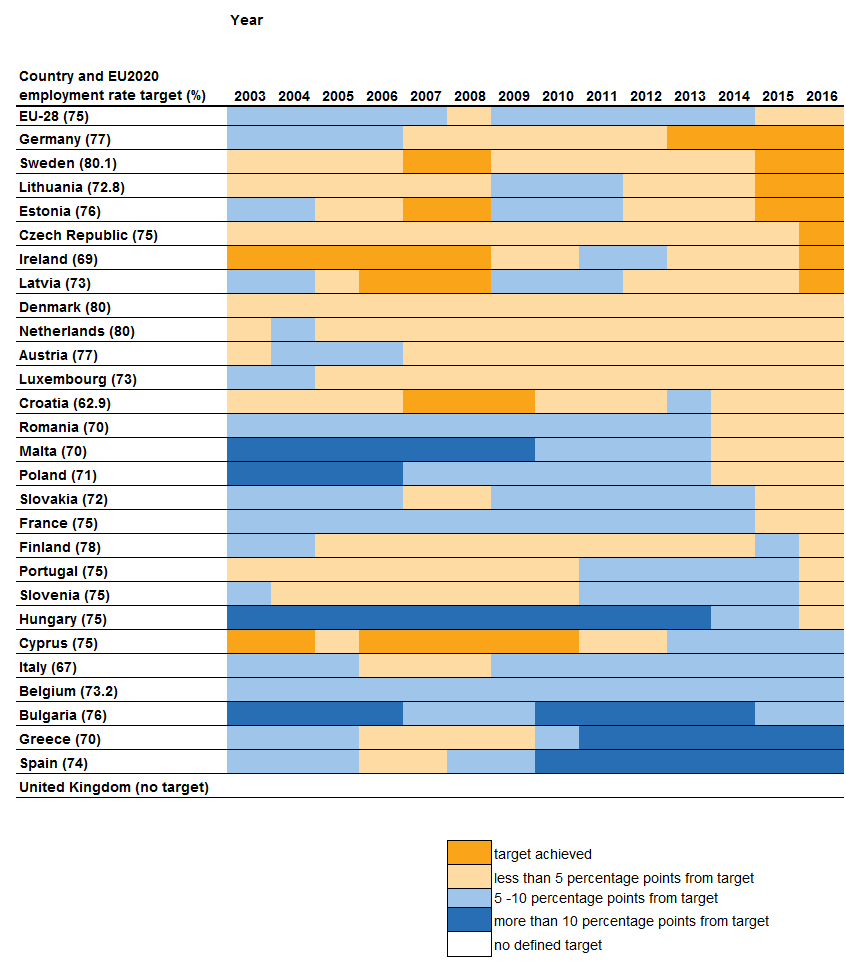
Figure 3 Heat map of annual average employment rates, national EU2020 employment rate targets and goal attainment level, 2003 – 2016, persons aged 20-64, all Member States, per cent.png
(
file
)
24 KB
1
14:24, 19 April 2017
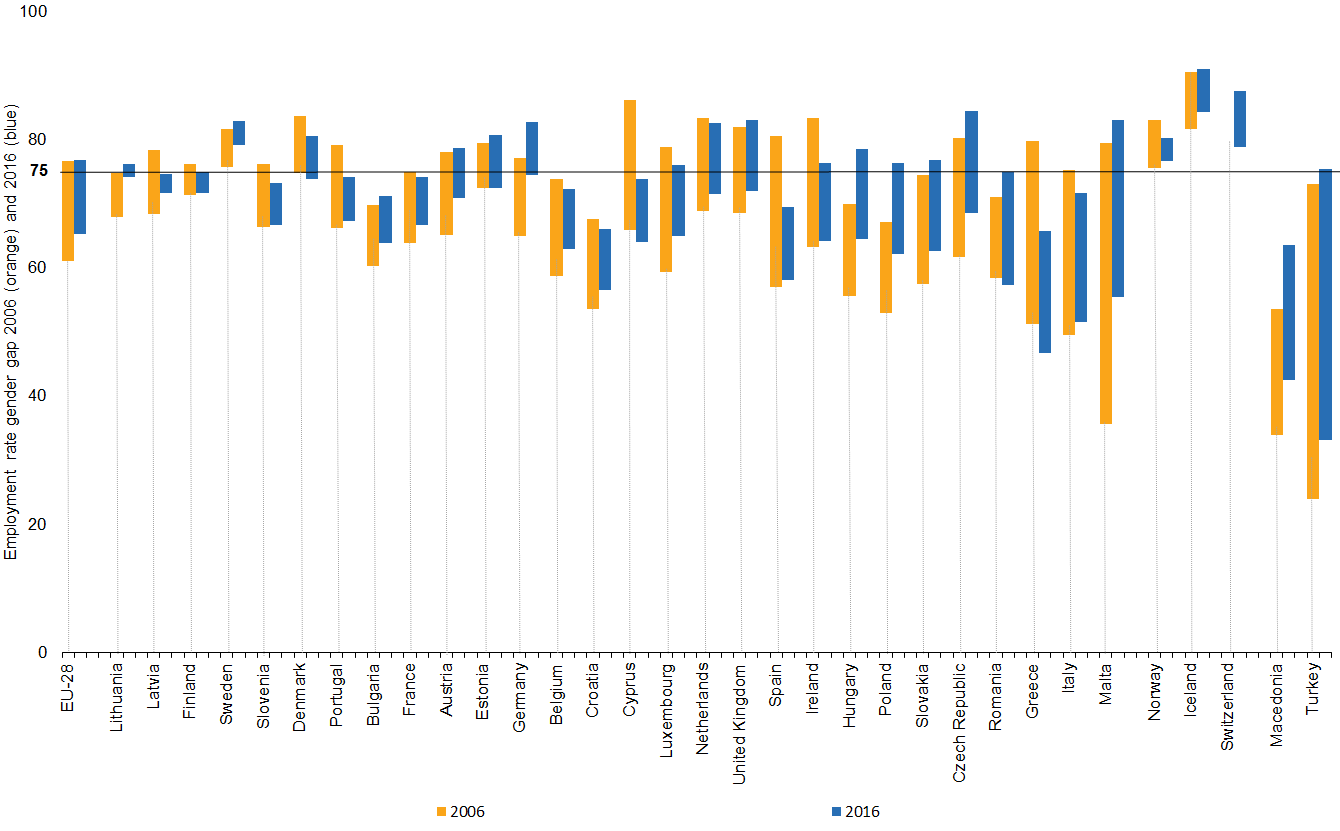
Figure 4 Gender employment gap, 2006 and 2016, persons aged 20-64, all countries, per cent .png
(
file
)
34 KB
1
14:27, 19 April 2017
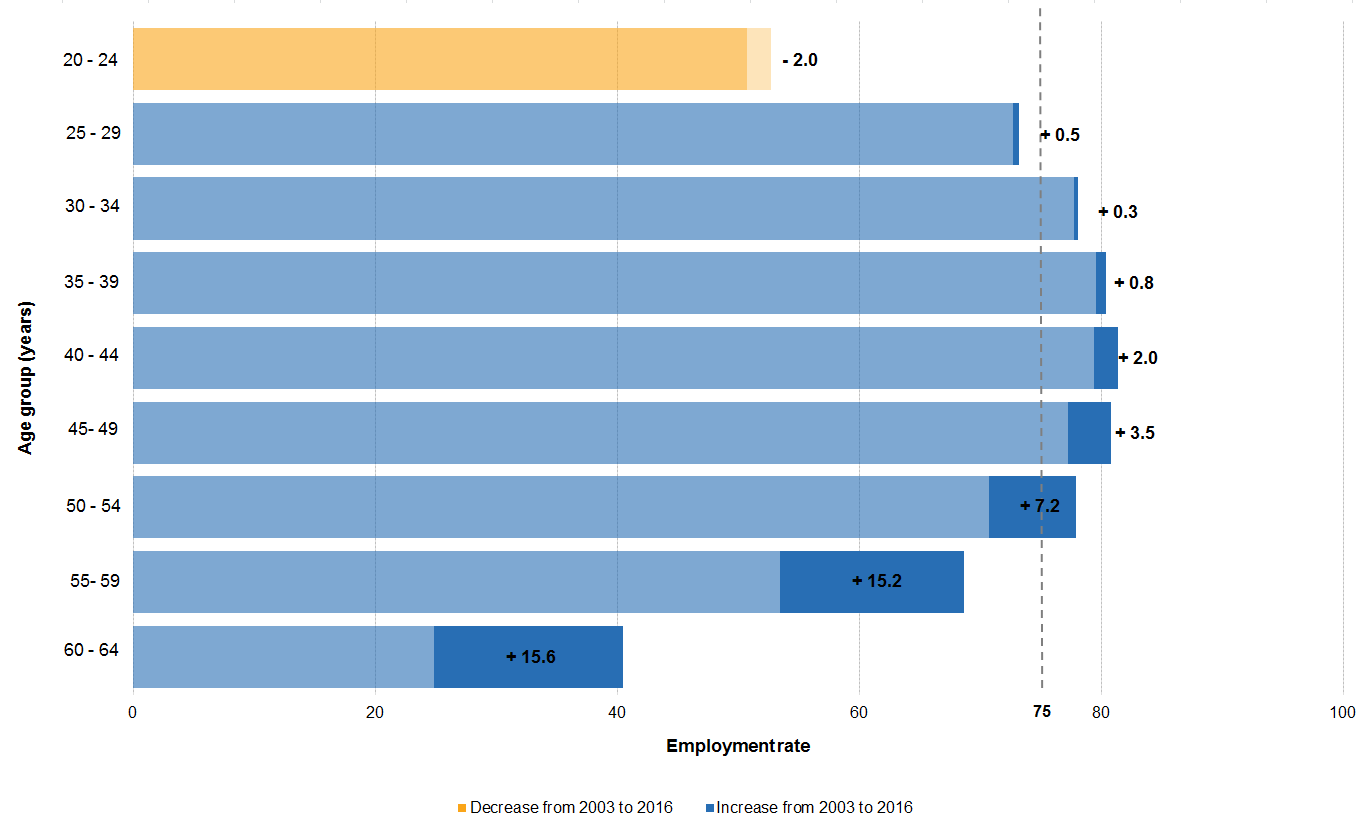
Figure 5 Annual average employment rates, by five-year age groups, 2003 and 2016 , per cent.png
(
file
)
21 KB
1
14:31, 19 April 2017
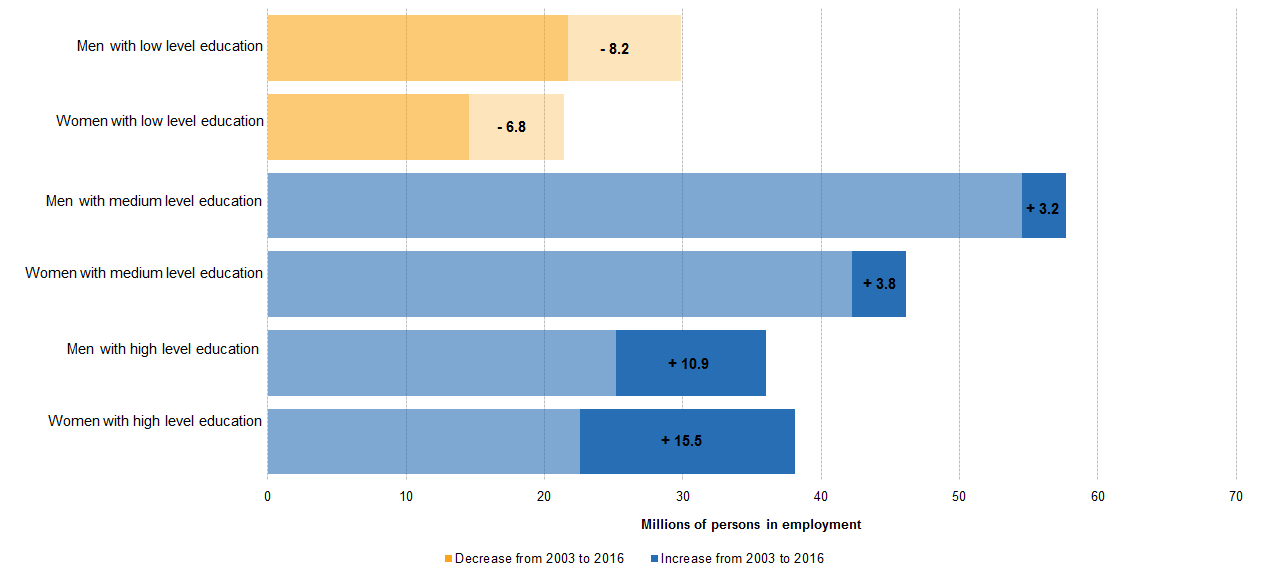
Figure 6 Persons in employment, persons aged 20-64 by sex and education, 2003 and 2016, absolute numbers.png
(
file
)
17 KB
1
14:44, 15 May 2017
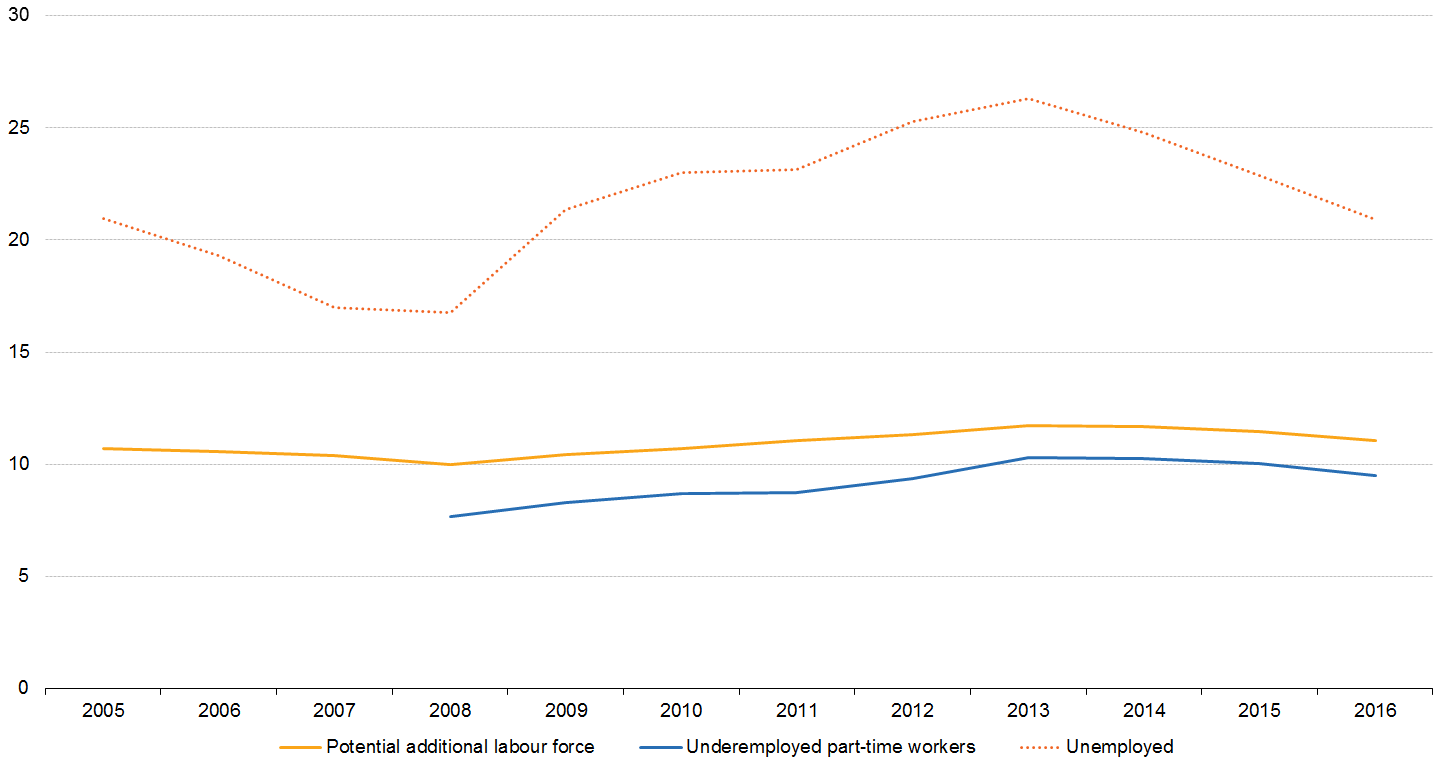
Potential additional labour force, underemployment and unemployment, persons aged 15-74, EU-28, annual averages, 2005 - 2016 (million persons).png
(
file
)
21 KB
1
14:47, 15 May 2017
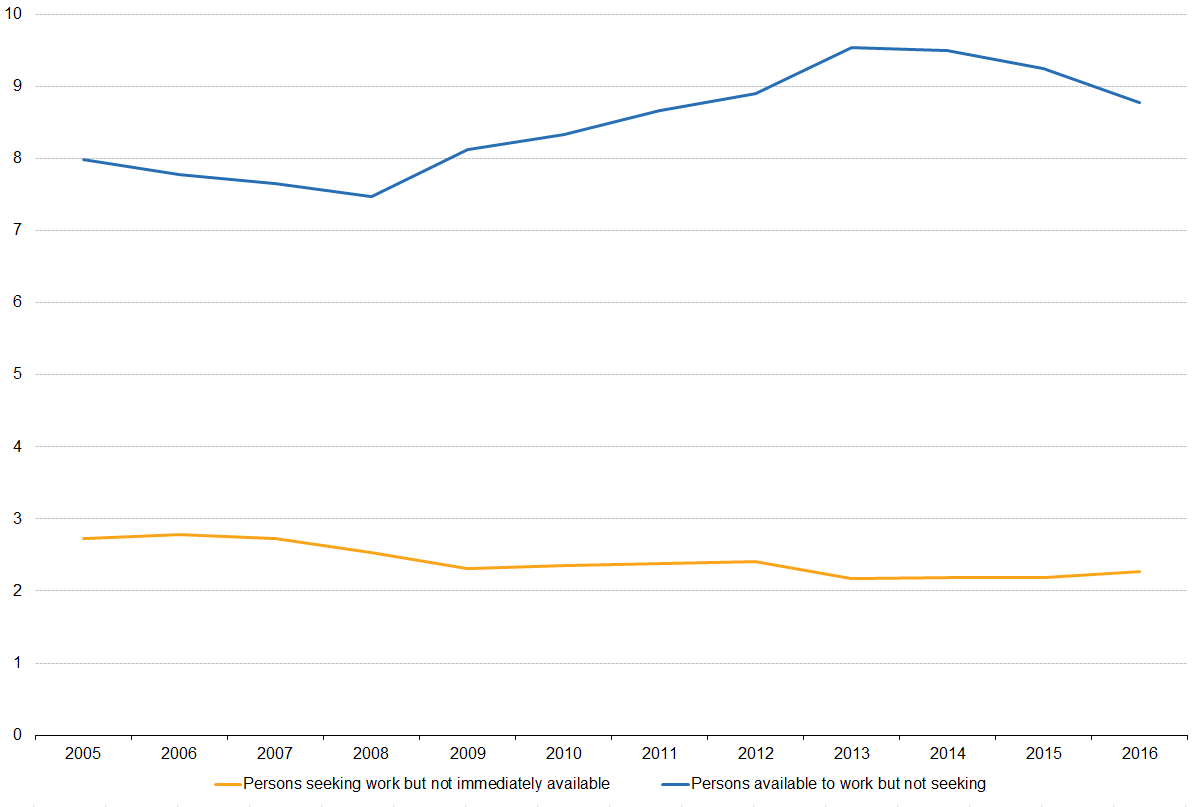
Potential additional labour force, split on its subgroups, persons aged 15-74, EU-28, annual averages, 2005 - 2016 (million persons).png
(
file
)
13 KB
1
First page
Previous page
Next page
Last page
Special page
ISSN 2443-8219


.png)
.png)
.png)
.png)

.png)
.png)
.png)
.png)


_as_a_percentage_of_the_total_unemployment,_persons_aged_15-74,_2015,_annual_data,_per_cent.png)
_as_a_percentage_of_the_total_unemployment,_persons_aged_15-74,_by_five_year_age_groups,_2015,_annual_data,_per_cent.png)


.png)
.png)