Tutorials
Log in
Statistics Explained
menu
search
search
Navigation
Main page
Statistical themes
Glossary
Categories
Statistics 4 beginners
Tutorials
Help
Eurostat home
Education corner
Online publications
Regional yearbook
Sustainable development
Full list
Tools
User contributions
Logs
View user groups
Special pages
search
Navigation
Main page
Statistical themes
Glossary
Categories
Statistics 4 beginners
Tutorials
Help
Eurostat home
Education corner
Online publications
Regional yearbook
Sustainable development
Full list
Tools
User contributions
Logs
View user groups
Special pages
Navigation
Main page
Statistical themes
Glossary
Categories
Statistics 4 beginners
Tutorials
Help
Eurostat home
Education corner
Online publications
Regional yearbook
Sustainable development
Full list
Tools
User contributions
Logs
View user groups
Special pages
Uploads by Krukoma
This special page shows all uploaded files.
File list
Items per page:
20
50
100
250
500
Search for media name:
Username:
Include old versions of files
Go
First page
Previous page
Next page
Last page
Date
Name
Thumbnail
Size
Description
Versions
15:42, 6 March 2013
GDP EU EA 2012Q3.png
(
file
)
6 KB
1
15:53, 6 March 2013
GDP 2012G3 table.png
(
file
)
18 KB
1
11:57, 18 March 2013
EU27, EA17 and United States GDP growth rates 2012Q4.png
(
file
)
20 KB
1
14:43, 18 March 2013
Taux de croissance du PIB de l'UE27, de la zone euro et des Etats-Unis 2012Q4.png
(
file
)
21 KB
1
14:51, 18 March 2013
Taux de croissance du PIB de l'UE27, de la zone euro et des Etats membres au cours du quatrieme trimestre 2012.png
(
file
)
5 KB
1
14:54, 18 March 2013
Wachstumsraten des BIP - EU27, ER17 und Vereinigte Staaten 2012Q4.png
(
file
)
21 KB
1
14:58, 18 March 2013
Wachstumsraten des BIP im vierten Quartal 2012 - EU27, ER17 und Mitgliedstaaten.png
(
file
)
6 KB
1
12:43, 19 March 2013
Evolution du PIB en volume (basee sur des donnees corrigees des variations saisonnieres).png
(
file
)
14 KB
1
12:47, 19 March 2013
Wachstumsraten des BIP-Volumen (auf Grundlage saisonbereinigter Daten).png
(
file
)
14 KB
1
12:05, 25 March 2013
Tables GDP estimate-SE article.xls
(
file
)
175 KB
1
10:26, 9 April 2013
Summary 2012Q4.xls
(
file
)
143 KB
1
14:32, 3 July 2013
EU27, EA17 and US GDP growth rates 2013Q1.png
(
file
)
21 KB
1
15:22, 3 July 2013
GDP estimate.xls
(
file
)
168 KB
1
17:47, 3 July 2013
EU27, EA17 and MS GDP growth rates 2013Q1.png
(
file
)
5 KB
1
17:52, 3 July 2013
Growth rates of GDP in volume (based on seasonally adjusted data).png
(
file
)
26 KB
5
09:50, 4 July 2013
Summary 2013Q1.xls
(
file
)
148 KB
1
12:25, 4 October 2013
EU27, EA17 and MS GDP growth rates 2013Q2.png
(
file
)
6 KB
1
12:28, 4 October 2013
EU28, EU27, EA17 and MS GDP growth rates 2013Q2.png
(
file
)
6 KB
1
12:31, 4 October 2013
EU27, EA17 and US GDP growth rates 2013Q2.png
(
file
)
22 KB
1
12:33, 4 October 2013
GDP estimate 2013Q2.xls
(
file
)
169 KB
1
15:16, 4 October 2013
Growth rates of GDP in volume (based on seasonally adjusted data) 2013Q2.png
(
file
)
26 KB
2
15:19, 4 October 2013
Summary 2013Q2.xls
(
file
)
139 KB
2
14:56, 9 January 2014
EU28, EA17 and US GDP growth rates 2013Q3.png
(
file
)
20 KB
2
14:58, 9 January 2014
Summary 2013Q3.xls
(
file
)
141 KB
2
16:05, 9 January 2014
EU28, EA17 and MS GDP growth rates 2013Q3.png
(
file
)
5 KB
3
16:06, 9 January 2014
Growth rates of GDP in volume (based on seasonally adjusted data) 2013Q3.png
(
file
)
26 KB
3
16:06, 9 January 2014
GDP estimate 2013Q3.xls
(
file
)
168 KB
3
17:45, 1 April 2014
EU28, EA17 and US GDP growth rates 2013Q4.png
(
file
)
21 KB
1
17:45, 1 April 2014
EU28, EA17 and MS GDP growth rates 2013Q4.png
(
file
)
6 KB
1
17:45, 1 April 2014
Growth rates of GDP in volume (based on seasonally adjusted data) 2013Q4.png
(
file
)
25 KB
1
17:46, 1 April 2014
GDP estimate 2013Q4.xls
(
file
)
78 KB
1
17:46, 1 April 2014
Summary 2013Q4.xls
(
file
)
144 KB
1
15:30, 30 June 2014
EU28, EA17 and US GDP growth rates 2014Q1.png
(
file
)
22 KB
1
15:30, 30 June 2014
EU28, EA17 and MS GDP growth rates 2014Q1.png
(
file
)
5 KB
1
15:30, 30 June 2014
Growth rates of GDP in volume (based on seasonally adjusted data) 2014Q1.png
(
file
)
26 KB
1
15:31, 30 June 2014
GDP estimate 2014Q1.xls
(
file
)
189 KB
1
15:31, 30 June 2014
Summary 2014Q1.xlsx
(
file
)
64 KB
1
09:53, 1 July 2014
EU28, EA18 and US GDP growth rates 2014Q1.png
(
file
)
22 KB
1
12:28, 17 September 2014
EU28, EA18 and US GDP growth rates 2014Q2.png
(
file
)
23 KB
1
12:29, 17 September 2014
EU28, EA18 and MS GDP growth rates 2014Q2.png
(
file
)
45 KB
1
12:59, 19 September 2014
GDP estimate 2014Q2.doc
(
file
)
146 KB
2
15:12, 4 May 2016
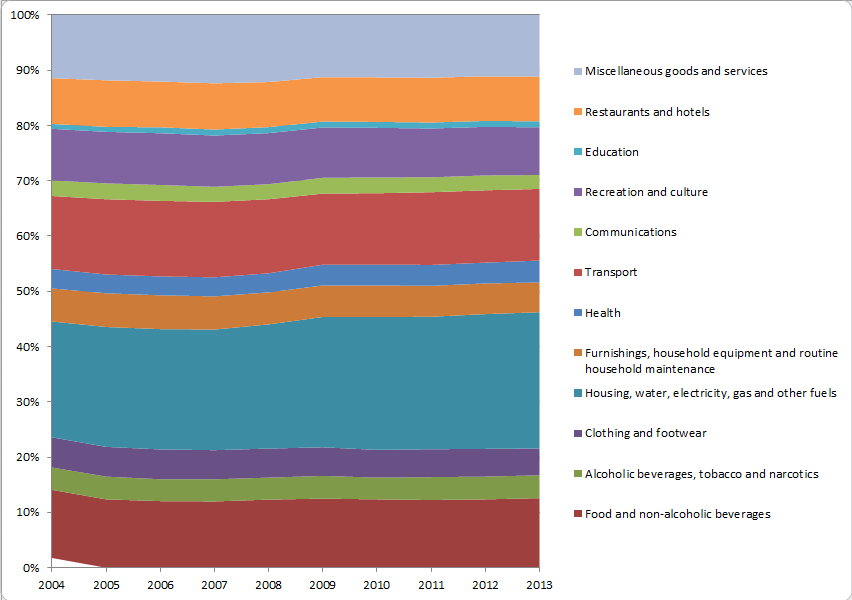
Figure 1- Evolution of household expenditure by consumption purpose – COICOP, EU-28, 2004-2013, cumulated % of GDP – Source- Eurostat (nama 10 co3 p3).png
(
file
)
17 KB
Figure 1: Evolution of household expenditure by consumption purpose – COICOP, EU-28, 2004-2013, cumulated % of GDP – Source: Eurostat (nama_10_co3_p3)
1
15:13, 4 May 2016
Figure 2- Household expenditure by consumption purpose – COICOP, EU-28, 2013, share of total – Source- Eurostat (nama 10 co3 p3).png
(
file
)
20 KB
Figure 2: Household expenditure by consumption purpose – COICOP, EU-28, 2013, share of total – Source: Eurostat (nama_10_co3_p3)
1
15:14, 4 May 2016
Table 1- Evolution of household expenditure by consumption purpose – COICOP, EU-28, 2004-2013, cumulated % of GDP – Source- Eurostat (nama 10 co3 p3).png
(
file
)
13 KB
Table 1: Evolution of household expenditure by consumption purpose – COICOP, EU-28, 2004-2013, cumulated % of GDP – Source: Eurostat (nama_10_co3_p3)
1
15:15, 4 May 2016
Table 2- Household expenditure by consumption purpose – COICOP, EU-28, 2013, share of total – Source- Eurostat (nama 10 co3 p3).png
(
file
)
13 KB
Table 2: Household expenditure by consumption purpose – COICOP, EU-28, 2013, share of total – Source: Eurostat (nama_10_co3_p3)
1
15:16, 4 May 2016
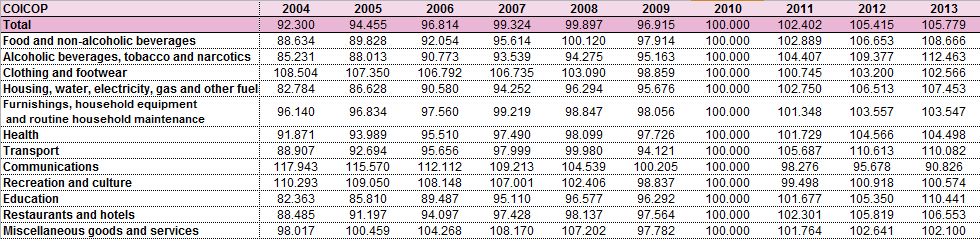
Table 3- Evolution of chain linked volumes, index 2010=100 of household expenditure by consumption purpose – COICOP, EU-28, 2004-2013 – Source- Eurostat (nama 10 co3 p3).png
(
file
)
17 KB
Table 3: Evolution of chain linked volumes, index 2010=100 of household expenditure by consumption purpose – COICOP, EU-28, 2004-2013 – Source: Eurostat (nama_10_co3_p3)
1
15:18, 4 May 2016
Table 4- Evolution of implicit deflator, 2010=100 of household expenditure by consumption purpose – COICOP, EU-28, 2004-2013 – Source- Eurostat (nama 10 co3 p3).png
(
file
)
21 KB
Table 4: Evolution of implicit deflator, 2010=100 of household expenditure by consumption purpose – COICOP, EU-28, 2004-2013 – Source: Eurostat (nama_10_co3_p3)
2
15:19, 4 May 2016
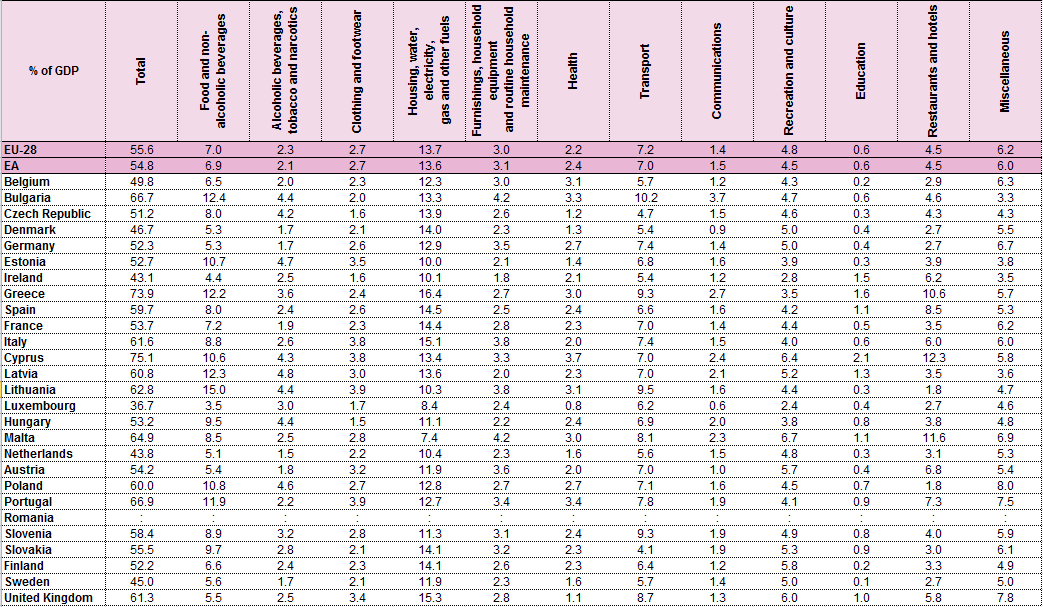
Table 5- Household expenditure by consumption purpose – COICOP, Member States, 2013, cumulated % of GDP – Source- Eurostat (nama 10 co3 p3).png
(
file
)
37 KB
Table 5: Household expenditure by consumption purpose – COICOP, Member States, 2013, cumulated % of GDP – Source: Eurostat (nama_10_co3_p3)
1
15:19, 4 May 2016
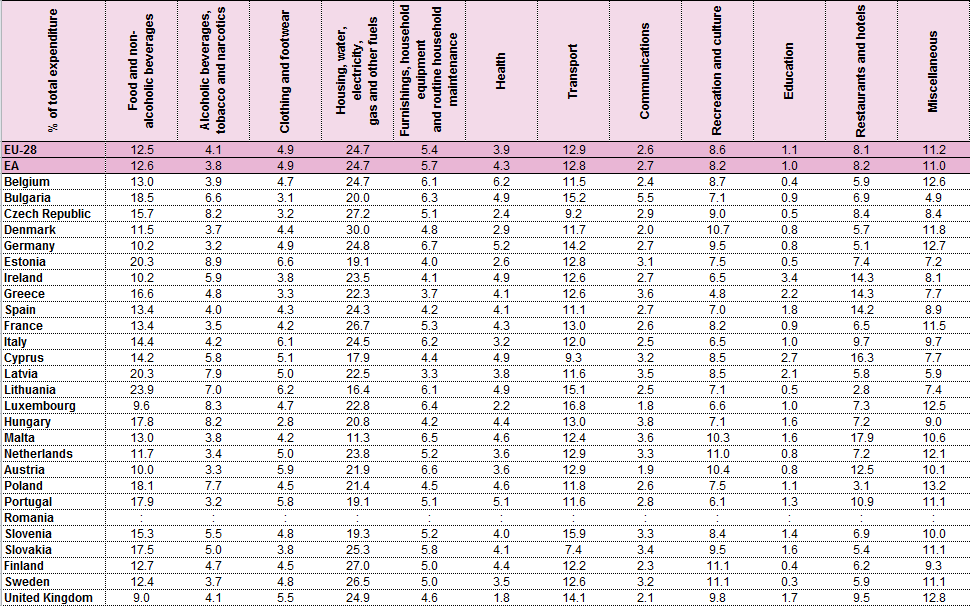
Table 6- Household expenditure by consumption purpose – COICOP, EU-28, 2013, share of total – Source- Eurostat (nama 10 co3 p3).png
(
file
)
36 KB
Table 6: Household expenditure by consumption purpose – COICOP, EU-28, 2013, share of total – Source: Eurostat (nama_10_co3_p3)
1
15:20, 4 May 2016
Figure 3- Housing, water, electricity, gas and other fuels, Member States, 2013, % of total expenditure – Source- Eurostat (nama 10 co3 p3).png
(
file
)
15 KB
Figure 3: Housing, water, electricity, gas and other fuels, Member States, 2013, % of total expenditure – Source: Eurostat (nama_10_co3_p3)
1
First page
Previous page
Next page
Last page
Special page
ISSN 2443-8219


.png)
.png)


.png)


_2013Q2.png)


_2013Q3.png)


_2013Q4.png)


_2014Q1.png)


.png)
.png)
.png)
.png)
.png)
.png)
.png)
.png)
.png)