Tutorials
Log in
Statistics Explained
menu
search
search
Navigation
Main page
Statistical themes
Glossary
Categories
Statistics 4 beginners
Tutorials
Help
Eurostat home
Education corner
Online publications
Regional yearbook
Sustainable development
Full list
Tools
User contributions
Logs
View user groups
Special pages
search
Navigation
Main page
Statistical themes
Glossary
Categories
Statistics 4 beginners
Tutorials
Help
Eurostat home
Education corner
Online publications
Regional yearbook
Sustainable development
Full list
Tools
User contributions
Logs
View user groups
Special pages
Navigation
Main page
Statistical themes
Glossary
Categories
Statistics 4 beginners
Tutorials
Help
Eurostat home
Education corner
Online publications
Regional yearbook
Sustainable development
Full list
Tools
User contributions
Logs
View user groups
Special pages
Uploads by Kremeak
This special page shows all uploaded files.
File list
Items per page:
20
50
100
250
500
Search for media name:
Username:
Include old versions of files
Go
First page
Previous page
Next page
Last page
Date
Name
Thumbnail
Size
Description
Versions
16:23, 14 June 2010
Final energy consumption by agriculture in utilised agricultural area, 2007.png
(
file
)
3 KB
3
13:29, 28 June 2010
Specialisation of farm holdings in the EU-27 in 2007.png
(
file
)
7 KB
1
14:10, 28 June 2010
Share of crop-specialist holdings in total farm holdings, EU-27, 2007.PNG
(
file
)
345 KB
1
14:12, 28 June 2010
Share of livestock-specialist holdings in total farm holdings, EU-27, 2007.PNG
(
file
)
345 KB
1
08:25, 18 August 2011
Change in Nitrogen Fertilizer Consumption by agriculture.png.png
(
file
)
6 KB
4
13:18, 18 August 2011
Energy consumption by agriculture, kgOE per ha UAA, 2007.png
(
file
)
6 KB
2
13:31, 18 August 2011
Share of fuels in energy consumption by agriculture, 2008.png
(
file
)
9 KB
1
09:23, 22 September 2011
Gross Nitrogen Balance, 2008 (kg N per ha agricultural land).png
(
file
)
4 KB
1
11:50, 3 May 2012
Livestock patterns - Livestock population in the EU, 2003 & 2007 (1000 heads).png
(
file
)
16 KB
1
11:59, 3 May 2012
Livestock patterns - Livestock population in the EU, 2003 & 2007 (1000 LSU).png
(
file
)
22 KB
2
13:12, 3 May 2012
Livestock patterns - Total and grazing livestock densities, EU27 and NO, 2007.png
(
file
)
8 KB
1
13:52, 3 May 2012
Livestock patterns - Change in total livestock and grazing livestock in LSU, 2003-2007, EU27 and NO.png
(
file
)
6 KB
1
14:12, 3 May 2012
Livestock patterns - Change in livestock densities, EU-27 and NO, 2007-2003.png
(
file
)
6 KB
1
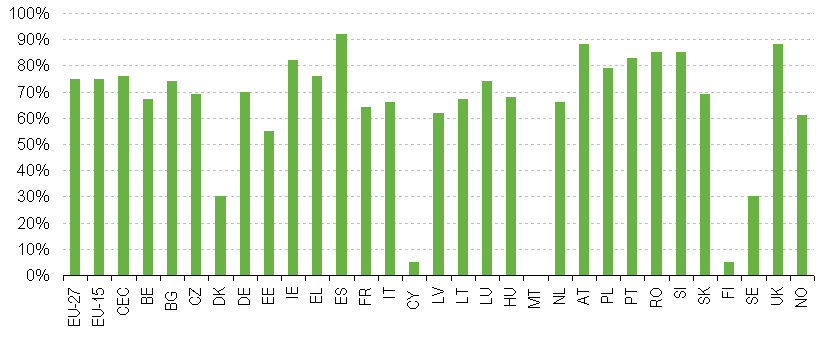
14:41, 3 May 2012
Livestock patterns - Share permanent grassland in fodder area, EU27 and NO, 2007.png
(
file
)
6 KB
1
15:30, 3 May 2012
MAP GLD 2007.JPG
(
file
)
362 KB
1
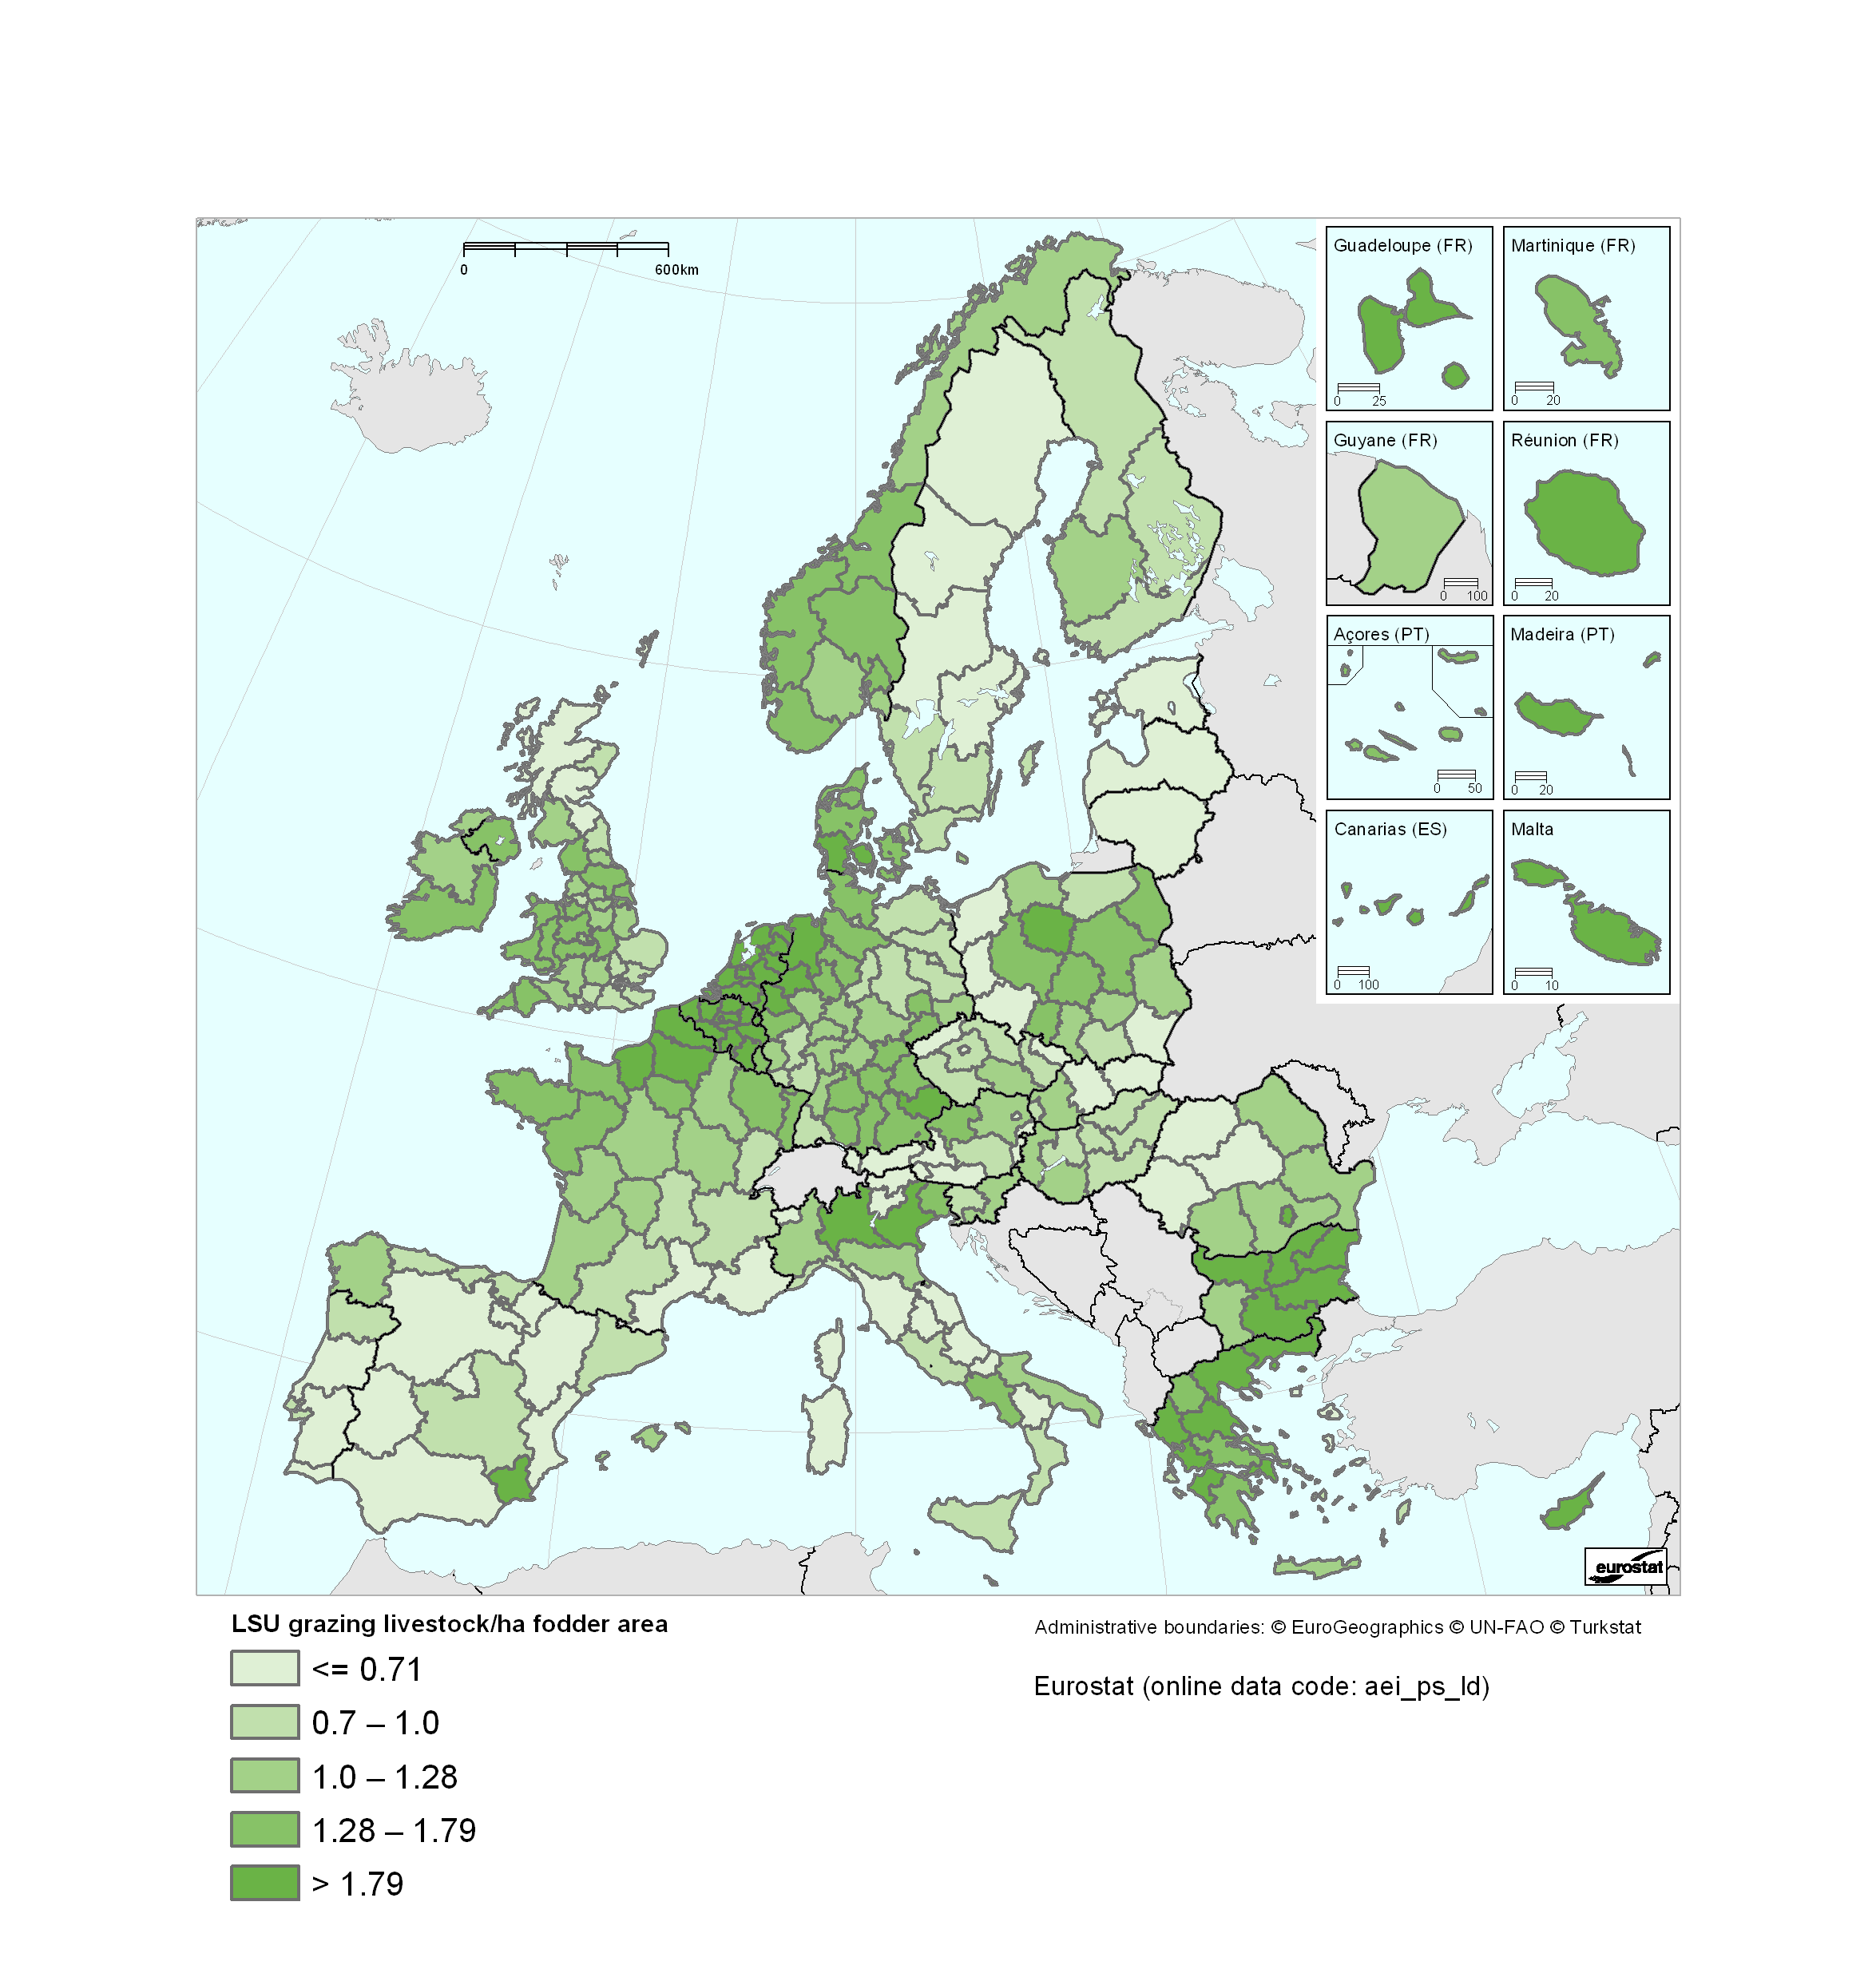
15:55, 3 May 2012
Livestock patterns - Total livestock density, EU27 and NO, NUTS2, 2007 English.PNG
(
file
)
361 KB
1
10:35, 21 May 2012
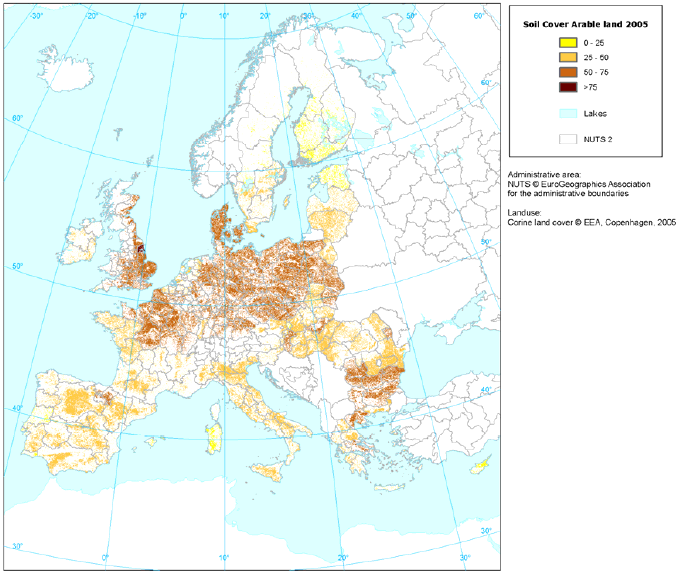
Percentage of soil cover by green crops on arable land 2005 in EU-27 (Eppler & Piorr 2007).png
(
file
)
140 KB
1
10:48, 21 May 2012
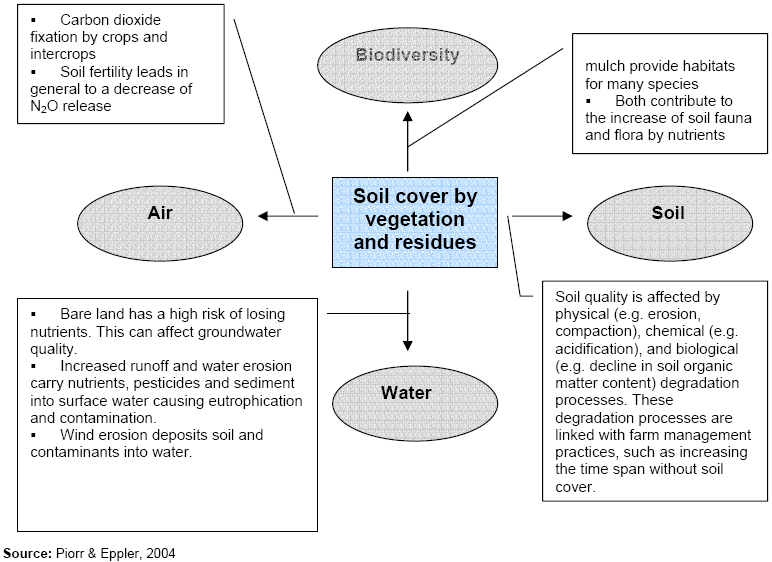
Environmental impact of soil cover on biotic and abiotic resources (Piorr & Eppler 2004).png
(
file
)
49 KB
1
13:31, 21 May 2012
Share of permanent grassland in total UAA, 2007, EU-27, CH and NO.PNG
(
file
)
355 KB
1
15:28, 21 May 2012
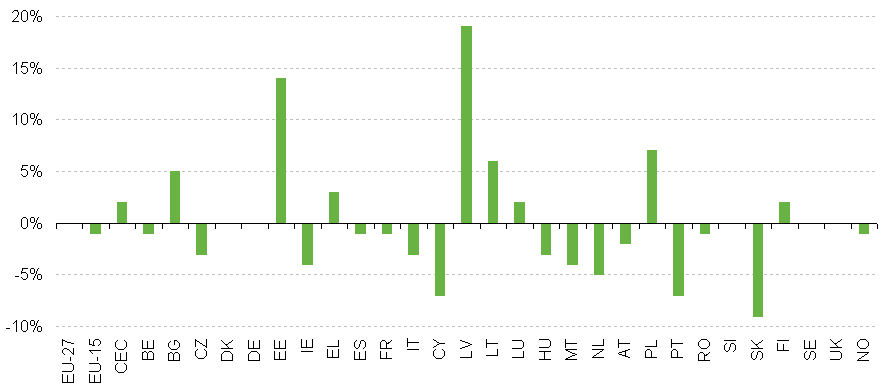
Cropping pattern, Change in UAA, EU27 and NO, 2003-2007.png
(
file
)
5 KB
2
16:01, 21 May 2012
Share of winter barley in total area of barley production.png
(
file
)
9 KB
1
15:36, 22 May 2012
Share of cover crops in winter in total UAA, 2003, EU-27, NO.PNG
(
file
)
333 KB
1
13:30, 23 May 2012
Share of maize (green and grain) in arable land, 2007, EU-27, CH and NO English.PNG
(
file
)
353 KB
4
13:06, 24 May 2012
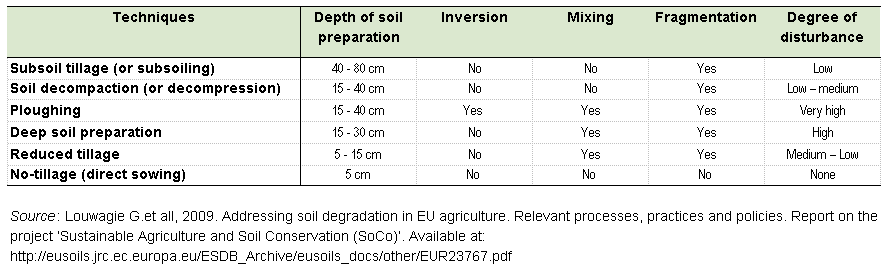
Classification of soil preparation techniques.png
(
file
)
9 KB
1
14:24, 30 May 2012
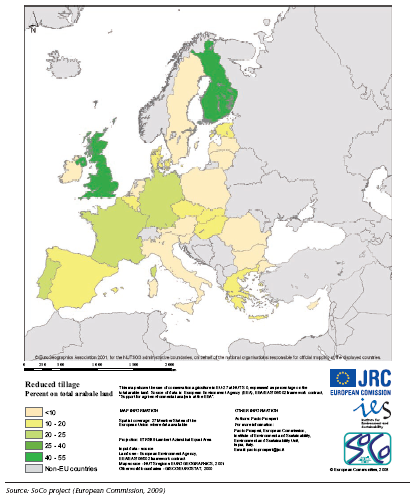
Application of reduced tillage, % of arable land, EU-27, NUTS0, 2007.png
(
file
)
109 KB
1
14:51, 30 May 2012
Application of no tillage, % of arable land, EU-27, NUTS0, 2007.png
(
file
)
135 KB
1
15:40, 5 June 2012
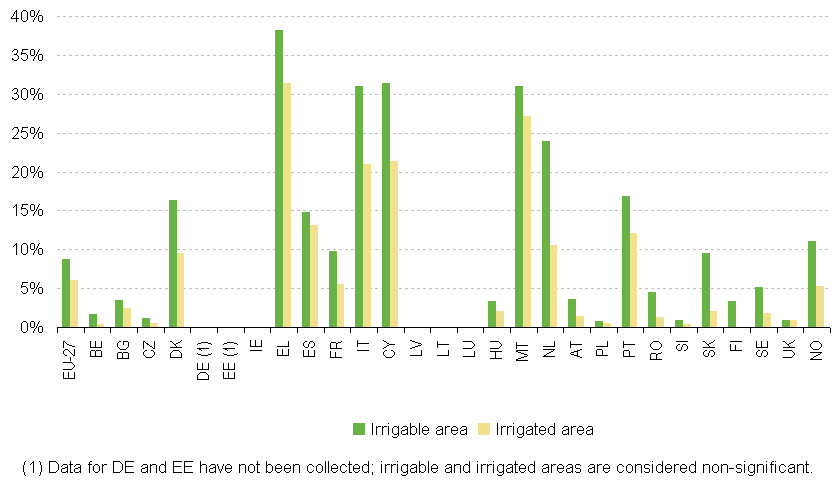
Share of irrigable and irrigated area in UAA, EU-27 and NO, 2007.png
(
file
)
8 KB
1
12:55, 6 June 2012
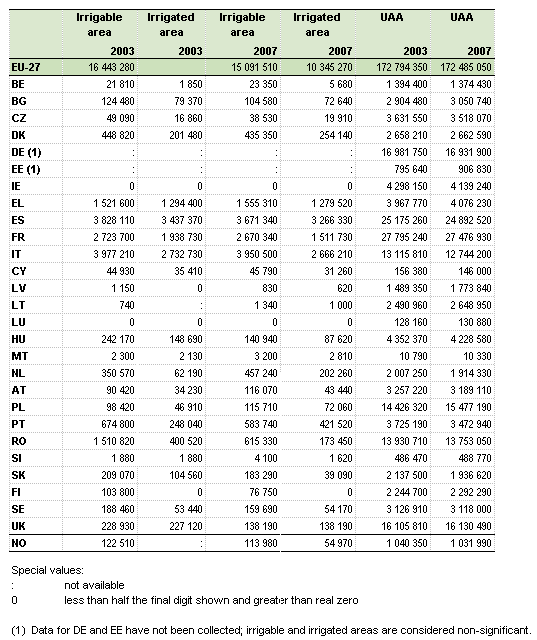
Irrigable and irrigated areas and UAA, EU-27 and NO, 2003 and 2007.png
(
file
)
16 KB
1
17:09, 6 June 2012
Map 1. Share of irrigable areas in UAA, EU-27 and NO, 2007 English.PNG
(
file
)
389 KB
1
09:59, 7 June 2012
Share of irrigated areas in UAA, EU-27 and NO, 2007.PNG
(
file
)
387 KB
1
17:19, 13 June 2012
Share of irrigated crop area in total crop area, extensive crops (citrus fruit, vines), 2003.png
(
file
)
10 KB
1
10:42, 14 June 2012
Share of irrigated crop area in total crop area, semi-intensive crops (dhurum wheat, maize), 2003.png
(
file
)
10 KB
1
14:08, 14 June 2012
Share of irrigated crop area in total crop area, intensive crops (potatoes, sugar beet), 2003.png
(
file
)
11 KB
1
15:53, 14 June 2012
Share of total holdings applying one or more irrigation methods, 2003.png
(
file
)
12 KB
1
09:07, 15 June 2012
Share of irrigation methods applied by holdings which apply irrigation methods, 2003.png
(
file
)
18 KB
1
10:42, 15 June 2012
Share of irrigable areas managed by different farmtypes, 2007.png
(
file
)
17 KB
1
13:36, 15 June 2012
Shares of irrigable areas and UAA managed by different farmtypes, 2007, EU-27 and NO.png
(
file
)
19 KB
1
14:51, 15 June 2012
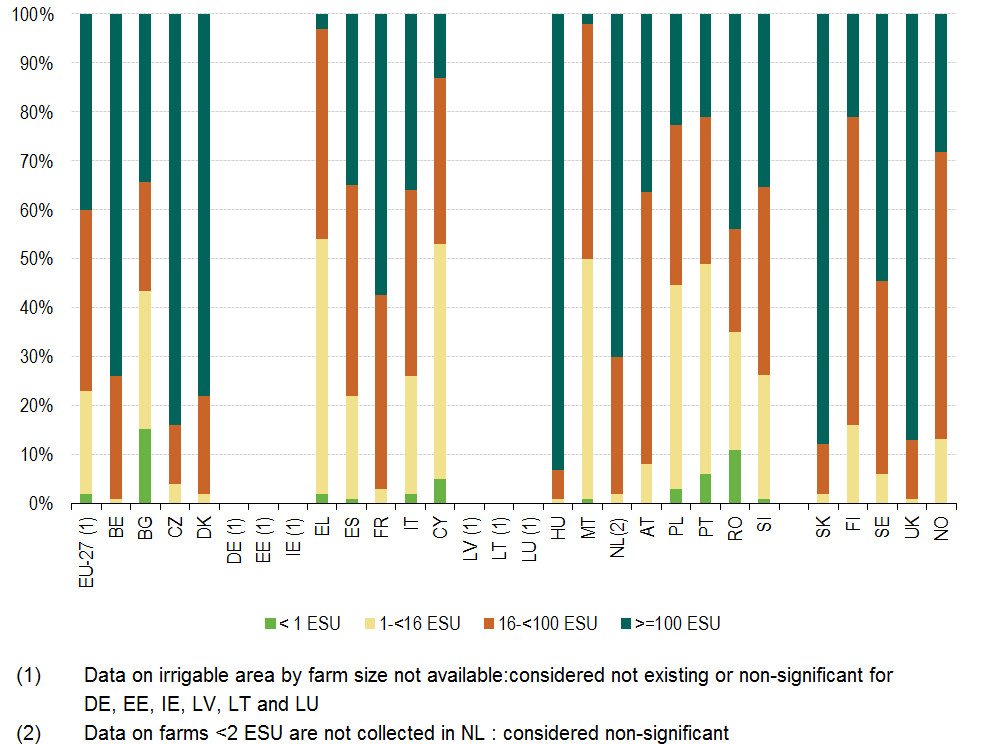
Share of farms with different sizes in irrigable areas, 2007, EU-27 and NO.png
(
file
)
21 KB
1
15:26, 15 June 2012
Share of farms with different sizes in irrigable areas and UAA, 2007, EU-27 and NO.png
(
file
)
29 KB
1
09:14, 18 June 2012
Percentage of farms with irrigable areas by main source of irrigation water, NUTS2, ES, 2003.png
(
file
)
18 KB
1
09:37, 18 June 2012
Percentage of farms with irrigable areas which reported use of specific watersource, 2003.png
(
file
)
47 KB
1
10:44, 18 June 2012
Fact sheet 07 SE.xls
(
file
)
484 KB
1
10:18, 20 June 2012
Average size (ESU) of holdings with and without area under organic farming, 2007, EU-27 and NO.png
(
file
)
11 KB
1
09:03, 21 June 2012
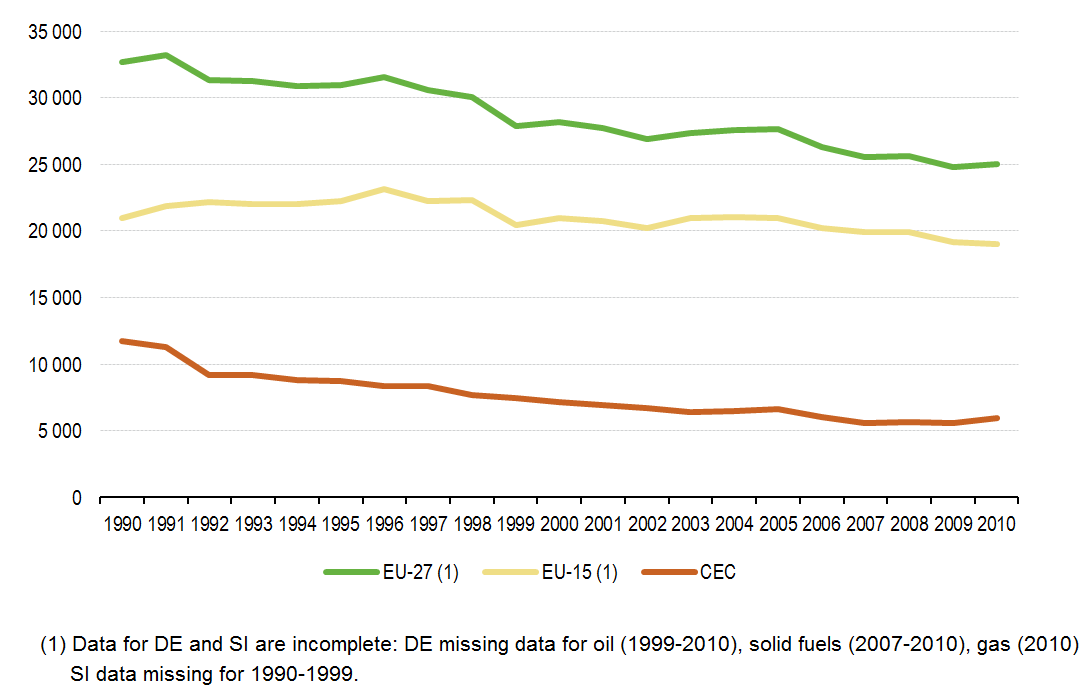
Energy consumption by agriculture, EU-27, EU-15 and CEC, 1990-2010.png
(
file
)
20 KB
1
16:18, 21 June 2012
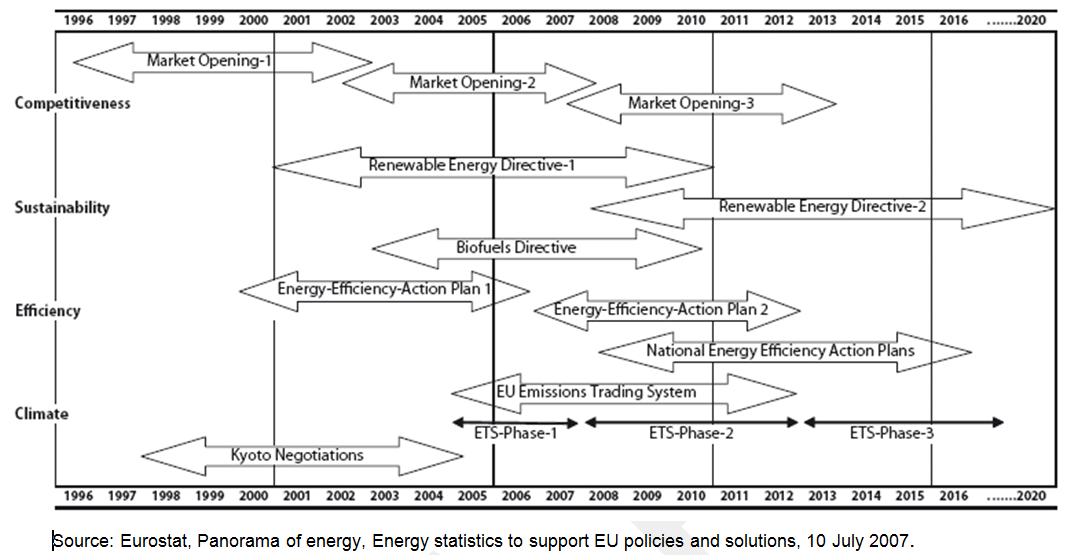
EU Energy Policy.png
(
file
)
178 KB
1
15:50, 22 June 2012
Share of fuel type in energy consumption by agriculture, EU-27, EU-15 and CEC, 1990-2010.png
(
file
)
18 KB
1
10:32, 25 June 2012
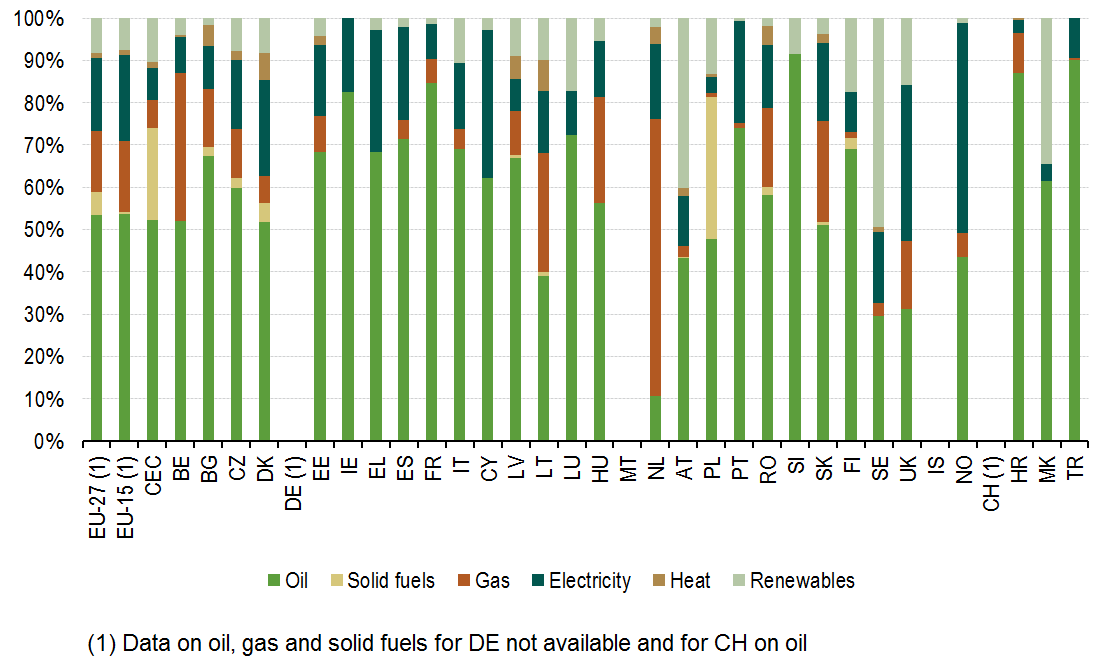
Share of fuel type in energy consumption by agriculture, EU-27 and other countries, 2010.png
(
file
)
21 KB
1
11:26, 25 June 2012
Energy consumption by agriculture, EU-27, 2010, kgOE per ha UAA.png
(
file
)
13 KB
1
16:48, 25 June 2012
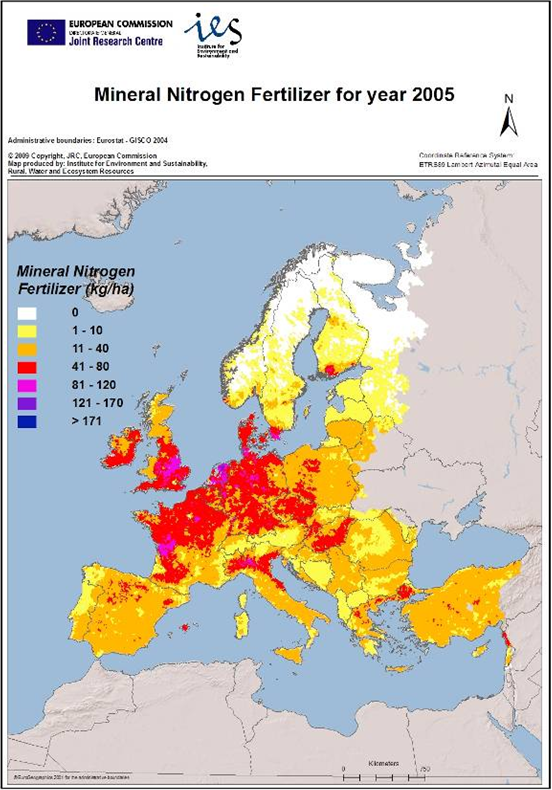
Mineral Nitrogen Fertilizer for year 2005 (IES).png
(
file
)
516 KB
1
09:42, 26 June 2012
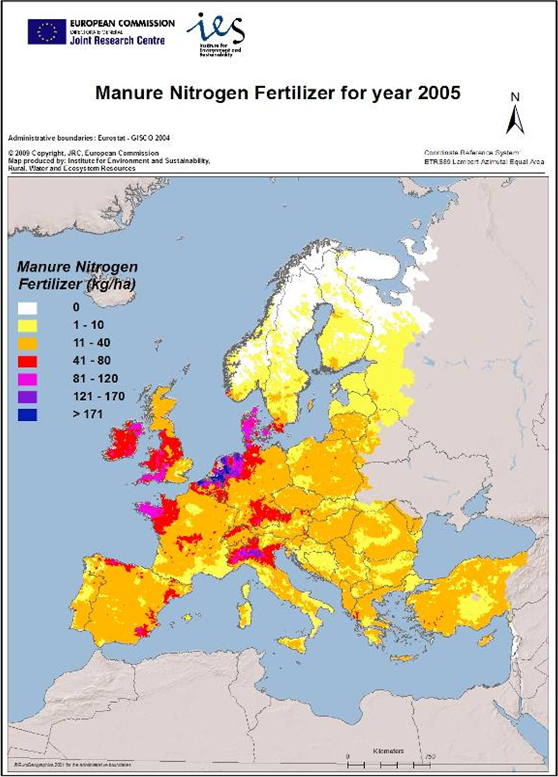
Manure Nitrogen Fertilizer for year 2005 (IES).png
(
file
)
511 KB
1
First page
Previous page
Next page
Last page
Special page
ISSN 2443-8219


.png)
.png)
.png)


.png)
.png)


_in_arable_land,_2007,_EU-27,_CH_and_NO_English.PNG)


,_2003.png)
,_2003.png)
,_2003.png)


_of_holdings_with_and_without_area_under_organic_farming,_2007,_EU-27_and_NO.png)


.png)
.png)