Tutorials
Log in
Statistics Explained
menu
search
search
Navigation
Main page
Statistical themes
Glossary
Categories
Statistics 4 beginners
Tutorials
Help
Eurostat home
Education corner
Online publications
Regional yearbook
Sustainable development
Full list
Tools
User contributions
Logs
View user groups
Special pages
search
Navigation
Main page
Statistical themes
Glossary
Categories
Statistics 4 beginners
Tutorials
Help
Eurostat home
Education corner
Online publications
Regional yearbook
Sustainable development
Full list
Tools
User contributions
Logs
View user groups
Special pages
Navigation
Main page
Statistical themes
Glossary
Categories
Statistics 4 beginners
Tutorials
Help
Eurostat home
Education corner
Online publications
Regional yearbook
Sustainable development
Full list
Tools
User contributions
Logs
View user groups
Special pages
Uploads by Kraszka
This special page shows all uploaded files.
File list
Items per page:
20
50
100
250
500
Search for media name:
Username:
Include old versions of files
Go
First page
Previous page
Next page
Last page
Date
Name
Thumbnail
Size
Description
Versions
10:07, 18 May 2018
Acquisition of citizenship and naturalisation rate, by broad group of former citizenship, 2016 MI18.png
(
file
)
77 KB
3
10:13, 18 May 2018
Acquisition of citizenship and naturalisation rate, by broad group of former citizenship, 2016 FINAL.png
(
file
)
62 KB
1
10:18, 18 May 2018
Naturalisation rate, by broad group of former citizenship, 2016 (%) FINAL.png
(
file
)
28 KB
1
10:29, 18 May 2018
Non-EU citizens with long-term residence, 2012-2016 FINAL.png
(
file
)
77 KB
2
10:33, 18 May 2018
Non-EU citizens with long-term residence, 2012-2016 1.png
(
file
)
77 KB
1
10:36, 18 May 2018
Acquisition of citizenship and naturalisation rate, by broad group of former citizenship, 2016 1.png
(
file
)
73 KB
1
10:43, 18 May 2018
Number of newly issued long-term residence permits, 2016 1.png
(
file
)
25 KB
1
12:37, 18 May 2018
Migrant integration statistics - active citizenship MII2018.xlsx
(
file
)
133 KB
1
10:34, 31 May 2018
Largest gaps in regional activity rates for nationals and citizens from other EU Member States, 2016.png
(
file
)
51 KB
1
10:38, 31 May 2018
Largest gaps in regional activity rates for nationals and citizens from other EU Member States, 2016 (percentage points difference; based on population aged 20-64).png
(
file
)
51 KB
1
10:42, 31 May 2018
Largest gaps in regional activity rates for nationals and citizens from outside the EU, 2016 (percentage points difference; based on population aged 20-64).png
(
file
)
49 KB
1
10:45, 31 May 2018
Employment rates by citizenship and degree of urbanisation, 2016 (% share of population aged 20-64).png
(
file
)
49 KB
1
10:47, 31 May 2018
Employment rates for people with a tertiary level of educational attainment living in cities, by citizenship, 2016 (% share of subpopulation aged 20-64).png
(
file
)
25 KB
1
10:49, 31 May 2018
Migrant integration statistics - regional labour market indicators MII2018.xlsx
(
file
)
2.87 MB
1
16:25, 31 May 2018
Activity rates by citizenship and degree of urbanisation, 2016 (% share of population aged 20-64).png
(
file
)
64 KB
2
08:40, 28 June 2018
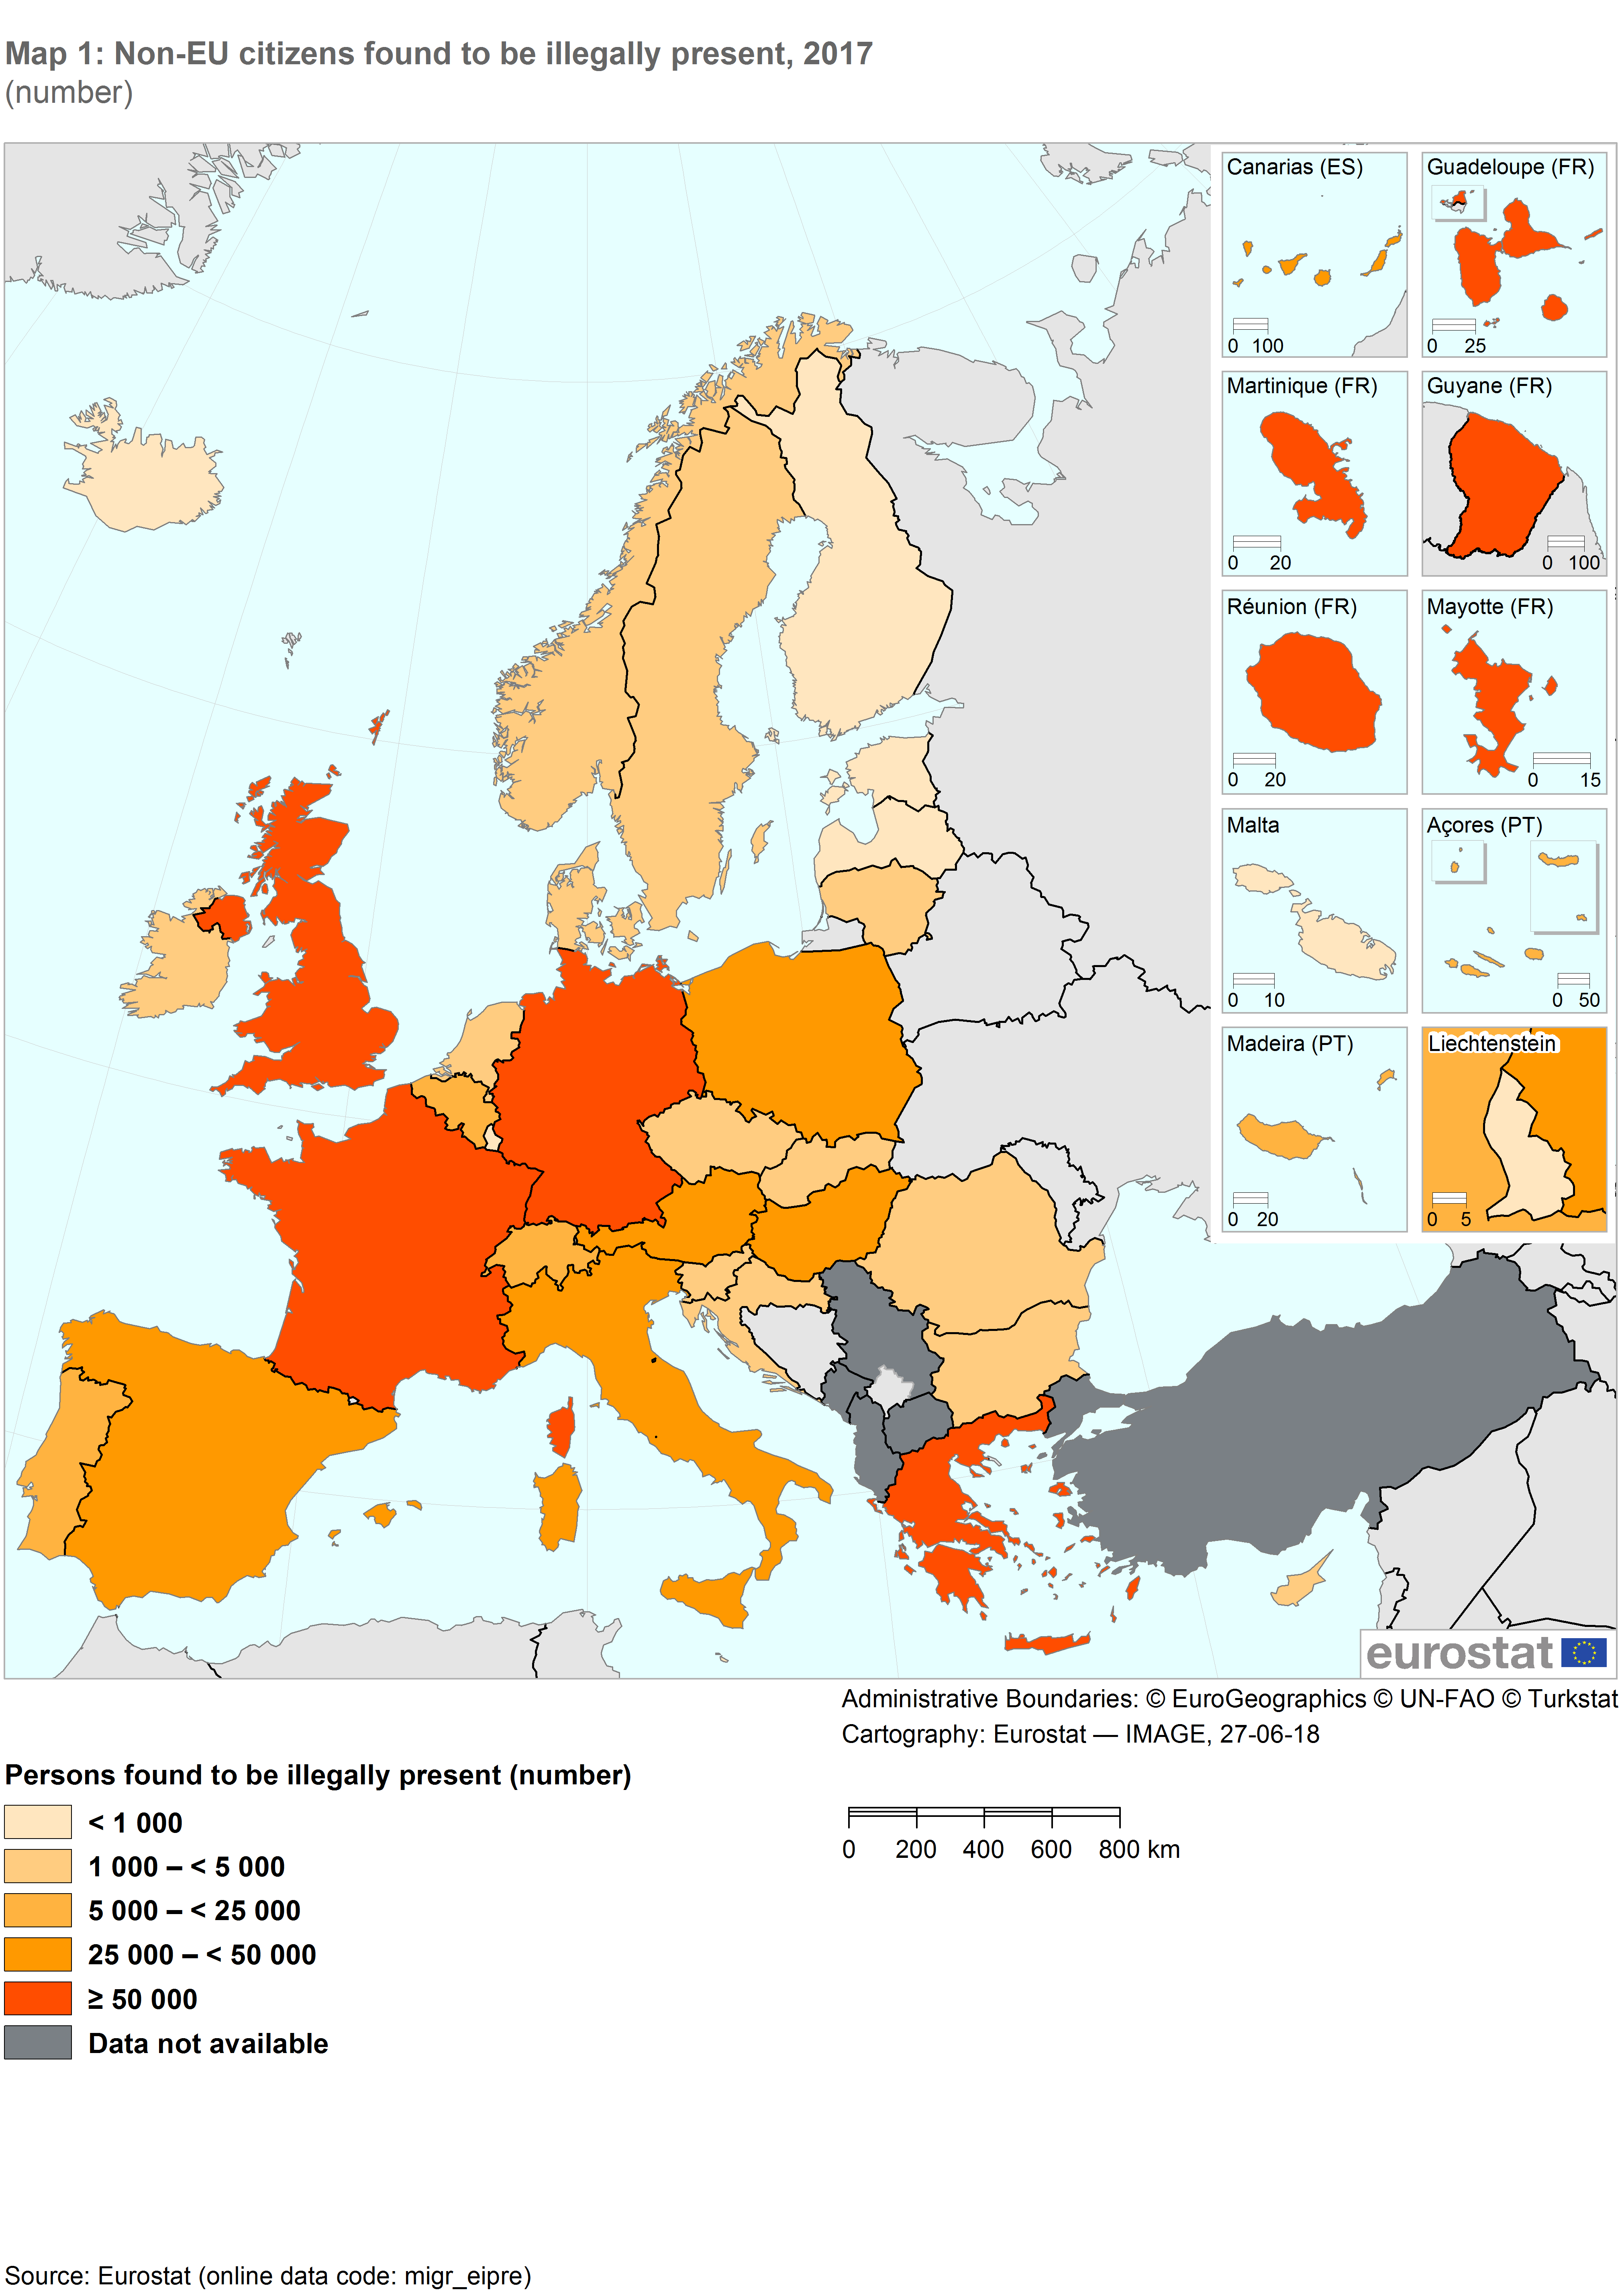
Non-EU citizens found to be illegally present 2017 1.png
(
file
)
478 KB
1
08:44, 28 June 2018
Non-EU citizens found to be illegally present in the EU, by sex and age, 2008 and 2017 (number) 1.png
(
file
)
24 KB
1
08:50, 28 June 2018
Non-EU citizens who left the EU, by type of assistance received, 2017 (%) 1.png
(
file
)
50 KB
1
08:55, 28 June 2018
Enforcement of Immigration Legislation Statistics-MII18 1.xlsx
(
file
)
287 KB
1
15:44, 3 August 2018
Classification by reasons for issuing residence permits to third-country nationals.png
(
file
)
28 KB
1
14:15, 6 August 2018
Breakdown of residence permits by types and reasons.png.PNG
(
file
)
29 KB
2
14:21, 6 August 2018
Residence permits by types and reasons.png.PNG
(
file
)
29 KB
1
14:40, 6 August 2018
Residence permits issued during the year.PNG
(
file
)
41 KB
1
14:56, 6 August 2018
Residence permits flows – categories available in the Eurostat database.png
(
file
)
27 KB
1
15:00, 6 August 2018
Residence permits flows – categories available in the Eurostat database AMM.png
(
file
)
22 KB
1
15:09, 6 August 2018
Residence permits categories in function of the existence and expiry time of previous permit.PNG
(
file
)
16 KB
1
15:30, 6 August 2018
Table 5 Third-country nationals in the usually resident population at the end of 2016 as from migration statistics and residence permits statistics.png
(
file
)
32 KB
1
16:04, 6 August 2018
Table 6 Main reasons for the difference between residence permits and migration statistics.png
(
file
)
14 KB
1
16:35, 6 August 2018
Figure 4 Stock of migrants less number of valid residence permits (12 months or over) at the end of 2016 (relative difference in %).png
(
file
)
10 KB
1
16:58, 6 August 2018
Table 7 Comparison between the number of total positive decisions on asylum applications and the number of first residence permits issued during the year for international protection reasons.png
(
file
)
24 KB
1
10:04, 9 August 2018
Box Definitions of residence permits related to EU directives AMM.png
(
file
)
69 KB
1
10:09, 9 August 2018
Table 3 Third-country nationals categories covered by EU directives in the area of legal migration AMM.png
(
file
)
32 KB
1
10:10, 9 August 2018
Figure 1 Breakdown of residence permits by types and reasons AMM.PNG
(
file
)
54 KB
1
10:12, 9 August 2018
Figure 2 Residence permits issued during the year breakdown of flows by types of permits AMM.PNG
(
file
)
41 KB
1
10:14, 9 August 2018
Table 4 Residence permits flows – categories available in the Eurostat database AMM.png
(
file
)
16 KB
1
10:15, 9 August 2018
Figure 3 Residence permits categories in function of the existence and expiry time of previous permit AMM.PNG
(
file
)
38 KB
1
10:17, 9 August 2018
Table 5 Third-country nationals in the usually resident population at the end of 2016 as from migration statistics and residence permits statistics AMM.png
(
file
)
39 KB
1
10:19, 9 August 2018
Table 6 Main reasons for the difference between residence permits and migration statistics AMM.png
(
file
)
13 KB
1
10:20, 9 August 2018
Figure 4 Stock of migrants less number of valid residence permits (12 months or more) at the end of 2016 (relative difference in %) AMM.png
(
file
)
18 KB
1
10:21, 9 August 2018
Table 7 Comparison between the number of total positive decisions on asylum applications and the number of first residence permits issued during the year for international protection reasons AMM.png
(
file
)
32 KB
1
13:01, 9 August 2018
Table 1 Classification by reasons for issuing residence permits to third-country nationals AMM 1.png
(
file
)
18 KB
1
13:03, 9 August 2018
Table 2 Other classifications used for residence permits statistics AMM 1.png
(
file
)
18 KB
1
13:05, 9 August 2018
Table 3 Third-country nationals categories covered by EU directives in the area of legal migration AMM 1.png
(
file
)
34 KB
1
13:07, 9 August 2018
Figure 1 Breakdown of residence permits by types and reasons AMM 1.PNG
(
file
)
54 KB
1
13:08, 9 August 2018
Table 4 Residence permits flows – categories available in the Eurostat database AMM 1.png
(
file
)
16 KB
1
13:10, 9 August 2018
Figure 3 Residence permits categories in function of the existence and expiry time of previous permit AMM 1.PNG
(
file
)
39 KB
1
13:11, 9 August 2018
Table 6 Main reasons for the difference between residence permits and migration statistics AMM 1.png
(
file
)
13 KB
1
14:50, 9 August 2018
Statistics on residence permits overview on methodological and analytical framework AMM.xlsx
(
file
)
329 KB
1
16:17, 9 August 2018
Table 2 Other classifications used for residence permits statistics AMM 2.png
(
file
)
24 KB
1
16:04, 10 August 2018
Activity rates by broad groups of citizenship and NUTS 2 regions, 2017.png
(
file
)
Error creating thumbnail: File with dimensions greater than 30 MP
1.78 MB
1
First page
Previous page
Next page
Last page
Special page
ISSN 2443-8219


_FINAL.png)


.png)
.png)
.png)
.png)
.png)

_1.png)
_1.png)


_at_the_end_of_2016_(relative_difference_in_%25).png)


_at_the_end_of_2016_(relative_difference_in_%25)_AMM.png)


