Tutorials
Log in
Statistics Explained
menu
search
search
Navigation
Main page
Statistical themes
Glossary
Categories
Statistics 4 beginners
Tutorials
Help
Eurostat home
Education corner
Online publications
Regional yearbook
Sustainable development
Full list
Tools
User contributions
Logs
View user groups
Special pages
search
Navigation
Main page
Statistical themes
Glossary
Categories
Statistics 4 beginners
Tutorials
Help
Eurostat home
Education corner
Online publications
Regional yearbook
Sustainable development
Full list
Tools
User contributions
Logs
View user groups
Special pages
Navigation
Main page
Statistical themes
Glossary
Categories
Statistics 4 beginners
Tutorials
Help
Eurostat home
Education corner
Online publications
Regional yearbook
Sustainable development
Full list
Tools
User contributions
Logs
View user groups
Special pages
Uploads by Ilisero
This special page shows all uploaded files.
File list
Items per page:
20
50
100
250
500
Search for media name:
Username:
Include old versions of files
Go
First page
Previous page
Next page
Last page
Date
Name
Thumbnail
Size
Description
Versions
15:12, 14 June 2021
F2 Relative importance of Mining and quarrying statistics (NACE Section B), EU, 2018.png
(
file
)
57 KB
null
1
15:12, 14 June 2021
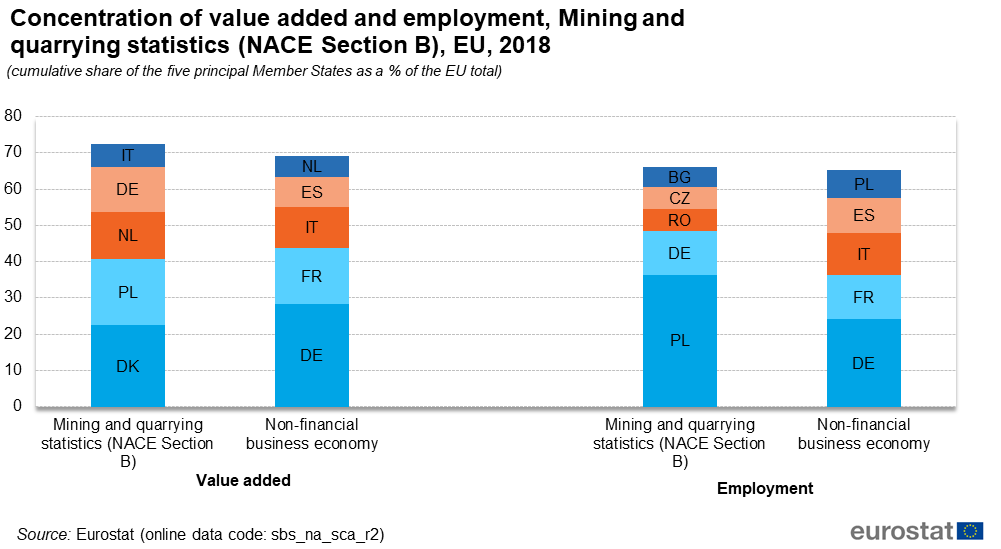
F3 Concentration of value added and employment, Mining and quarrying statistics (NACE Section B), EU, 2018.png
(
file
)
50 KB
null
1
15:12, 14 June 2021
F4 Relative importance of enterprise size classes, Mining and quarrying statistics (NACE Section B), EU, 2018.png
(
file
)
62 KB
null
1
15:12, 14 June 2021
F5 Sectoral analysis of employment by enterprise size class, Mining and quarrying statistics (NACE Section B), EU, 2018.png
(
file
)
46 KB
null
1
15:12, 14 June 2021
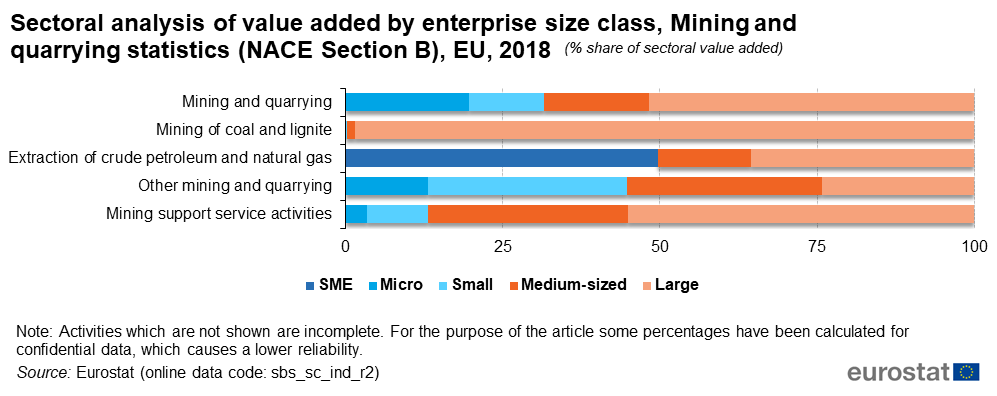
F6 Sectoral analysis of value added by enterprise size class, Mining and quarrying statistics (NACE Section B), EU, 2018.png
(
file
)
46 KB
null
1
15:12, 14 June 2021
T1 Key indicators, Mining and quarrying statistics (NACE Section B), EU, 2018.png
(
file
)
32 KB
null
1
15:12, 14 June 2021
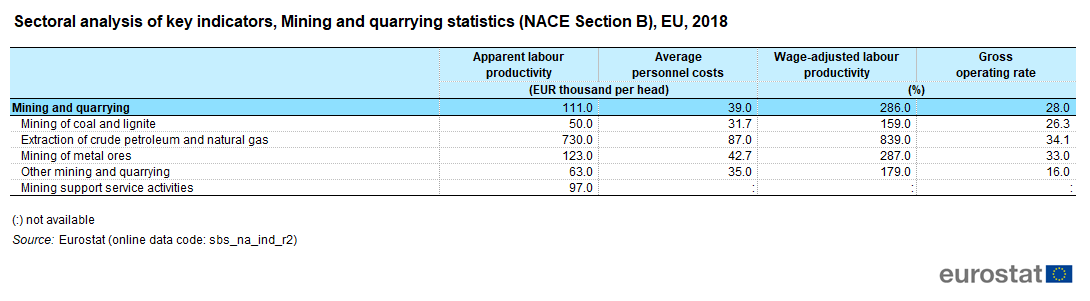
T2a Sectoral analysis of key indicators, Mining and quarrying statistics (NACE Section B), EU, 2018.png
(
file
)
34 KB
null
1
15:12, 14 June 2021
T2b Sectoral analysis of key indicators, Mining and quarrying statistics (NACE Section B), EU, 2018.png
(
file
)
32 KB
null
1
15:25, 14 June 2021
F5 Sectoral analysis of employment by enterprise size class, Mining and quarrying statistics (NACE Section B), EU, 2018 2.png
(
file
)
45 KB
null
1
15:25, 14 June 2021
F6 Sectoral analysis of value added by enterprise size class, Mining and quarrying statistics (NACE Section B), EU, 2018 2.png
(
file
)
46 KB
null
1
15:25, 14 June 2021
F4 Relative importance of enterprise size classes, Mining and quarrying statistics (NACE Section B), EU, 2018 2.png
(
file
)
62 KB
null
1
15:25, 14 June 2021
F2 Relative importance of Mining and quarrying statistics (NACE Section B), EU, 2018 2.png
(
file
)
57 KB
null
1
15:25, 14 June 2021
F3 Concentration of value added and employment, Mining and quarrying statistics (NACE Section B), EU, 2018 2.png
(
file
)
50 KB
null
1
15:25, 14 June 2021
F1 Sectoral analysis of Mining and quarrying statistics (NACE Section B), EU, 2018 2.png
(
file
)
32 KB
null
1
17:03, 14 June 2021
F4 Relative importance of enterprise size classes, Electricity, gas, steam and air conditioning supply (NACE Section D), EU, 2018.png
(
file
)
67 KB
null
1
17:03, 14 June 2021
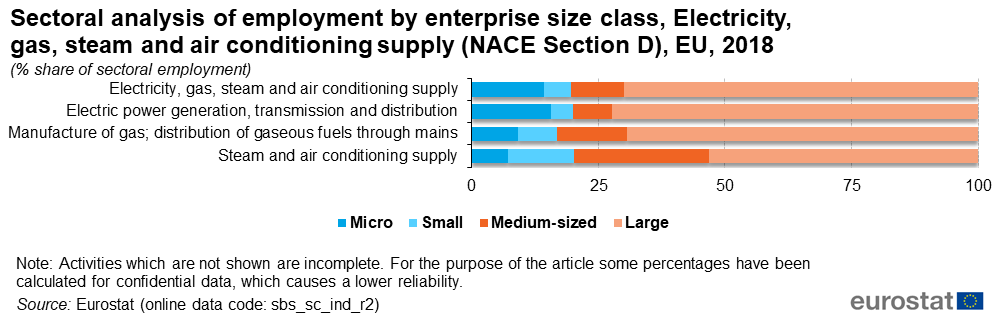
F5 Sectoral analysis of employment by enterprise size class, Electricity, gas, steam and air conditioning supply (NACE Section D), EU, 2018.png
(
file
)
46 KB
null
1
17:03, 14 June 2021
F6 Sectoral analysis of value added by enterprise size class, Electricity, gas, steam and air conditioning supply (NACE Section D), EU, 2018.png
(
file
)
47 KB
null
1
17:03, 14 June 2021
T1 Key indicators, Electricity, gas, steam and air conditioning supply (NACE Section D), EU, 2018.png
(
file
)
38 KB
null
1
17:03, 14 June 2021
T2a Sectoral analysis of key indicators, Electricity, gas, steam and air conditioning supply (NACE Section D), EU, 2018.png
(
file
)
32 KB
null
1
17:03, 14 June 2021
F1 Sectoral analysis of Electricity, gas, steam and air conditioning supply (NACE Section D), EU, 2018.png
(
file
)
36 KB
null
1
17:03, 14 June 2021
F2 Relative importance of Electricity, gas, steam and air conditioning supply (NACE Section D), EU, 2018.png
(
file
)
58 KB
null
1
17:03, 14 June 2021
T2b Sectoral analysis of key indicators, Electricity, gas, steam and air conditioning supply (NACE Section D), EU, 2018.png
(
file
)
30 KB
null
1
17:03, 14 June 2021
F3 Concentration of value added and employment, Electricity, gas, steam and air conditioning supply (NACE Section D), EU, 2018.png
(
file
)
52 KB
null
1
11:52, 15 June 2021
F2 Relative importance of Water supply; sewerage, waste management and remediation activities (NACE Section E), EU, 2018.png
(
file
)
60 KB
null
1
11:52, 15 June 2021
F3 Concentration of value added and employment, Water supply; sewerage, waste management and remediation activities (NACE Section E), EU, 2018.png
(
file
)
56 KB
null
1
11:52, 15 June 2021
F4 Relative importance of enterprise size classes, Water supply; sewerage, waste management and remediation activities (NACE Section E), EU, 2018.png
(
file
)
63 KB
null
1
11:52, 15 June 2021
F5 Sectoral analysis of employment by enterprise size class, Water supply; sewerage, waste management and remediation activities (NACE Section E), EU, 2018.png
(
file
)
49 KB
null
1
11:52, 15 June 2021
F1 Sectoral analysis of Water supply; sewerage, waste management and remediation activities (NACE Section E), EU, 2018.png
(
file
)
39 KB
null
1
11:52, 15 June 2021
T1 Key indicators, Water supply; sewerage, waste management and remediation activities (NACE Section E), EU, 2018.png
(
file
)
39 KB
null
1
11:52, 15 June 2021
T2b Sectoral analysis of key indicators, Water supply; sewerage, waste management and remediation activities (NACE Section E), EU, 2018.png
(
file
)
34 KB
null
1
11:56, 15 June 2021
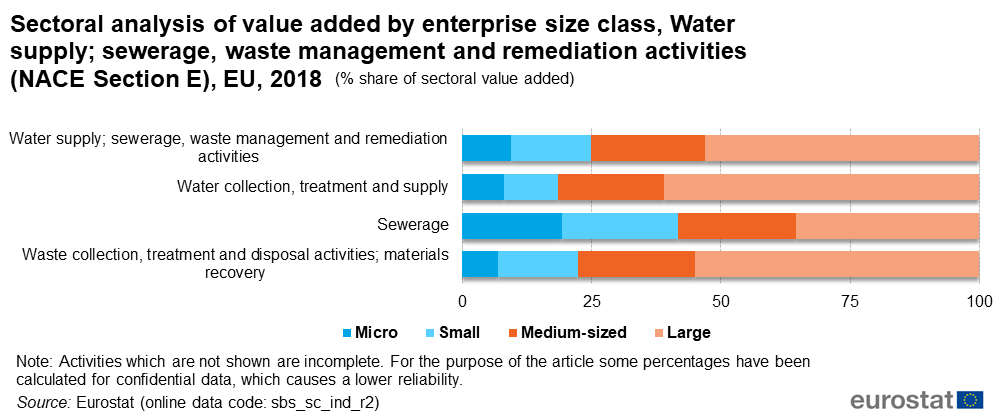
F6 Sectoral analysis of value added by enterprise size class, Water supply; sewerage, waste management and remediation activities (NACE Section E), EU, 2018.png
(
file
)
51 KB
null
1
11:56, 15 June 2021
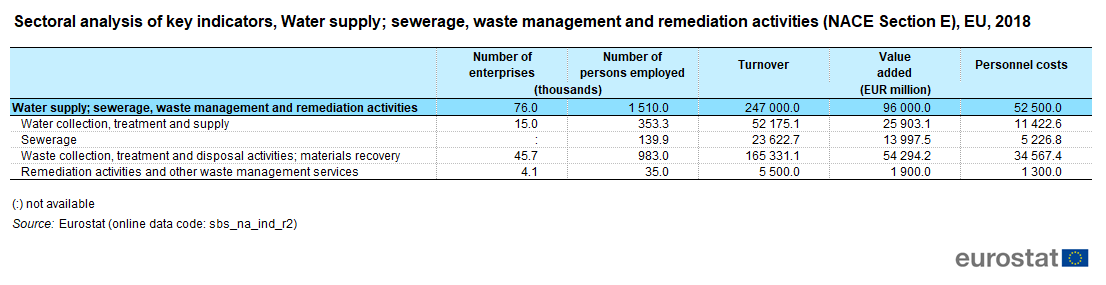
T2a Sectoral analysis of key indicators, Water supply; sewerage, waste management and remediation activities (NACE Section E), EU, 2018.png
(
file
)
36 KB
null
1
12:37, 15 June 2021
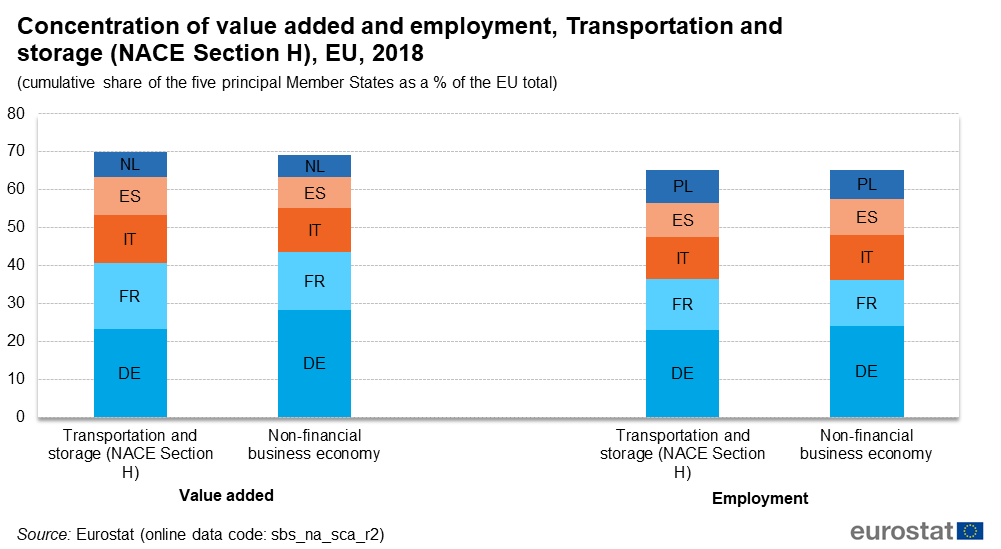
F3 Concentration of value added and employment, Transportation and storage (NACE Section H), EU, 2018.png
(
file
)
48 KB
null
1
12:37, 15 June 2021
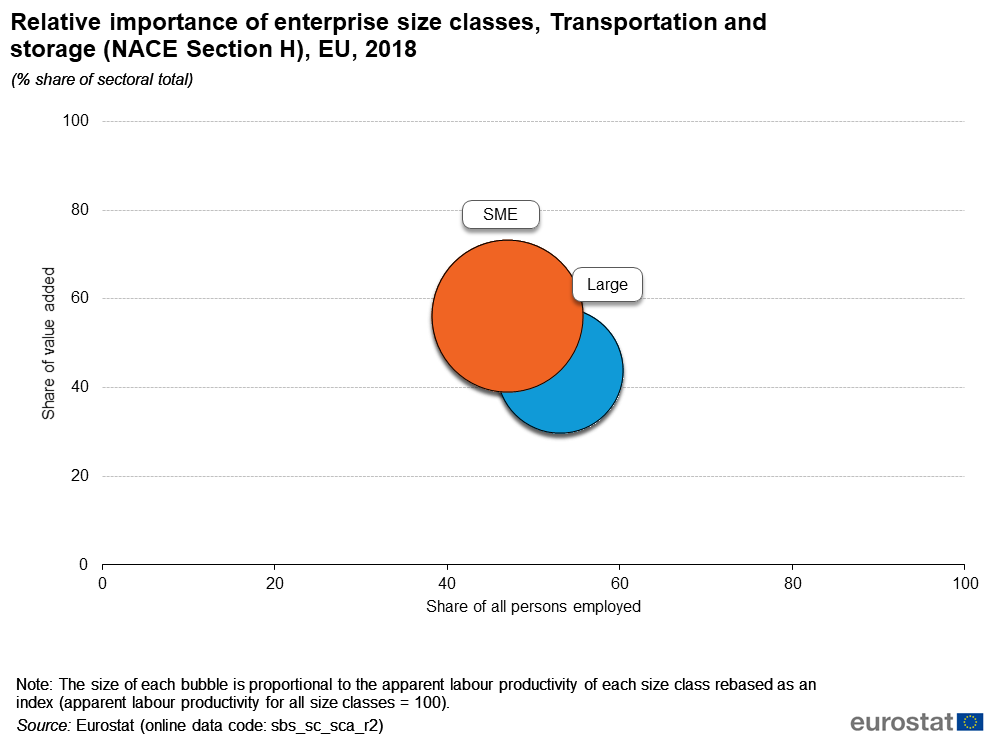
F4 Relative importance of enterprise size classes, Transportation and storage (NACE Section H), EU, 2018.png
(
file
)
59 KB
null
1
12:37, 15 June 2021
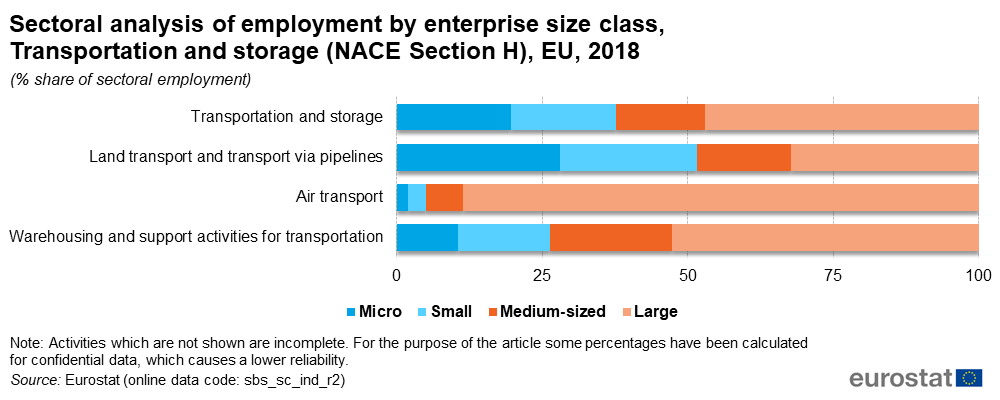
F5 Sectoral analysis of employment by enterprise size class, Transportation and storage (NACE Section H), EU, 2018.png
(
file
)
44 KB
null
1
12:37, 15 June 2021
F6 Sectoral analysis of value added by enterprise size class, Transportation and storage (NACE Section H), EU, 2018.png
(
file
)
47 KB
null
1
12:37, 15 June 2021
T1 Key indicators, Transportation and storage (NACE Section H), EU, 2018.png
(
file
)
37 KB
null
1
12:37, 15 June 2021
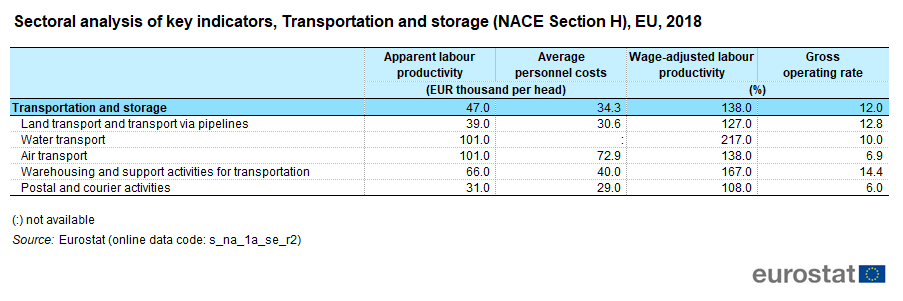
T2a Sectoral analysis of key indicators, Transportation and storage (NACE Section H), EU, 2018.png
(
file
)
33 KB
null
1
12:37, 15 June 2021
T2b Sectoral analysis of key indicators, Transportation and storage (NACE Section H), EU, 2018.png
(
file
)
30 KB
null
1
12:38, 15 June 2021
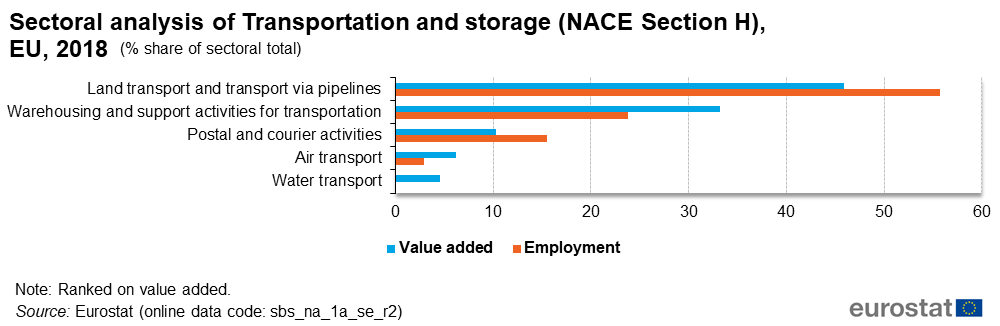
F1 Sectoral analysis of Transportation and storage (NACE Section H), EU, 2018.png
(
file
)
32 KB
null
1
12:38, 15 June 2021
F2 Relative importance of Transportation and storage (NACE Section H), EU, 2018.png
(
file
)
56 KB
null
1
15:32, 15 June 2021
F3 Concentration of value added and employment, Real estate activities (NACE Section L), EU, 2018.png
(
file
)
48 KB
null
1
15:32, 15 June 2021
F4 Relative importance of enterprise size classes, Real estate activities (NACE Section L), EU, 2018.png
(
file
)
61 KB
null
1
15:32, 15 June 2021
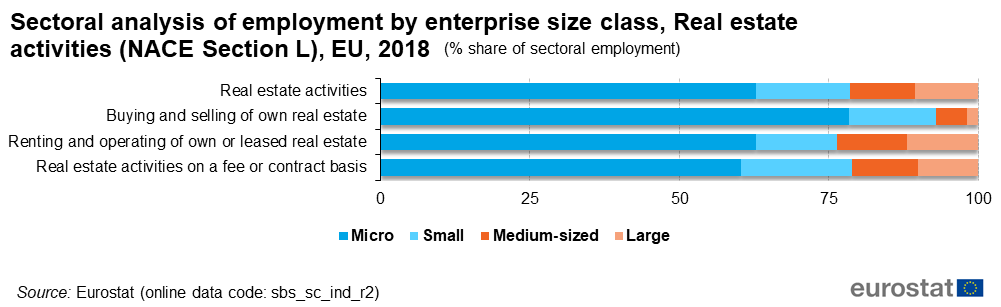
F5 Sectoral analysis of employment by enterprise size class, Real estate activities (NACE Section L), EU, 2018.png
(
file
)
36 KB
null
1
15:32, 15 June 2021
F1 Sectoral analysis of Real estate activities (NACE Section L), EU, 2018.png
(
file
)
33 KB
null
1
15:32, 15 June 2021
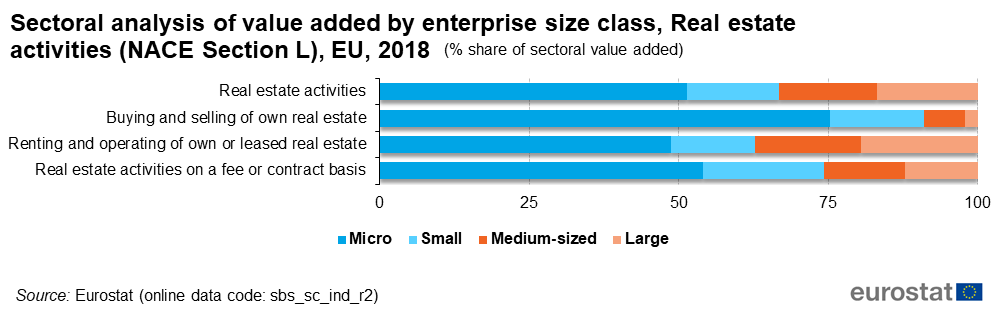
F6 Sectoral analysis of value added by enterprise size class, Real estate activities (NACE Section L), EU, 2018.png
(
file
)
36 KB
null
1
15:32, 15 June 2021
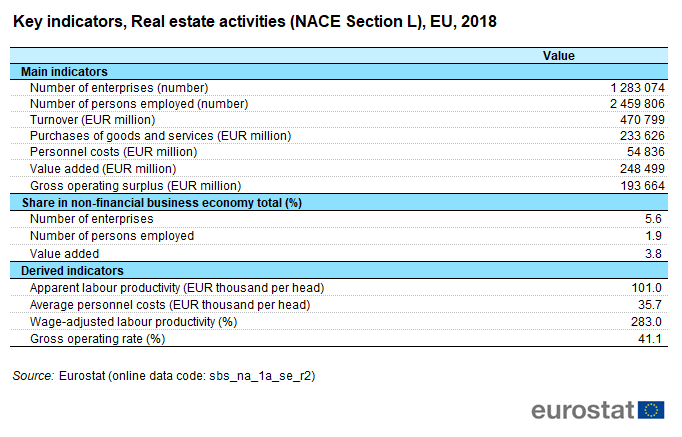
T1 Key indicators, Real estate activities (NACE Section L), EU, 2018.png
(
file
)
37 KB
null
1
15:32, 15 June 2021
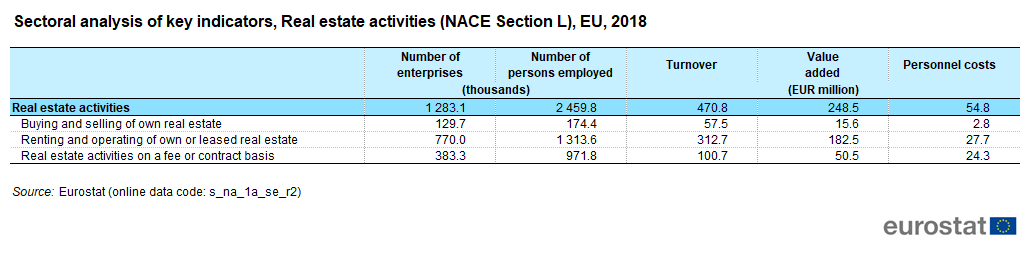
T2a Sectoral analysis of key indicators, Real estate activities (NACE Section L), EU, 2018.png
(
file
)
28 KB
null
1
15:32, 15 June 2021
T2b Sectoral analysis of key indicators, Real estate activities (NACE Section L), EU, 2018.png
(
file
)
27 KB
null
1
15:32, 15 June 2021
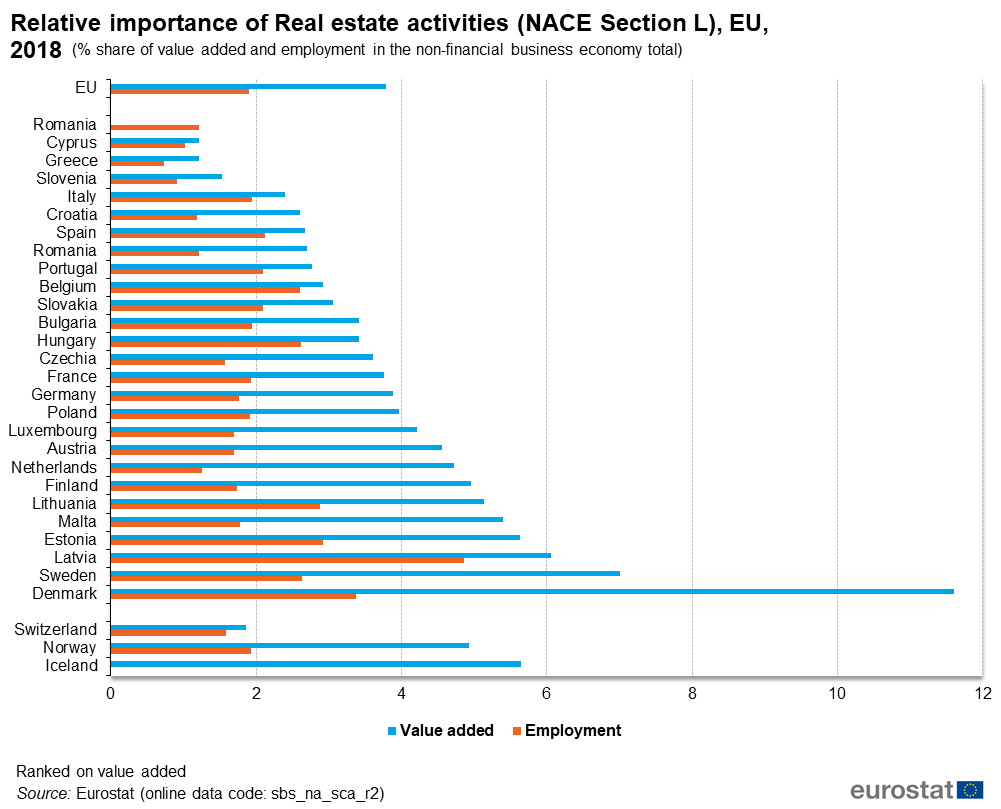
F2 Relative importance of Real estate activities (NACE Section L), EU, 2018.png
(
file
)
57 KB
null
1
First page
Previous page
Next page
Last page
Special page
ISSN 2443-8219
,_EU,_2018.png)
,_EU,_2018.png)
,_EU,_2018.png)
,_EU,_2018.png)
,_EU,_2018.png)
,_EU,_2018.png)
,_EU,_2018.png)
,_EU,_2018_2.png)
,_EU,_2018_2.png)
,_EU,_2018_2.png)
,_EU,_2018_2.png)
,_EU,_2018_2.png)
,_EU,_2018_2.png)
,_EU,_2018.png)
,_EU,_2018.png)
,_EU,_2018.png)
,_EU,_2018.png)
,_EU,_2018.png)
,_EU,_2018.png)
,_EU,_2018.png)
,_EU,_2018.png)
,_EU,_2018.png)
,_EU,_2018.png)
,_EU,_2018.png)
,_EU,_2018.png)
,_EU,_2018.png)
,_EU,_2018.png)
,_EU,_2018.png)
,_EU,_2018.png)
,_EU,_2018.png)
,_EU,_2018.png)
,_EU,_2018.png)
,_EU,_2018.png)
,_EU,_2018.png)
,_EU,_2018.png)
,_EU,_2018.png)
,_EU,_2018.png)
,_EU,_2018.png)
,_EU,_2018.png)
,_EU,_2018.png)
,_EU,_2018.png)
,_EU,_2018.png)
,_EU,_2018.png)
,_EU,_2018.png)
,_EU,_2018.png)
,_EU,_2018.png)
,_EU,_2018.png)
,_EU,_2018.png)
,_EU,_2018.png)
,_EU,_2018.png)