Tutorials
Log in
Statistics Explained
menu
search
search
Navigation
Main page
Statistical themes
Glossary
Categories
Statistics 4 beginners
Tutorials
Help
Eurostat home
Education corner
Online publications
Regional yearbook
Sustainable development
Full list
Tools
User contributions
Logs
View user groups
Special pages
search
Navigation
Main page
Statistical themes
Glossary
Categories
Statistics 4 beginners
Tutorials
Help
Eurostat home
Education corner
Online publications
Regional yearbook
Sustainable development
Full list
Tools
User contributions
Logs
View user groups
Special pages
Navigation
Main page
Statistical themes
Glossary
Categories
Statistics 4 beginners
Tutorials
Help
Eurostat home
Education corner
Online publications
Regional yearbook
Sustainable development
Full list
Tools
User contributions
Logs
View user groups
Special pages
Uploads by Gwenaelle.lecoroller
This special page shows all uploaded files.
File list
Items per page:
20
50
100
250
500
Search for media name:
Username:
Include old versions of files
Go
First page
Previous page
Next page
Last page
Date
Name
Thumbnail
Size
Description
Versions
16:15, 23 September 2013
Workflow 2011 LFS AHM questions.JPG
(
file
)
30 KB
3
16:21, 23 September 2013
Non response 2011 LFS AHM.JPG
(
file
)
41 KB
1
16:39, 23 September 2013
Proportion employed 2011 LFS AHM non response.JPG
(
file
)
27 KB
1
09:51, 24 September 2013
Proportion disabled 2011 LFS AHM.JPG
(
file
)
49 KB
1
09:53, 24 September 2013
Proportion living alone 2011 LFS AHM.JPG
(
file
)
43 KB
1
10:09, 24 September 2013
Distribution age disabled 2011 LFS AHM.JPG
(
file
)
68 KB
1
12:31, 8 January 2014
HRST by occupation 2010.PNG
(
file
)
22 KB
3
12:32, 8 January 2014
The 25 NUTS 2 regions with the highest shares of HRST core in the active population, 2010.PNG
(
file
)
34 KB
3
12:33, 8 January 2014
HRST aged 25- 64 years, by age groups, 2010.PNG
(
file
)
20 KB
3
12:33, 8 January 2014
The 20 NUTS 1 regions with the highest shares of women working in science and technology occupations (HRSTO), 2010.PNG
(
file
)
34 KB
3
12:34, 8 January 2014
Economic statistics on high tech sectors, EU27, 2008.PNG
(
file
)
54 KB
4
12:35, 8 January 2014
Statistics on employment in high - tech sectors, EU-27 and selected countries, 2010.PNG
(
file
)
63 KB
2
12:36, 8 January 2014
Regional disparities in employment in high-tech sectors as a percentage of total employment NUTS level2, 2010.PNG
(
file
)
64 KB
2
12:36, 8 January 2014
Breakdown of world high tech exports by group of products 2009.PNG
(
file
)
24 KB
2
12:37, 8 January 2014
High-tech exports by high-technology group of products, EU-27 and selected countries, 2012.JPG
(
file
)
24 KB
2
12:19, 15 January 2014
Regional disparities in employment in high-tech sectors as a percentage of total employment (NUTS 2 level), 2012.PNG
(
file
)
71 KB
1
15:03, 5 June 2014
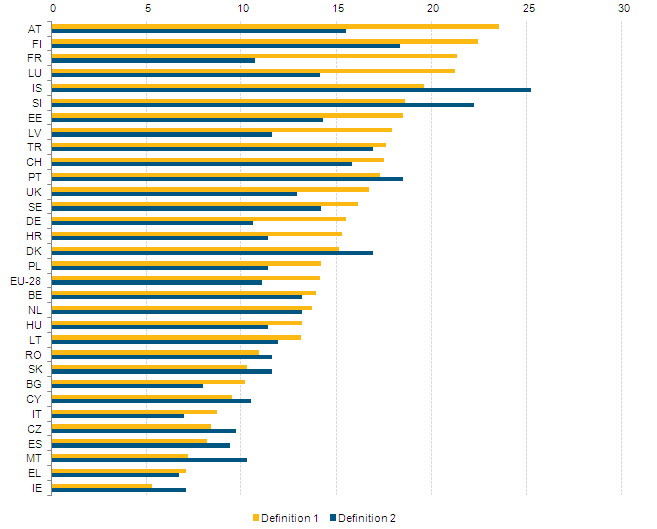
People with disabilities, by disability definition, 2011 (%).PNG
(
file
)
16 KB
1
15:21, 5 June 2014
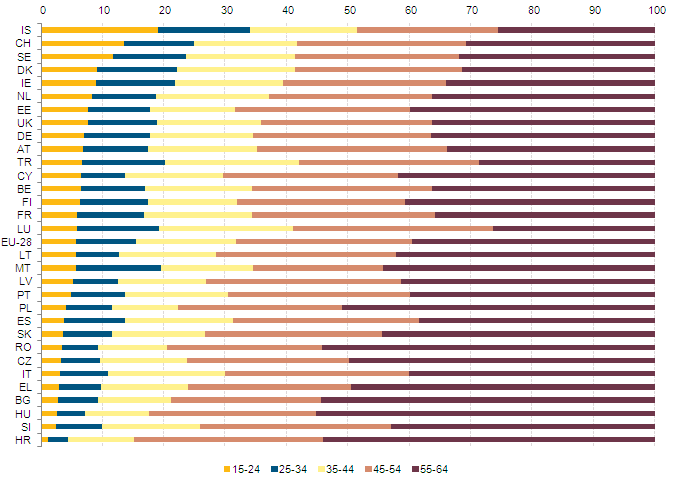
People with a basic activity difficulty (Definition 1), by of age group, 2011 (%).PNG
(
file
)
16 KB
1
14:11, 6 June 2014
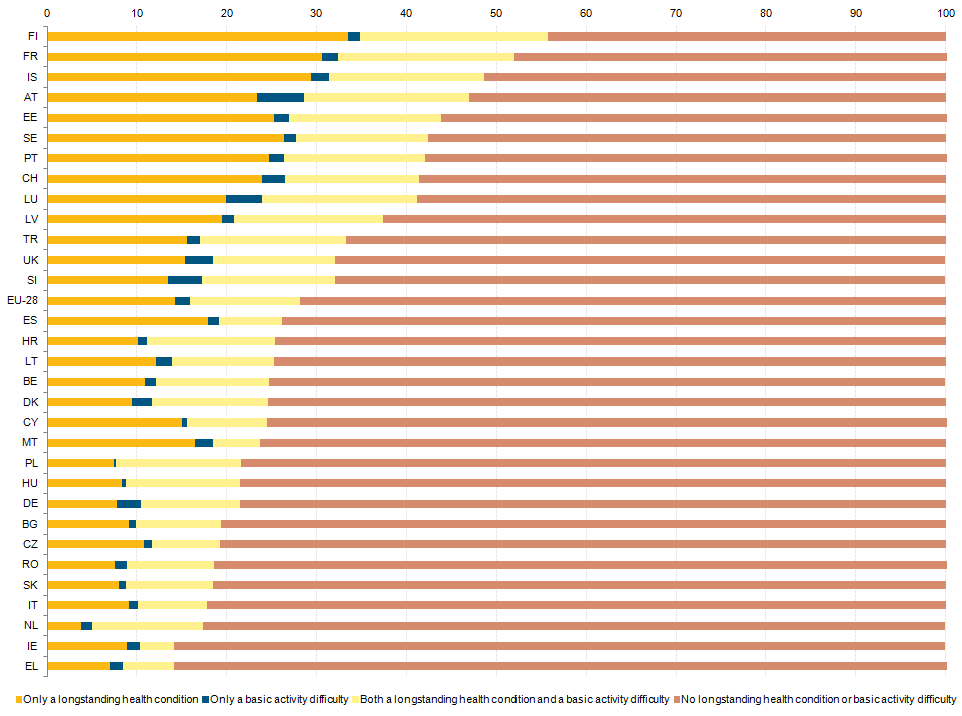
Distribution of people aged 15-64 reporting a longstanding health problem or a basic activity difficulty, 2011 (%).PNG
(
file
)
34 KB
1
14:11, 6 June 2014
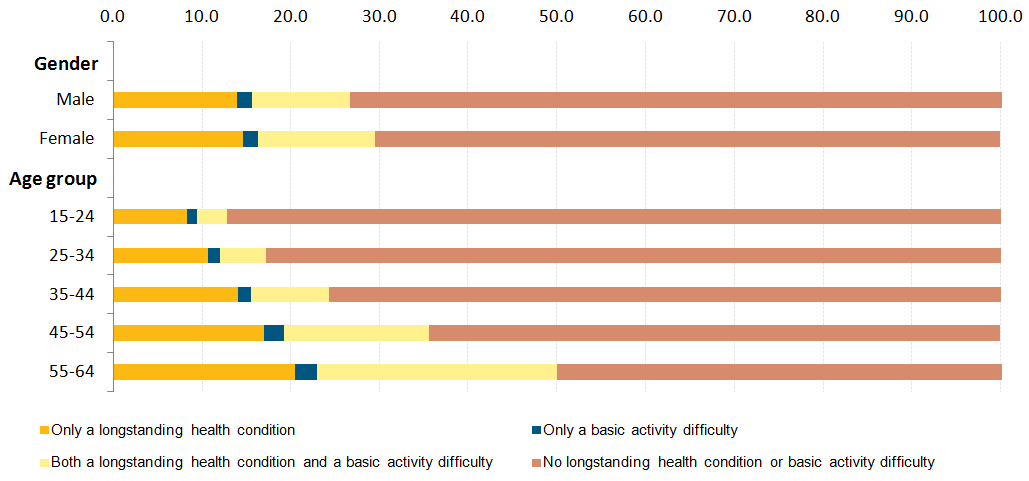
Distribution of people aged 15-64 reporting a longstanding health problem or a basic activity difficulty, by sex and age group, 2011 (%) .PNG
(
file
)
27 KB
1
14:12, 6 June 2014
Prevalence of longstanding health problems in people aged 15-64 in the EU, 2011 (number of cases per 100 people).PNG
(
file
)
38 KB
1
14:13, 6 June 2014
Prevalence of basic activity difficulties in people aged 15-64 in the EU, 2011 (number of cases per 100 people).PNG
(
file
)
26 KB
1
16:24, 10 June 2014
FIG1 grafcet LFS AHM 2011.png
(
file
)
14 KB
1
16:30, 10 June 2014
Workflow – the order in which participants were asked about variables.PNG
(
file
)
14 KB
1
10:23, 11 June 2014
FIG2 NR LFS AHM 2011 conditional CORE.png
(
file
)
21 KB
1
10:23, 11 June 2014
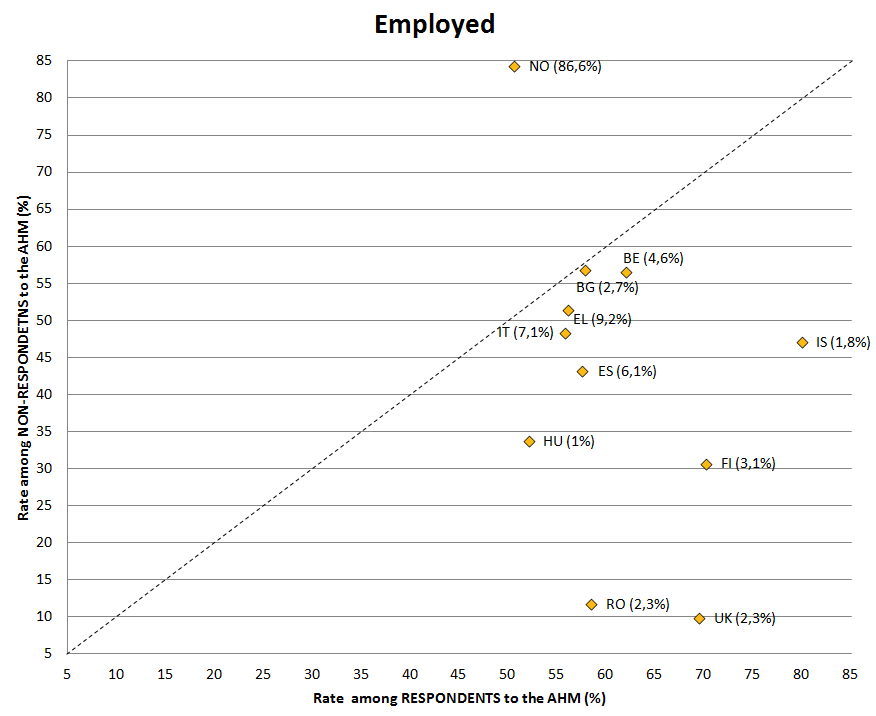
Comparison of employed people as a proportion of respondent and non-respondent groups, in %.PNG
(
file
)
35 KB
1
10:23, 11 June 2014
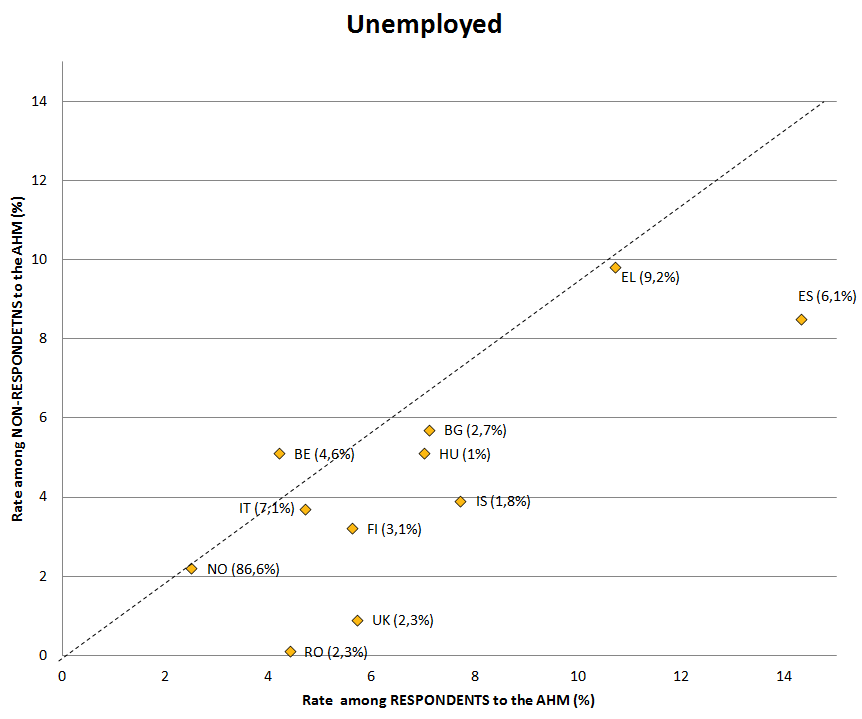
Comparison of unemployed people as a proportion of respondent and non-respondent groups, in %.PNG
(
file
)
33 KB
1
10:23, 11 June 2014
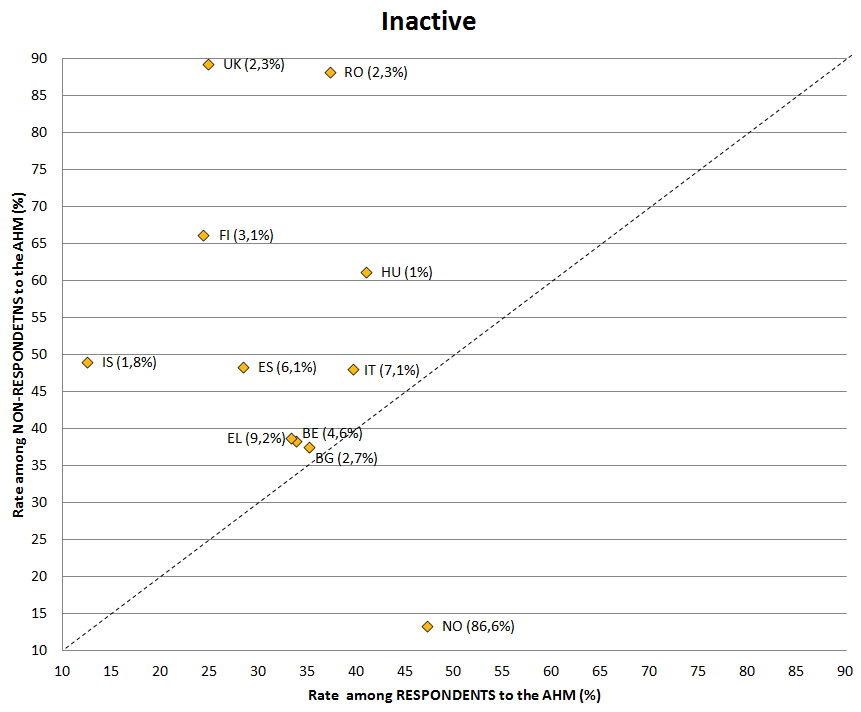
Comparison of economically inactive people as a proportion of respondent and non-respondent groups, in %.PNG
(
file
)
34 KB
1
10:25, 11 June 2014
FIG1 NR LFS AHM 2011 reported.png
(
file
)
25 KB
2
10:27, 11 June 2014
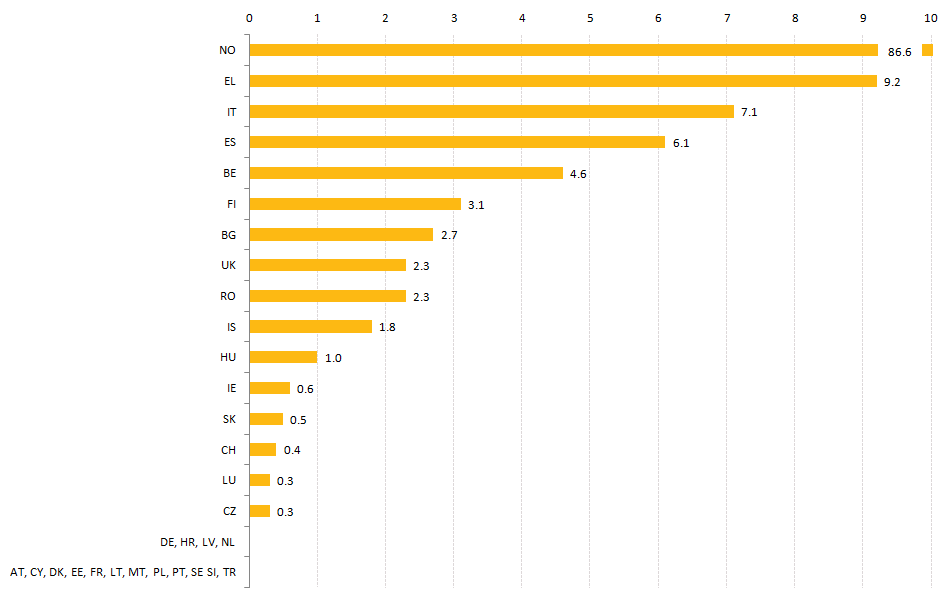
EU - Labour Force Survey non-response rate reported by participating countries, in %.PNG
(
file
)
21 KB
1
11:14, 11 June 2014
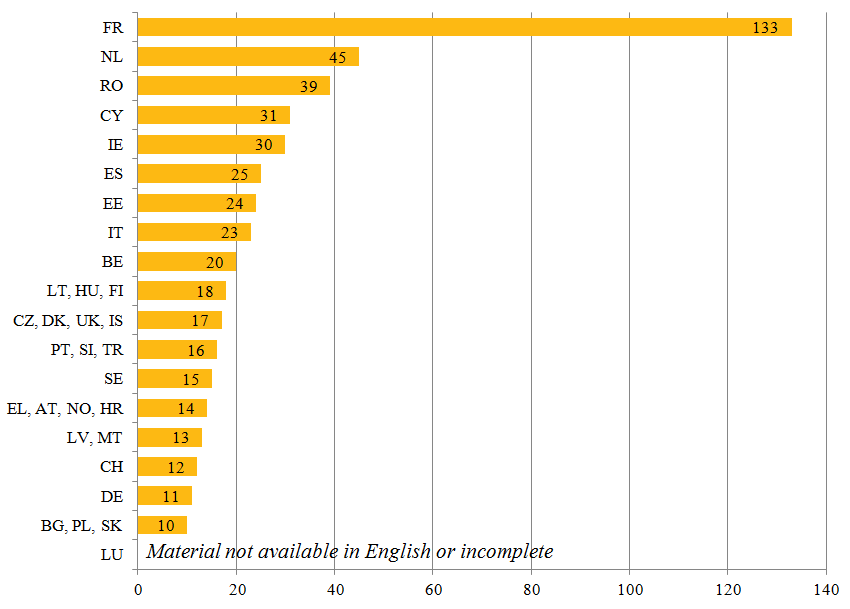
FIG1 national LFS AHM 2011 nb questions.PNG
(
file
)
30 KB
1
11:57, 11 June 2014
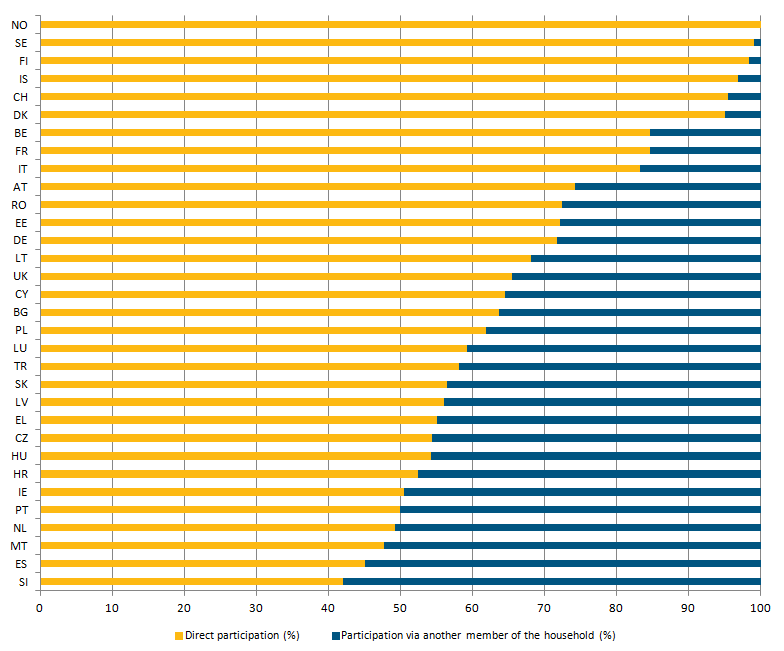
People who took part in the survey, directly or indirectly, in percentages.PNG
(
file
)
23 KB
1
11:57, 11 June 2014
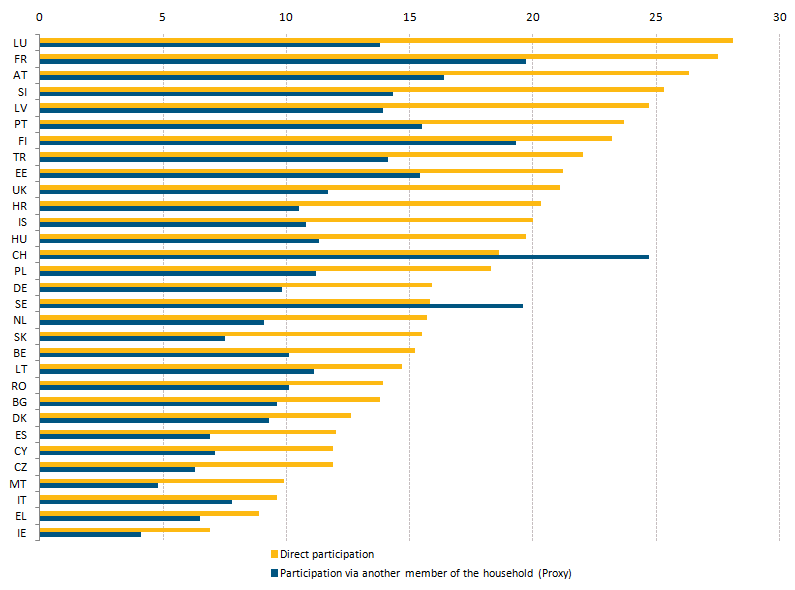
Proportions of males and females among people who participated directly and those included through another household member in the ad-hoc module.PNG
(
file
)
34 KB
1
11:58, 11 June 2014
People with a longstanding health problem, by type of participation in the survey, in percentages.PNG
(
file
)
19 KB
1
11:58, 11 June 2014
People who have difficulty in a basic activity (e.g. hearing, lifting, bending), by type of participation in the survey, in percentages.PNG
(
file
)
20 KB
1
11:58, 11 June 2014
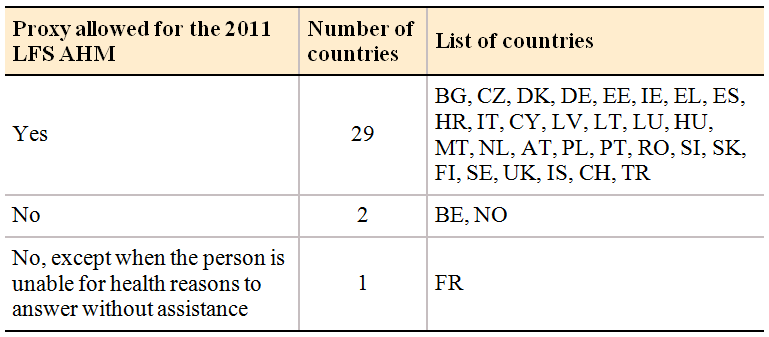
Countries that allowed another household member to take part in the ad-hoc module.PNG
(
file
)
24 KB
1
12:21, 26 August 2014
Fig1 - owner-occupied dwelling.JPG
(
file
)
97 KB
1
12:22, 26 August 2014
Fig2 - deprived of some housing items.JPG
(
file
)
48 KB
1
12:22, 26 August 2014
Fig3 - Overcrowding rate.JPG
(
file
)
52 KB
1
12:22, 26 August 2014
Fig4 - overcrowding rate elderly.JPG
(
file
)
55 KB
1
12:22, 26 August 2014
Fig5 - Housing cost overburden rate.JPG
(
file
)
68 KB
1
12:22, 26 August 2014
Fig6 - accessing of basic services.JPG
(
file
)
33 KB
1
15:33, 26 August 2014
Fig1 having difficulties to make ends meet.JPG
(
file
)
68 KB
1
15:33, 26 August 2014
Fig2 unable to afford paying for one week annual holiday away.JPG
(
file
)
57 KB
1
15:33, 26 August 2014
Fig3 unable to afford a meal with meat.JPG
(
file
)
50 KB
1
15:33, 26 August 2014
Fig4 unable to face financial expenses.JPG
(
file
)
61 KB
1
15:34, 26 August 2014
Tab1 Arrears.JPG
(
file
)
63 KB
1
16:02, 26 August 2014
The Europe-2020 indicator of at-risk-of-poverty or social exclusion (AROPE).JPG
(
file
)
15 KB
1
16:02, 26 August 2014
Fig2 At-risk-of-poverty rate.JPG
(
file
)
57 KB
1
16:03, 26 August 2014
Fig3 employed risk poverty.JPG
(
file
)
58 KB
1
First page
Previous page
Next page
Last page
Special page
ISSN 2443-8219


,_2010.PNG)


,_2012.PNG)
.PNG)
,_by_of_age_group,_2011_(%25).PNG)
.PNG)
_.PNG)
.PNG)
.PNG)


,_by_type_of_participation_in_the_survey,_in_percentages.PNG)


.JPG)

