Tutorials
Log in
Statistics Explained
menu
search
search
Navigation
Main page
Statistical themes
Glossary
Categories
Statistics 4 beginners
Tutorials
Help
Eurostat home
Education corner
Online publications
Regional yearbook
Sustainable development
Full list
Tools
User contributions
Logs
View user groups
Special pages
search
Navigation
Main page
Statistical themes
Glossary
Categories
Statistics 4 beginners
Tutorials
Help
Eurostat home
Education corner
Online publications
Regional yearbook
Sustainable development
Full list
Tools
User contributions
Logs
View user groups
Special pages
Navigation
Main page
Statistical themes
Glossary
Categories
Statistics 4 beginners
Tutorials
Help
Eurostat home
Education corner
Online publications
Regional yearbook
Sustainable development
Full list
Tools
User contributions
Logs
View user groups
Special pages
Uploads by Georgmd
This special page shows all uploaded files.
File list
Items per page:
20
50
100
250
500
Search for media name:
Username:
Include old versions of files
Go
First page
Previous page
Next page
Last page
Date
Name
Thumbnail
Size
Description
Versions
11:47, 12 March 2014
Trends in EGSS total output and breakdown by market , non-market and ancillary activities for EU28.png
(
file
)
16 KB
2
12:09, 12 March 2014
EGSS output (% of GDP) by type of activity (market, non-market, ancillary), latest available year.png
(
file
)
12 KB
1
12:13, 12 March 2014
EGSS output ( % of GDP ) by type of activity ( market, non-market, ancillary ), latest available year.png.png
(
file
)
12 KB
1
12:29, 12 March 2014
EGSS market output, latest available year (% of GDP).png
(
file
)
19 KB
2
12:52, 12 March 2014
EGSS market output (% of GDP) by environmental domain, latest available year.png
(
file
)
26 KB
1
12:59, 12 March 2014
EGSS output (mio EUR and % of total EGSS output) by environmental domain, Austria, year 2011.png
(
file
)
28 KB
1
15:22, 12 March 2014
EGSS output (mio EUR and % of total EGSS output) by environmental domain, the Netherlands, year 2010.png
(
file
)
27 KB
1
15:28, 12 March 2014
Trends in EGSS gross value added for EU28 (% of GDP).png
(
file
)
6 KB
1
15:33, 12 March 2014
EGSS value added (mio EUR) by category, Romania, year 2010.png
(
file
)
18 KB
1
15:38, 12 March 2014
EGSS employment for EU28 (1000 full-time equivalents).png
(
file
)
17 KB
1
15:46, 12 March 2014
EGSS employment by environmental domain, France, year 2011 (1000 full-time equivalents).png
(
file
)
23 KB
1
15:50, 12 March 2014
EGSS exports by environmental domain, Sweden, year 2011 (mio EUR).png
(
file
)
24 KB
1
15:52, 12 March 2014
EGSS exports by environmental domain, Germany, year 2010 (mio EUR).png
(
file
)
18 KB
1
18:39, 13 March 2014
EGSS output ( % of GDP ) by type of activity ( market, non-market, ancillary ), latest available year.png
(
file
)
31 KB
3
18:40, 13 March 2014
EGSS output by type of activity (market, non market, ancillary), latest available year (% of GDP).png
(
file
)
31 KB
1
18:43, 13 March 2014
Trends in environmental protection and resource management output for EU28 (year 2000=100).png
(
file
)
23 KB
2
12:03, 14 March 2014
4-EGSS market output latest available year (% of GDP) v2.png
(
file
)
37 KB
1
12:04, 14 March 2014
5-EGSS market output by environmental domain, latest available year (% of GDP) v2.png
(
file
)
43 KB
1
12:05, 14 March 2014
6-EGSS output by environmental domain, Austria, year 2011 (mio EUR and % of total EGSS output) v2.png
(
file
)
39 KB
1
12:11, 14 March 2014
7-EGSS output by environmental domain, the Netherlands, year 2010 (mio EUR and % of total EGSS output) v2.png
(
file
)
42 KB
1
12:12, 14 March 2014
8-Trends in EGSS gross value added for EU28 (% of GDP) v2.png
(
file
)
14 KB
1
12:12, 14 March 2014
9-EGSS GVA by category, RO, year 2010 (mio EUR and % of total EGSS GVA).png
(
file
)
41 KB
1
12:13, 14 March 2014
10-EGSS employment for EU28 (1000 FTE) v2.png
(
file
)
34 KB
1
12:14, 14 March 2014
11-EGSS employment by environmental domain, FR, year 2011(1000 FTE and % of total EGSS employment) v2.png
(
file
)
39 KB
1
12:14, 14 March 2014
12-EGSS exports by environmental domain, SE, year 2011 (mio EUR and % of total EGSS exports) v2.png
(
file
)
44 KB
1
12:15, 14 March 2014
13-EGSS exports by environmental domain, DE, year 2010 (mio EUR and % of total EGSS exports) v2.png
(
file
)
36 KB
1
18:18, 18 March 2014
1-Trends in EGSS total output.png
(
file
)
262 bytes
1
18:22, 18 March 2014
Trends in EGSS total output and breakdown by market, non-market and ancillary activities for EU28 v2.png
(
file
)
262 bytes
1
18:29, 18 March 2014
1-Trends in EGSS total output and breakdown by market, non-market and ancillary activities for EU28.png
(
file
)
262 bytes
2
18:34, 18 March 2014
Trends in EGSS total output and breakdown by market, non-market and ancillary activities for EU28 v3.png
(
file
)
262 bytes
Reverted to version as of 16:24, 18 March 2014
4
11:32, 19 March 2014
Figure 1 - Trends in EGSS total output and breakdown by market, non-market and ancillary activities for EU28.png
(
file
)
262 bytes
1
11:36, 19 March 2014
Figure 1 - Trends in EGSS total output and bk by market, non-market and ancillary activities for EU28.png
(
file
)
262 bytes
2
11:37, 19 March 2014
Trends in EGSS total output and bk by market, non-market and ancillary activities for EU28.png
(
file
)
262 bytes
1
16:59, 20 March 2014
Trends in EGSS output.png
(
file
)
17 KB
Reverted to version as of 10:05, 19 March 2014
3
17:00, 20 March 2014
Trends in EGSS output v2.png
(
file
)
9 KB
1
17:05, 20 March 2014
Trends in environmental protection and resource management output for EU28 (year 2000=100) v2.png
(
file
)
23 KB
Reverted to version as of 16:44, 13 March 2014
3
16:32, 10 April 2014
Total environmental tax revenue by type of tax, EU-28, 2012.png
(
file
)
11 KB
2
16:35, 10 April 2014
Figure 1 Total environmental tax revenue by type of tax, EU-28, 2002-2012 (EUR 1 000 million).png
(
file
)
21 KB
1
16:43, 10 April 2014
Figure 2 Total environmental tax revenue, EU-28, 2002-2012 (%).png
(
file
)
13 KB
1
16:46, 10 April 2014
Figure 3 Environmental taxes as % of GDP and as % of total taxes and social contributions, 2012.png
(
file
)
16 KB
1
16:50, 10 April 2014
Figure 4 Environmental taxes by tax category, 2012 (% of total environmental taxes).png
(
file
)
20 KB
1
16:53, 10 April 2014
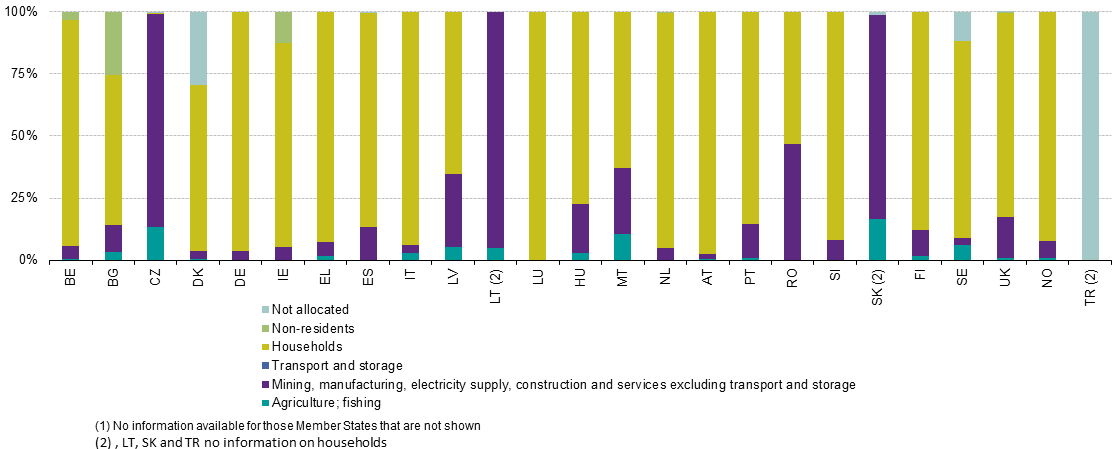
Figure 5 Energy taxes by economic activity, 2011 (1) (% of energy tax revenue).png
(
file
)
28 KB
1
16:55, 10 April 2014
Figure 6 Transport taxes by economic activity, 2011 (1) (% of transport tax revenue).png
(
file
)
33 KB
1
16:56, 10 April 2014
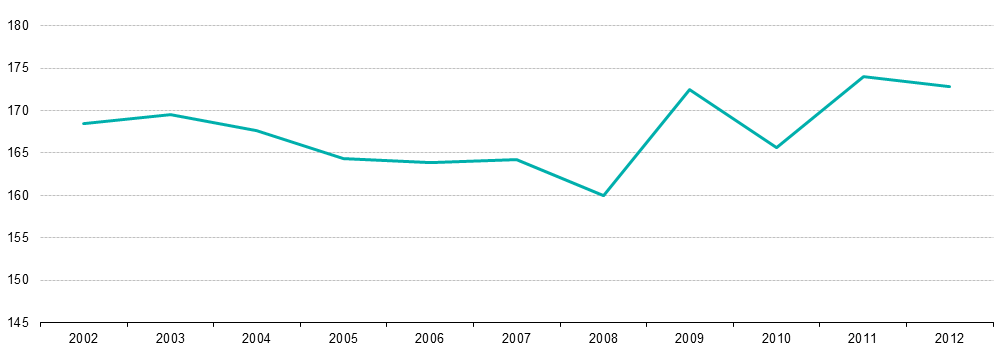
Figure 7 Implicit tax rate on energy (deflated), EU-28.png
(
file
)
16 KB
1
17:38, 10 April 2014
Environmental taxes data figures tables 2014.xlsx
(
file
)
88 KB
1
17:48, 10 April 2014
EGSS graphs for SE 10.04.2014.xlsx
(
file
)
918 KB
1
16:56, 11 April 2014
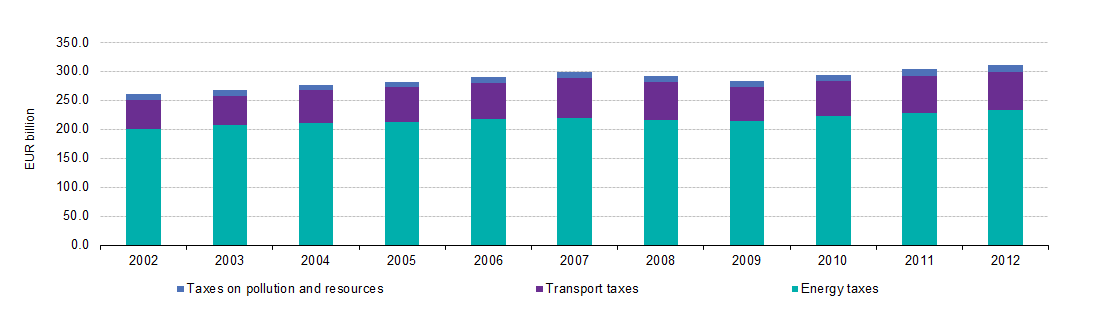
Figure 1 Total environmental tax revenue by type of tax, EU-28, 2002-2012 (EUR billion).png
(
file
)
7 KB
1
17:03, 11 April 2014
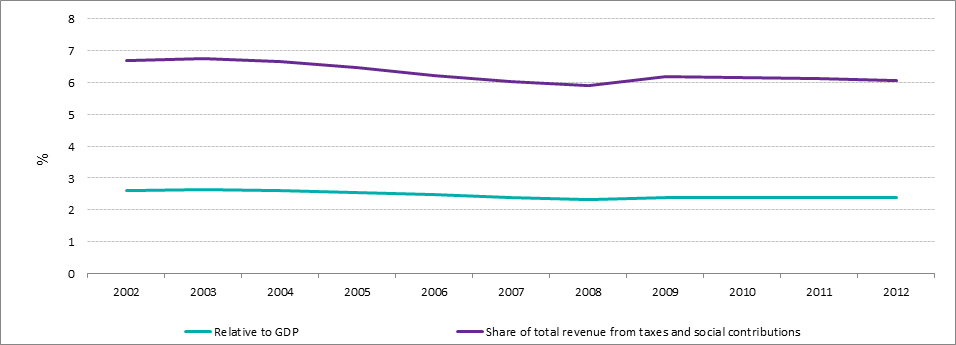
Figure 2 Total environmental tax revenue, EU-28, 2002–2012 (%).png
(
file
)
13 KB
1
17:05, 11 April 2014
Figure 3 Environmental taxes as % of GDP and as % of total taxes and social contributions, 2012 2.png
(
file
)
15 KB
1
17:07, 11 April 2014
Figure 7 Implicit tax rate on energy (deflated), EU-28 2.png
(
file
)
16 KB
1
First page
Previous page
Next page
Last page
Special page
ISSN 2443-8219

_by_type_of_activity_(market,_non-market,_ancillary),_latest_available_year.png)
_by_type_of_activity_(_market,_non-market,_ancillary_),_latest_available_year.png.png)
.png)
_by_environmental_domain,_latest_available_year.png)
_by_environmental_domain,_Austria,_year_2011.png)
_by_environmental_domain,_the_Netherlands,_year_2010.png)
.png)
_by_category,_Romania,_year_2010.png)
.png)
.png)
.png)
.png)
_by_type_of_activity_(_market,_non-market,_ancillary_),_latest_available_year.png)
,_latest_available_year_(%25_of_GDP).png)
.png)
_v2.png)
_v2.png)
_v2.png)
_v2.png)
_v2.png)
.png)
_v2.png)
_v2.png)
_v2.png)
_v2.png)


_v2.png)
.png)
.png)

.png)
_(%25_of_energy_tax_revenue).png)
_(%25_of_transport_tax_revenue).png)
,_EU-28.png)
.png)
.png)

,_EU-28_2.png)