Tutorials
Log in
Statistics Explained
menu
search
search
Navigation
Main page
Statistical themes
Glossary
Categories
Statistics 4 beginners
Tutorials
Help
Eurostat home
Education corner
Online publications
Regional yearbook
Sustainable development
Full list
Tools
User contributions
Logs
View user groups
Special pages
search
Navigation
Main page
Statistical themes
Glossary
Categories
Statistics 4 beginners
Tutorials
Help
Eurostat home
Education corner
Online publications
Regional yearbook
Sustainable development
Full list
Tools
User contributions
Logs
View user groups
Special pages
Navigation
Main page
Statistical themes
Glossary
Categories
Statistics 4 beginners
Tutorials
Help
Eurostat home
Education corner
Online publications
Regional yearbook
Sustainable development
Full list
Tools
User contributions
Logs
View user groups
Special pages
Uploads by Fortiro
This special page shows all uploaded files.
File list
Items per page:
20
50
100
250
500
Search for media name:
Username:
Include old versions of files
Go
First page
Previous page
Next page
Last page
Date
Name
Thumbnail
Size
Description
Versions
18:43, 27 February 2014
Percentage change in real agricultural income per worker in 2013 compared to 2005.png
(
file
)
30 KB
1
18:50, 27 February 2014
Percentage change in real agricultural income per worker in 2013 compared to 2012 .png
(
file
)
29 KB
1
15:02, 3 March 2014
Agricultural income per worker.xls
(
file
)
270 KB
1
15:08, 25 September 2014
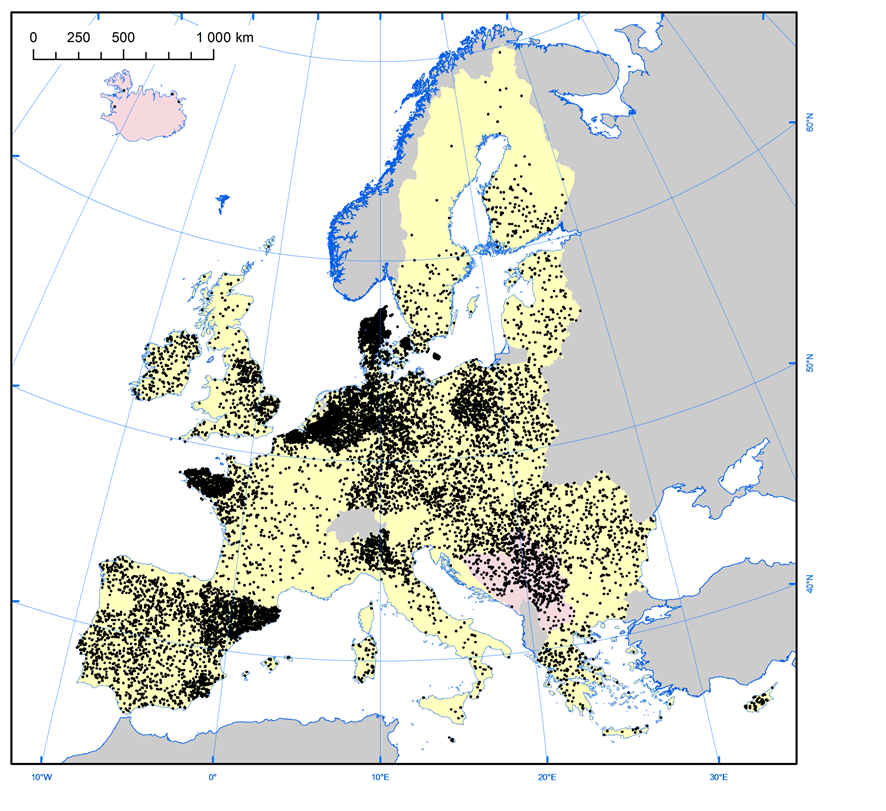
Number of sows by region (2013).png
(
file
)
415 KB
1
15:28, 25 September 2014
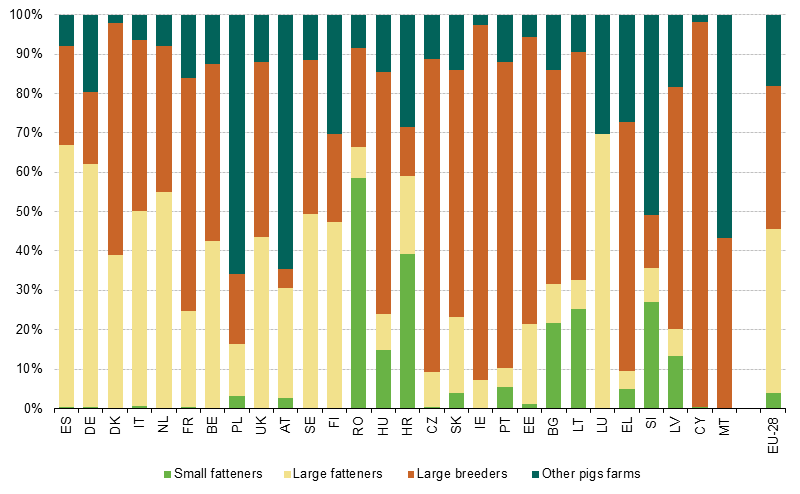
Distribution of pigs and farms by type of pig rearing (FSS 2010).png
(
file
)
14 KB
1
16:24, 25 September 2014
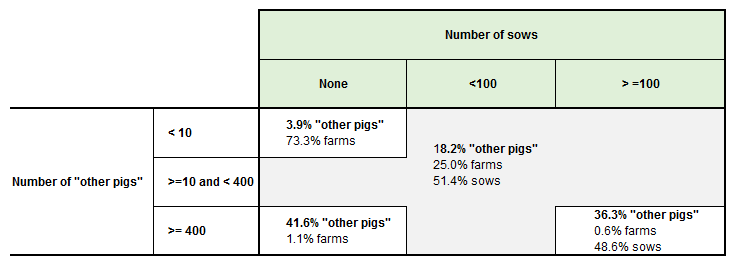
Distribution of other pigs by type of pig farm (FSS 2010).png
(
file
)
34 KB
1
16:31, 25 September 2014
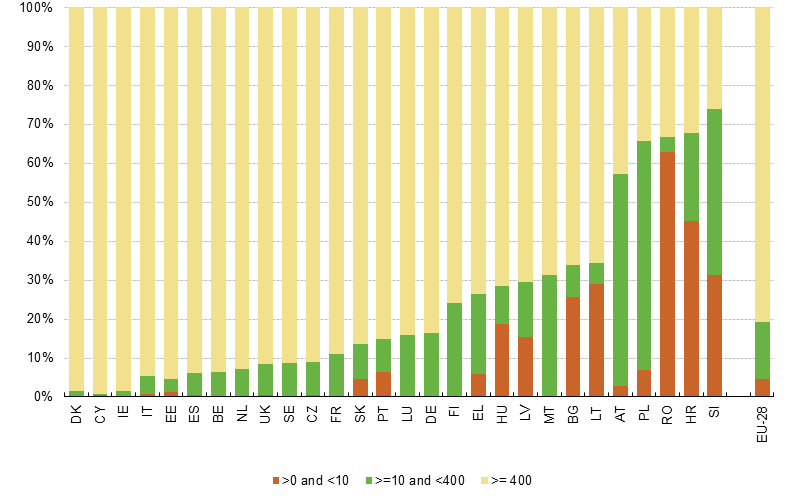
Distribution of numbers of other pigs by herd size (FSS 2010).png
(
file
)
31 KB
1
16:36, 25 September 2014
Distribution of the sows by herd size in EU-15 and 13 new Member States (FSS 2010).png
(
file
)
20 KB
1
16:38, 25 September 2014
Net exchanges of piglets, 2013 .png
(
file
)
64 KB
1
16:42, 25 September 2014
Net exchanges of pigs for slaughtering, 2013.png
(
file
)
65 KB
1
16:55, 25 September 2014
Pig population (EU-28), 2013.png
(
file
)
32 KB
1
16:57, 25 September 2014
Change in the number of sows and piglets - In EU-15 and EU-28, December surveys.png
(
file
)
26 KB
1
17:01, 25 September 2014
Change in the numbers of sows between 2007 to 2010 (FSS) in BG, CZ, DK, IE, EL, ES, IT, CY, LT, HU, RO, SK, SE and UK.png
(
file
)
15 KB
1
17:02, 25 September 2014
Change in the numbers of sows between 2007 to 2010 (FSS) in HR and PL.png
(
file
)
14 KB
1
17:08, 25 September 2014
Change in the numbers of sows between 2007-2010 (FSS) in BE, DE, EE, FR, LV, LU, NL, AT, PT and FI .png
(
file
)
18 KB
1
17:09, 25 September 2014
Gross indigenous production (GIP) of pigmeat, quarterly data - Meat production forecast.png
(
file
)
76 KB
1
17:14, 25 September 2014
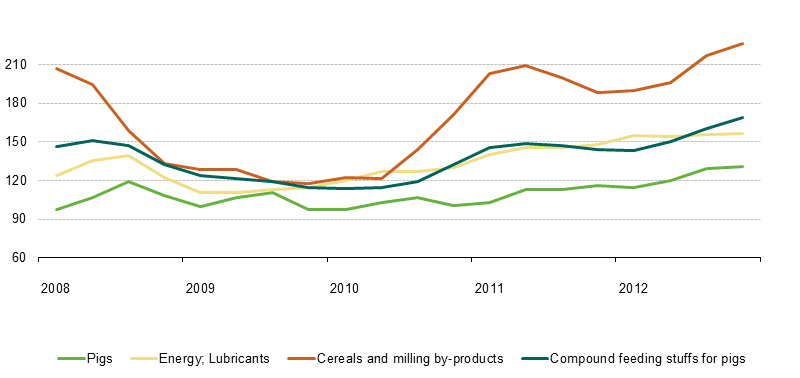
Price index of pigmeat, cereals, energy and compound feedstuff for pig (base 2005=100).png
(
file
)
22 KB
1
11:59, 29 September 2014
PIGS Tables and graph-V5.xlsx
(
file
)
1.39 MB
2
12:01, 29 September 2014
PIGS Tables and graph-V5.xls
(
file
)
1.39 MB
1
10:35, 10 October 2014
Table 6 Agricultural labour force Italy 2000 and 2010.PNG
(
file
)
16 KB
2
12:44, 12 February 2015
SAPM SE article.xls
(
file
)
56 KB
2
10:12, 6 March 2015
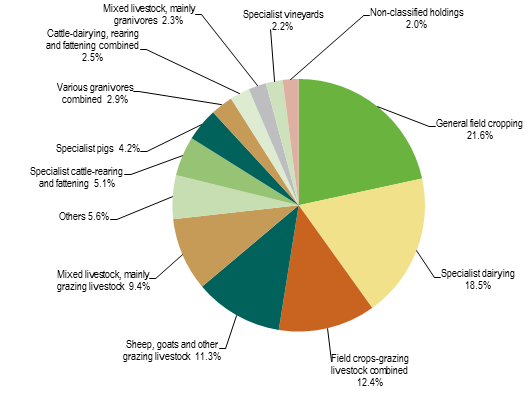
Number of holdings by main type of farming, Slovakia, 2010.png
(
file
)
26 KB
1
15:41, 6 March 2015
ESTAT-2015-Meat.xlsx
(
file
)
282 KB
1
13:29, 10 March 2015
Changes in livestock population, EU-28, index 2005 equal to 100 new.png
(
file
)
18 KB
2
13:31, 10 March 2015
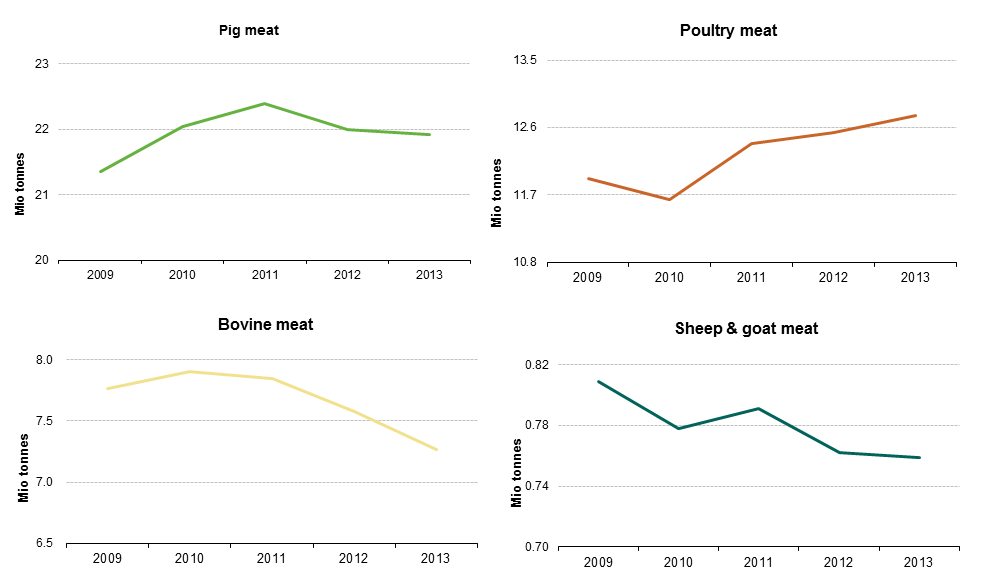
Meat production, by species, EU-28, 2009-2013 new.png
(
file
)
20 KB
2
13:32, 10 March 2015
Statistics on slaughtering, all species, 2013 new.png
(
file
)
50 KB
2
13:33, 10 March 2015
Other slaughtering, all species, 2013 new.png
(
file
)
33 KB
2
13:34, 10 March 2015
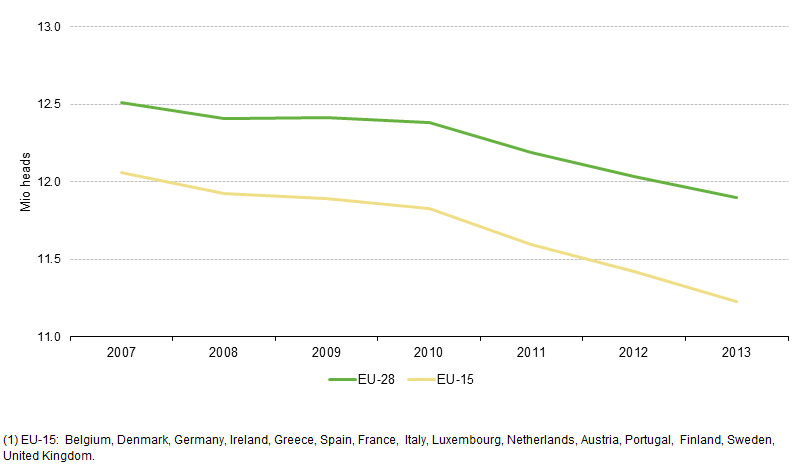
Changes in non-dairy cows, EU-28 and EU-15, 2007-2013 new.png
(
file
)
13 KB
2
13:35, 10 March 2015
Beef and veal production, 2009-2013, EU-28 new.png
(
file
)
9 KB
2
13:36, 10 March 2015
Gross indigenous production (GIP) forecast for bovine animals, EU-28 new.png
(
file
)
12 KB
2
13:37, 10 March 2015
Bovine livestock and its production cycle, 2013 new.png
(
file
)
36 KB
2
13:38, 10 March 2015
Livestock and slaughter in pig sector, 2006-2013 , EU-28 new.png
(
file
)
23 KB
2
13:40, 10 March 2015
Sheep livestock and its production cycle, 2013 new.png
(
file
)
22 KB
2
13:44, 10 March 2015
Distribution of sheep in EU-28, 2013 new.png
(
file
)
13 KB
4
13:46, 10 March 2015
Share of goatmeat by main European producers, 2009-2013 new.png
(
file
)
13 KB
2
13:47, 10 March 2015
Poultry meat production, by classes, 2013 new.png
(
file
)
25 KB
2
14:01, 10 March 2015
National ewe flocks by location and dairy share new.png
(
file
)
19 KB
3
14:04, 10 March 2015
ESTAT-2015-MeatProduction.xlsx
(
file
)
235 KB
1
17:52, 11 March 2015
AT SO SGM coefficients.xlsx
(
file
)
212 KB
1
17:54, 11 March 2015
BE SO SGM coefficients.xlsx
(
file
)
67 KB
1
17:55, 11 March 2015
BG SO SGM coefficients.xlsx
(
file
)
36 KB
1
17:56, 11 March 2015
CY SO SGM coefficients.xlsx
(
file
)
33 KB
1
17:57, 11 March 2015
CZ SO SGM coefficients.xlsx
(
file
)
36 KB
1
17:58, 11 March 2015
DE SO SGM coefficients.xlsx
(
file
)
903 KB
1
17:58, 11 March 2015
DK SO SGM coefficients.xlsx
(
file
)
93 KB
1
17:59, 11 March 2015
EE SO SGM coefficients.xlsx
(
file
)
30 KB
1
17:59, 11 March 2015
EL SO SGM coefficients.xlsx
(
file
)
317 KB
1
18:00, 11 March 2015
ES SO SGM coefficients.xlsx
(
file
)
565 KB
1
18:00, 11 March 2015
FI SO SGM coefficients.xlsx
(
file
)
137 KB
1
18:01, 11 March 2015
FR SO SGM coefficients.xlsx
(
file
)
746 KB
1
First page
Previous page
Next page
Last page
Special page
ISSN 2443-8219


.png)
.png)
.png)
.png)
.png)


,_2013.png)

_in_BG,_CZ,_DK,_IE,_EL,_ES,_IT,_CY,_LT,_HU,_RO,_SK,_SE_and_UK.png)
_in_HR_and_PL.png)
_in_BE,_DE,_EE,_FR,_LV,_LU,_NL,_AT,_PT_and_FI_.png)
_of_pigmeat,_quarterly_data_-_Meat_production_forecast.png)
.png)


_forecast_for_bovine_animals,_EU-28_new.png)


