Tutorials
Log in
Statistics Explained
menu
search
search
Navigation
Main page
Statistical themes
Glossary
Categories
Statistics 4 beginners
Tutorials
Help
Eurostat home
Education corner
Online publications
Regional yearbook
Sustainable development
Full list
Tools
User contributions
Logs
View user groups
Special pages
search
Navigation
Main page
Statistical themes
Glossary
Categories
Statistics 4 beginners
Tutorials
Help
Eurostat home
Education corner
Online publications
Regional yearbook
Sustainable development
Full list
Tools
User contributions
Logs
View user groups
Special pages
Navigation
Main page
Statistical themes
Glossary
Categories
Statistics 4 beginners
Tutorials
Help
Eurostat home
Education corner
Online publications
Regional yearbook
Sustainable development
Full list
Tools
User contributions
Logs
View user groups
Special pages
Uploads by F.ST
This special page shows all uploaded files.
File list
Items per page:
20
50
100
250
500
Search for media name:
Username:
Include old versions of files
Go
First page
Previous page
Next page
Last page
Date
Name
Thumbnail
Size
Description
Versions
14:06, 8 May 2013
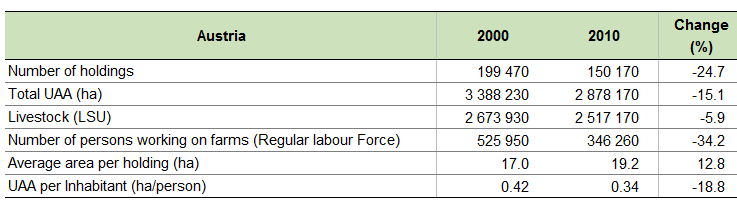
Table Farm Structure key indicators AT 2000 2010.PNG
(
file
)
15 KB
1
15:55, 10 May 2013
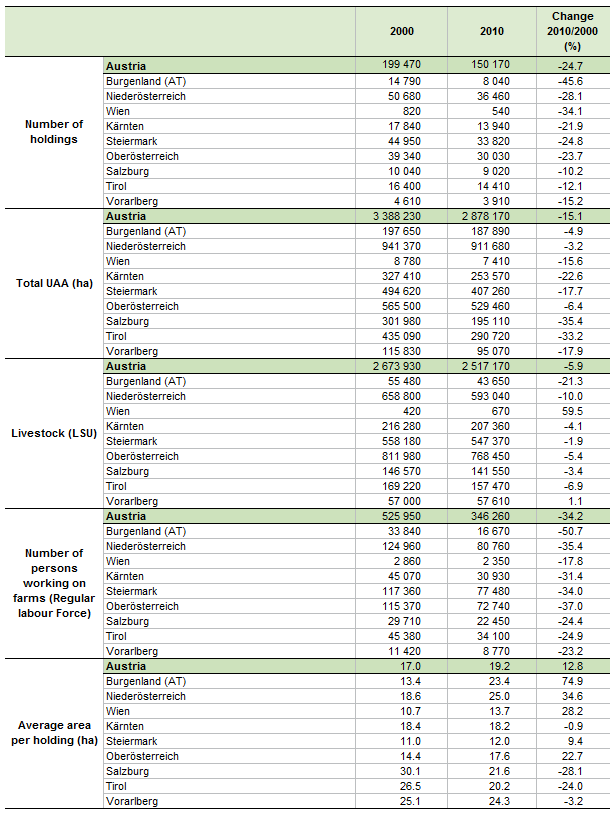
Table Farm structure key indicators by NUTS 2 regions AT 2000 and 2010.PNG
(
file
)
49 KB
3
16:07, 10 May 2013
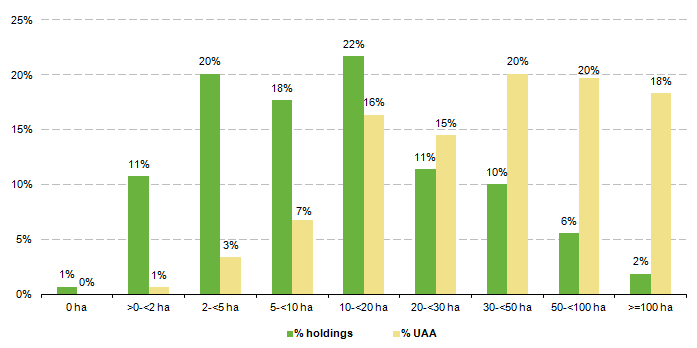
Figure Number of holdings and Utilised Agriculture Area (UAA) by UAA size classes AT 2010.PNG
(
file
)
16 KB
1
16:10, 10 May 2013
Figure 1 Number of holdings and Utilised Agriculture Area (UAA) by UAA size classes AT 2010.PNG
(
file
)
16 KB
1
16:12, 10 May 2013
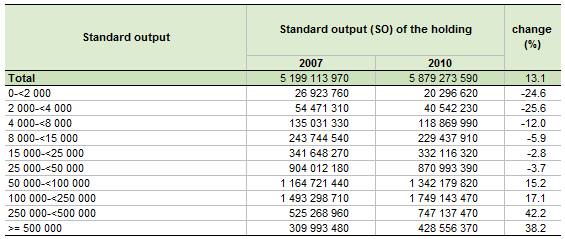
Table Economic size of the farm by standard output size classes AT 2007 and 2010.PNG
(
file
)
15 KB
1
16:22, 10 May 2013
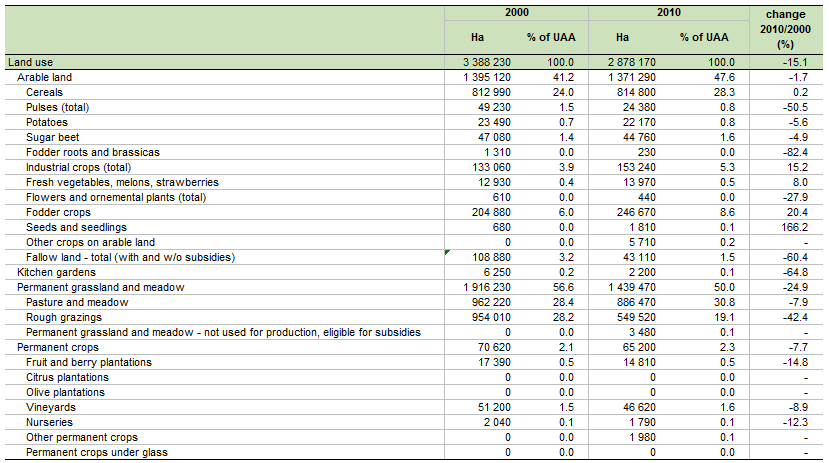
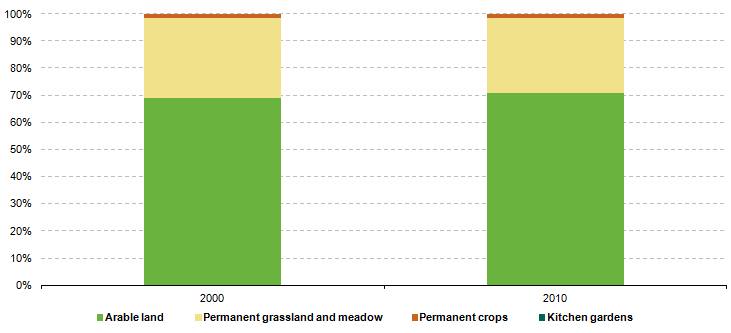
Table Utilised Agricultural Area by land use AT 2000 and 2010.PNG
(
file
)
42 KB
1
16:27, 10 May 2013
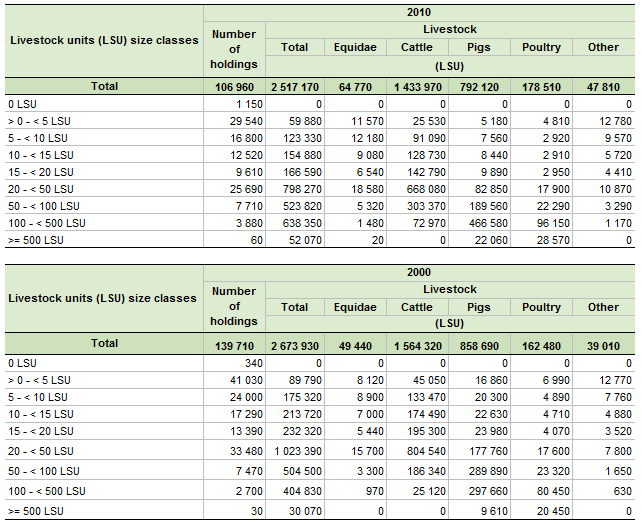
Table Number of holdings with livestock by LSU size class AT 2000 and 2010.PNG
(
file
)
39 KB
1
16:39, 10 May 2013
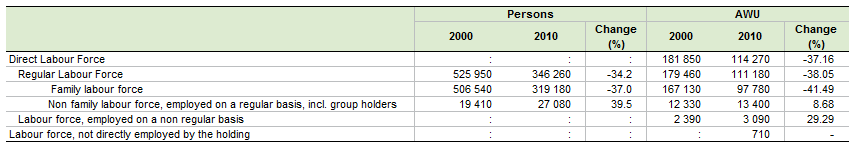
Table Agricultural labour force AT 2000 and 2010.PNG
(
file
)
14 KB
1
16:39, 10 May 2013
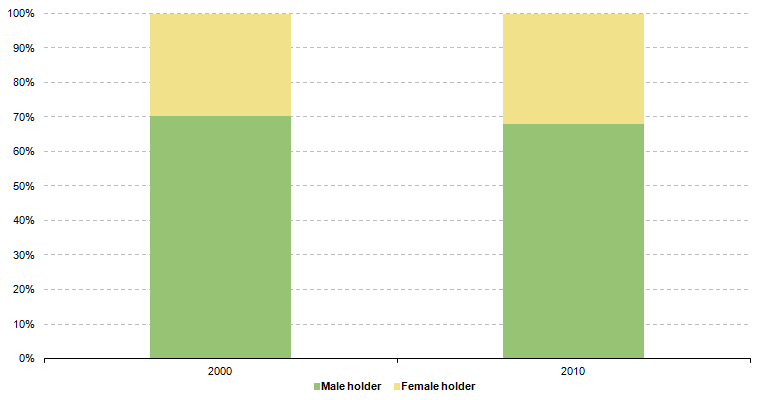
Figure Sole Holders by Gender AT 2000 and 2010.PNG
(
file
)
15 KB
1
16:40, 10 May 2013
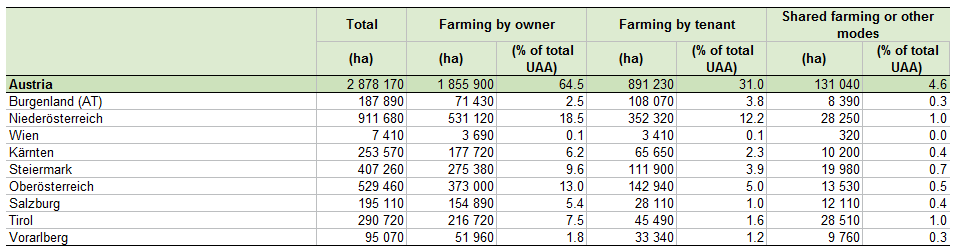
Table Utilised agricultural area by type of tenure by NUTS 2 regions AT 2010.PNG
(
file
)
25 KB
1
16:43, 10 May 2013
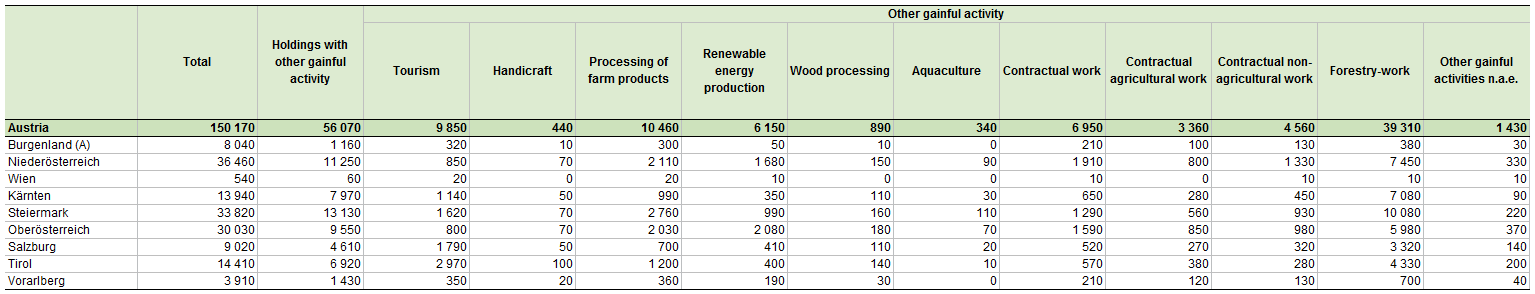
Table Number of holdings by other gainful activities by NUTS 2 regions AT 2010.PNG
(
file
)
40 KB
1
16:46, 10 May 2013
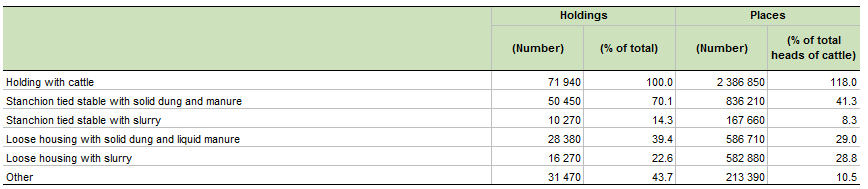
Table Number of holdings with cattle and places by type of animal housing AT 2010.PNG
(
file
)
14 KB
1
16:56, 10 May 2013
TAB5 1 LIVESTOCK AT.xls
(
file
)
47 KB
1
12:02, 13 May 2013
TAB3 1Economic size of the farm.xls
(
file
)
50 KB
1
13:14, 13 May 2013
TAB5 1Livestock.xls
(
file
)
47 KB
2
14:25, 13 May 2013
TAB LIVESTOCK AT.xls
(
file
)
60 KB
5
14:25, 13 May 2013
TAB LABOUR FORCE AT.xls
(
file
)
56 KB
3
14:26, 13 May 2013
TAB OGA AT 2000.xls
(
file
)
3.84 MB
4
14:36, 13 May 2013
TAB LABOUR FORCE 2 AT.xls
(
file
)
27 KB
8
10:51, 23 May 2013
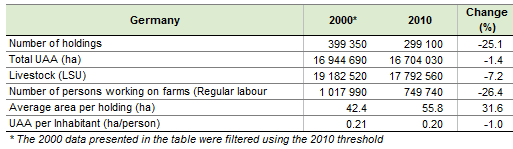
Table Farm Structure key indicators DE 2000 2010.PNG
(
file
)
11 KB
1
10:53, 23 May 2013
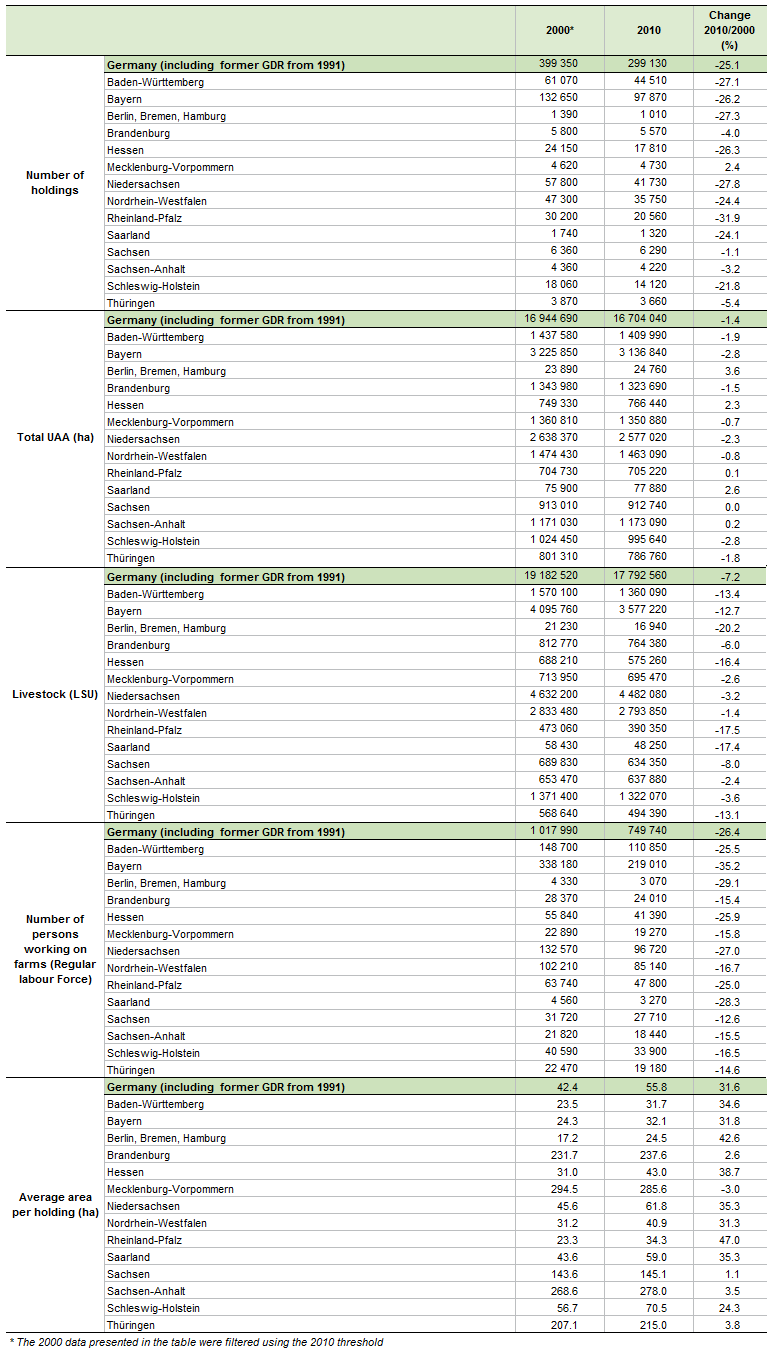
Table Farm structure key indicators by NUTS 2 regions DE 2000 and 2010.PNG
(
file
)
90 KB
1
11:03, 23 May 2013
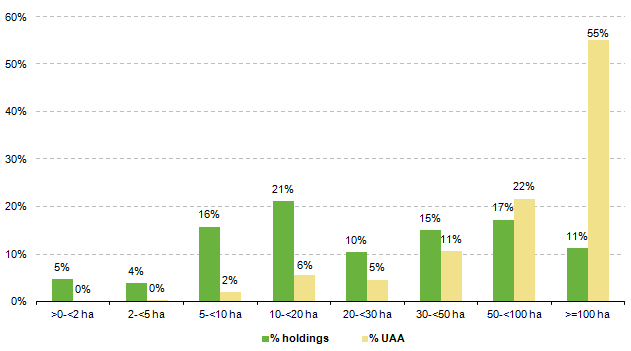
Figure Number of holdings and Utilised Agriculture Area (UAA) by UAA size classes DE 2010.PNG
(
file
)
12 KB
1
11:17, 23 May 2013
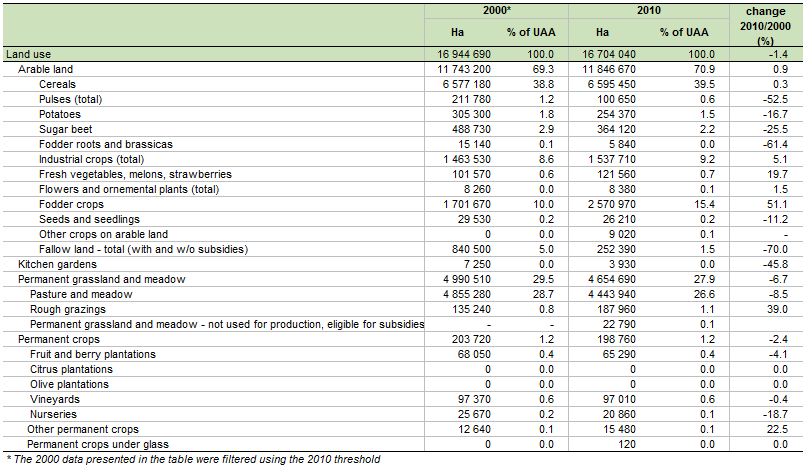
Table Utilised Agricultural Area by land use DE 2000 and 2010.PNG
(
file
)
43 KB
1
11:25, 23 May 2013
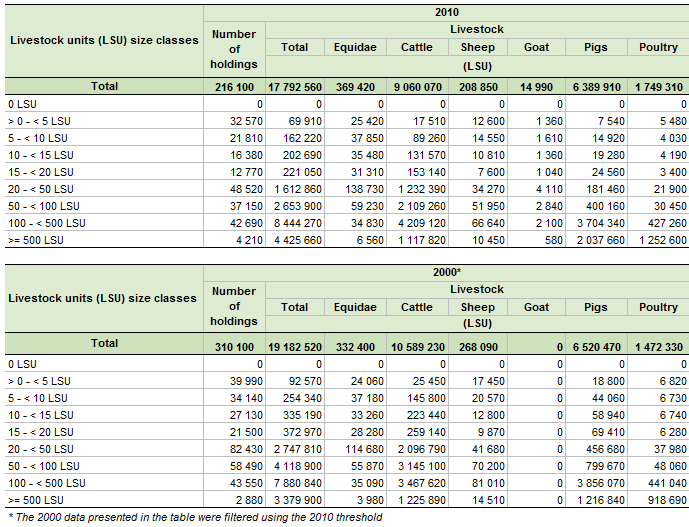
Table Number of holdings with livestock by LSU size class DE 2000 and 2010.PNG
(
file
)
44 KB
1
11:27, 23 May 2013
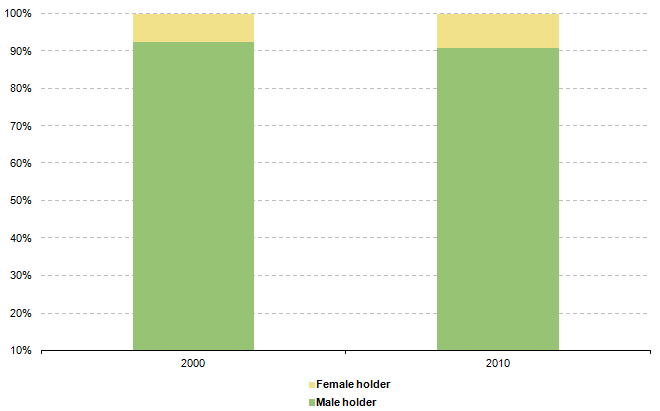
Figure Sole Holders by Gender DE 2000 and 2010.PNG
(
file
)
14 KB
1
11:40, 23 May 2013
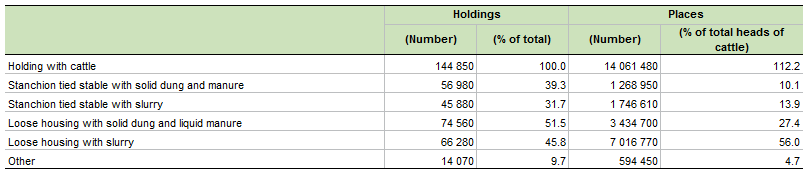
Table Number of holdings with cattle and places by type of animal housing DE 2010.PNG
(
file
)
14 KB
2
11:46, 23 May 2013
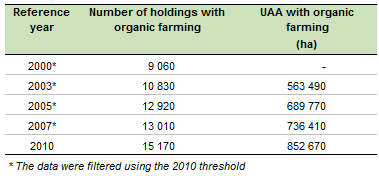
Table Organic farming number of holdings and utilised agricultural area DE 2010.PNG
(
file
)
7 KB
1
13:28, 23 May 2013
TAB OGA DE 2000.xls
(
file
)
3.84 MB
2
13:46, 23 May 2013
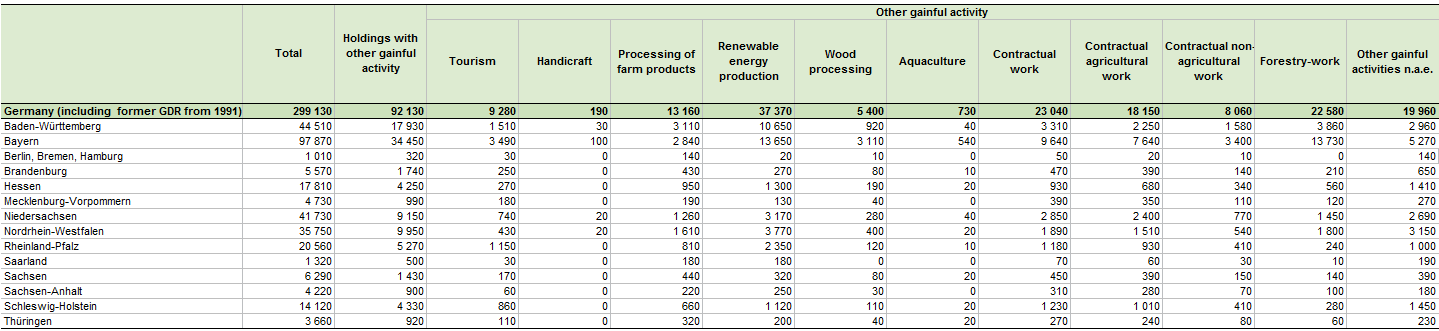
Table Number of holdings by other gainful activities by NUTS 2 regions DE 2010.PNG
(
file
)
45 KB
1
14:50, 23 May 2013
Figure Utilised Agricultural Area by land use AT 2000 and 2010.PNG
(
file
)
13 KB
2
14:53, 23 May 2013
Figure Utilised Agricultural Area by land use DE 2000 and 2010.PNG
(
file
)
13 KB
1
15:29, 23 May 2013
Table Economic size of the farm by standard output size classes DE 2007 and 2010.PNG
(
file
)
18 KB
1
14:18, 13 June 2013
Table 2.PNG
(
file
)
94 KB
5
14:38, 13 June 2013
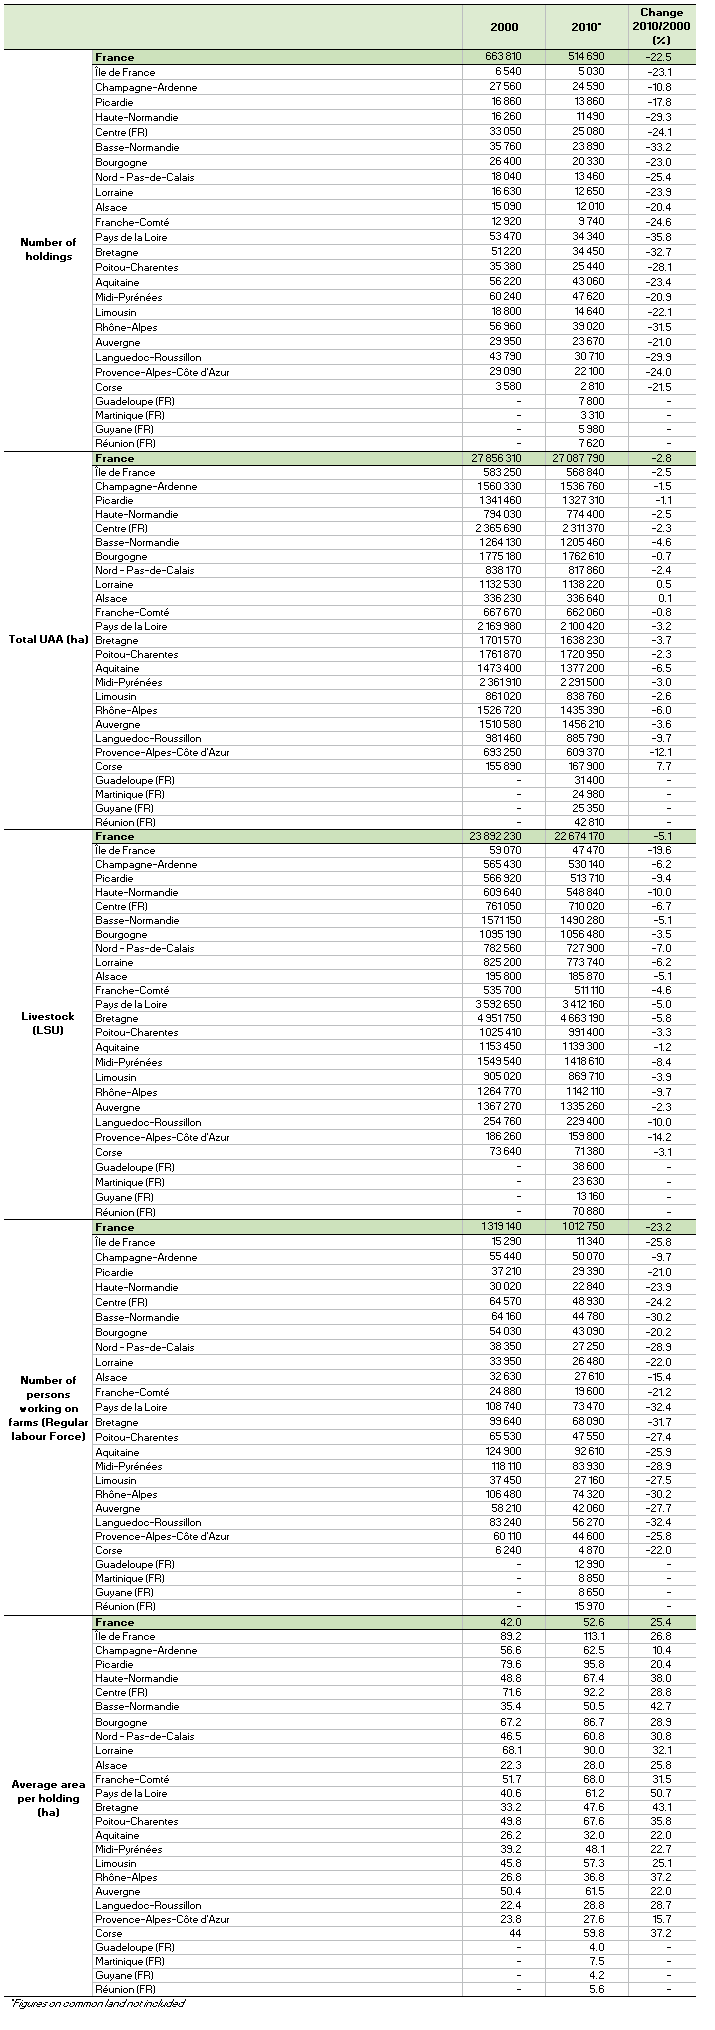
Table Farm structure key indicators by NUTS 2 regions FR 2000 and 2010.PNG
(
file
)
94 KB
3
14:45, 13 June 2013
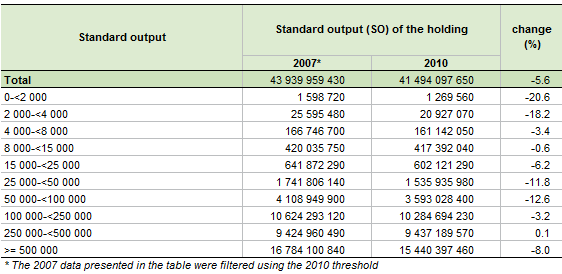
Table Economic size of the farm by standard output size classes FR 2007 and 2010.PNG
(
file
)
17 KB
2
14:57, 13 June 2013
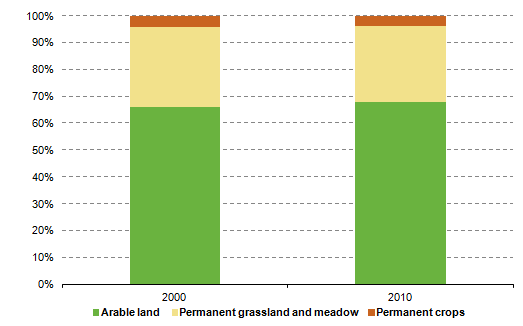
Figure Utilised Agricultural Area by land use FR 2000 and 2010.PNG
(
file
)
11 KB
1
14:59, 13 June 2013
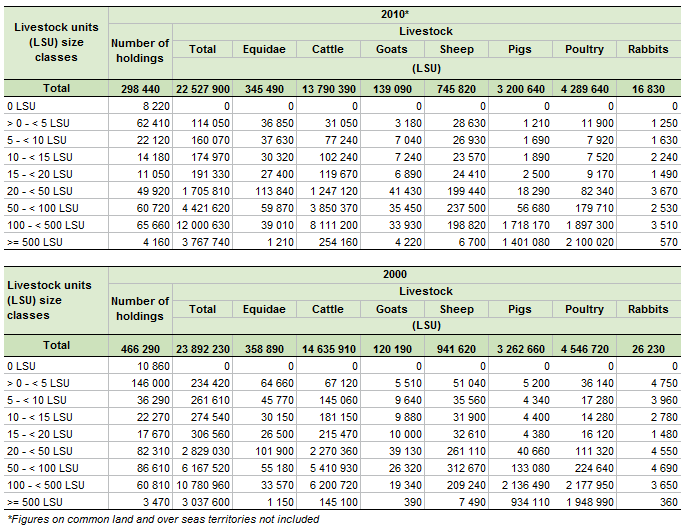
Table Number of holdings with livestock by LSU size class FR 2000 and 2010.PNG
(
file
)
47 KB
1
15:01, 13 June 2013
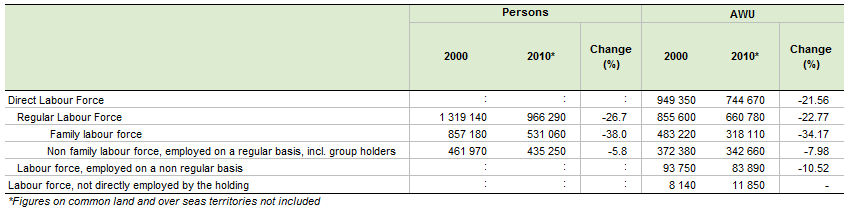
Table Agricultural labour force FR 2000 and 2010.PNG
(
file
)
18 KB
1
15:02, 13 June 2013
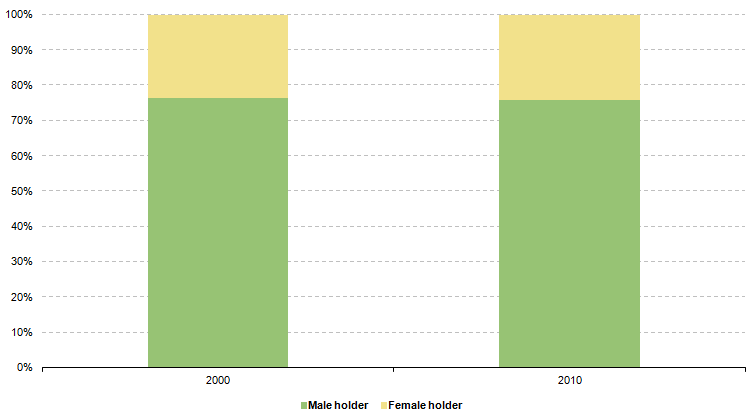
Figure Sole Holders by Gender FR 2000 and 2010.PNG
(
file
)
15 KB
1
15:03, 13 June 2013
Table Utilised agricultural area by type of tenure by NUTS 2 regions FR 2010.PNG
(
file
)
52 KB
1
15:06, 13 June 2013
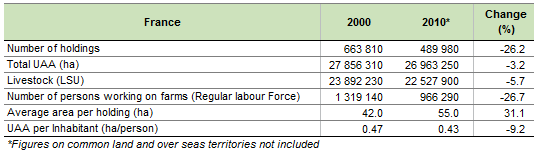
Table Farm Structure key indicators FR 2000 2010.PNG
(
file
)
11 KB
Reverted to version as of 12:43, 13 June 2013
6
15:13, 13 June 2013
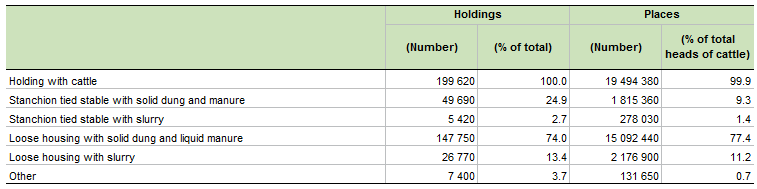
Table Number of holdings with cattle and places by type of animal housing FR 2010.PNG
(
file
)
14 KB
2
15:23, 13 June 2013
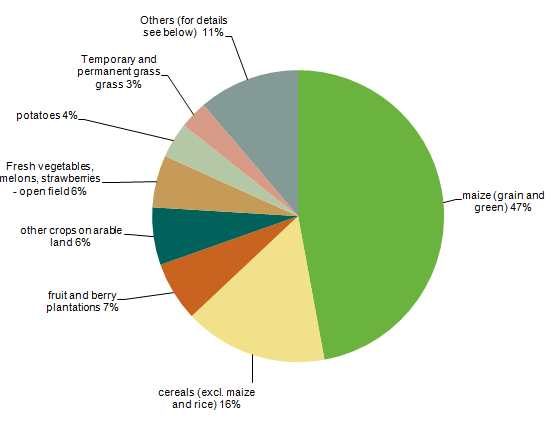
Figure Irrigated area by type of crops FR 2010.PNG
(
file
)
24 KB
1
15:27, 13 June 2013
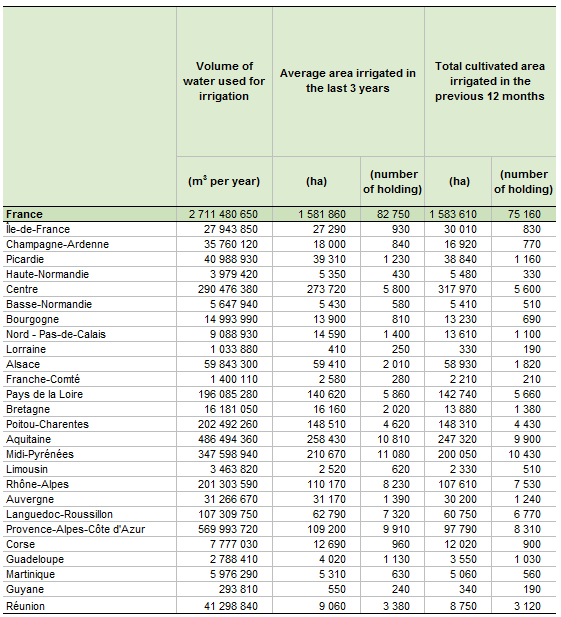
Table Key figures on irrigation FR 2010.PNG
(
file
)
44 KB
1
15:32, 13 June 2013
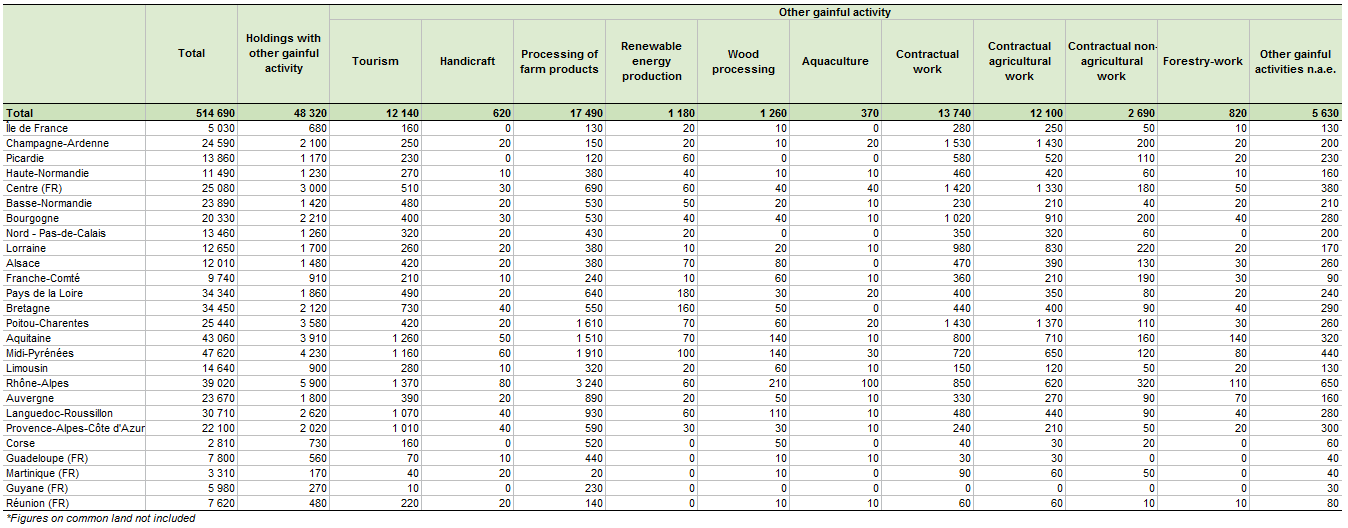
Table Number of holdings by other gainful activities by NUTS 2 regions FR 2010.PNG
(
file
)
67 KB
1
15:33, 13 June 2013
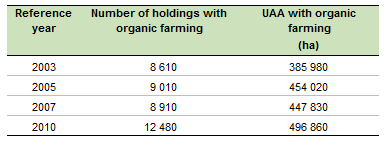
Table Organic farming number of holdings and utilised agricultural area FR 2010.PNG
(
file
)
5 KB
1
10:17, 24 June 2013
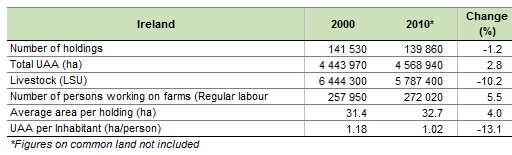
Table Farm Structure key indicators IE 2000 2010.PNG
(
file
)
11 KB
1
10:18, 24 June 2013
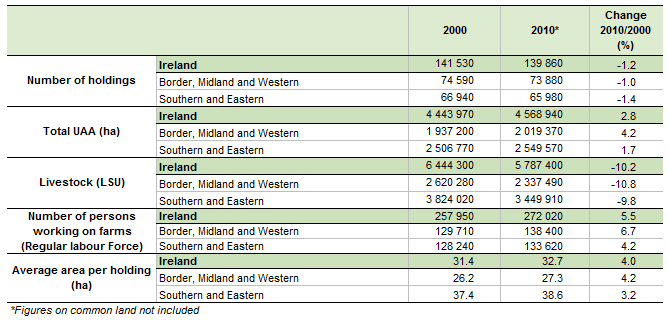
Table Farm structure key indicators by NUTS 2 regions IE 2000 and 2010.PNG
(
file
)
27 KB
1
10:21, 24 June 2013
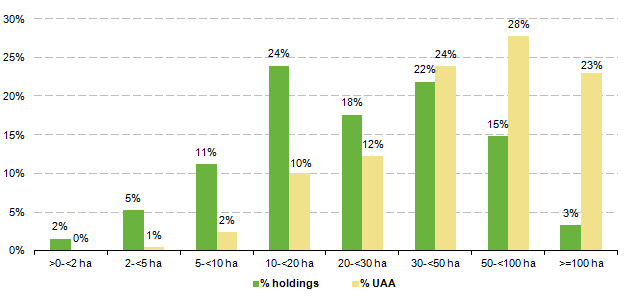
Figure Number of holdings and Utilised Agriculture Area (UAA) by UAA size classes IE 2010.PNG
(
file
)
12 KB
2
10:22, 24 June 2013
Table Economic size of the farm by standard output size classes IE 2007 and 2010.PNG
(
file
)
17 KB
1
First page
Previous page
Next page
Last page
Special page
ISSN 2443-8219


_by_UAA_size_classes_AT_2010.PNG)
_by_UAA_size_classes_AT_2010.PNG)


_by_UAA_size_classes_DE_2010.PNG)


_by_UAA_size_classes_IE_2010.PNG)
