Tutorials
Log in
Statistics Explained
menu
search
search
Navigation
Main page
Statistical themes
Glossary
Categories
Statistics 4 beginners
Tutorials
Help
Eurostat home
Education corner
Online publications
Regional yearbook
Sustainable development
Full list
Tools
User contributions
Logs
View user groups
Special pages
search
Navigation
Main page
Statistical themes
Glossary
Categories
Statistics 4 beginners
Tutorials
Help
Eurostat home
Education corner
Online publications
Regional yearbook
Sustainable development
Full list
Tools
User contributions
Logs
View user groups
Special pages
Navigation
Main page
Statistical themes
Glossary
Categories
Statistics 4 beginners
Tutorials
Help
Eurostat home
Education corner
Online publications
Regional yearbook
Sustainable development
Full list
Tools
User contributions
Logs
View user groups
Special pages
Uploads by Emmanuel.clement
This special page shows all uploaded files.
File list
Items per page:
20
50
100
250
500
Search for media name:
Username:
Include old versions of files
Go
First page
Previous page
Next page
Last page
Date
Name
Thumbnail
Size
Description
Versions
16:33, 11 October 2013
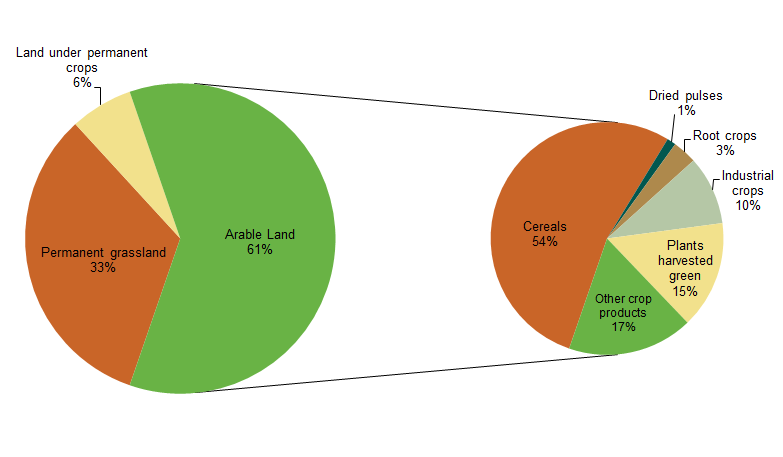
Fig.1 - Utilised Agricultural Area.png
(
file
)
27 KB
1
16:38, 11 October 2013
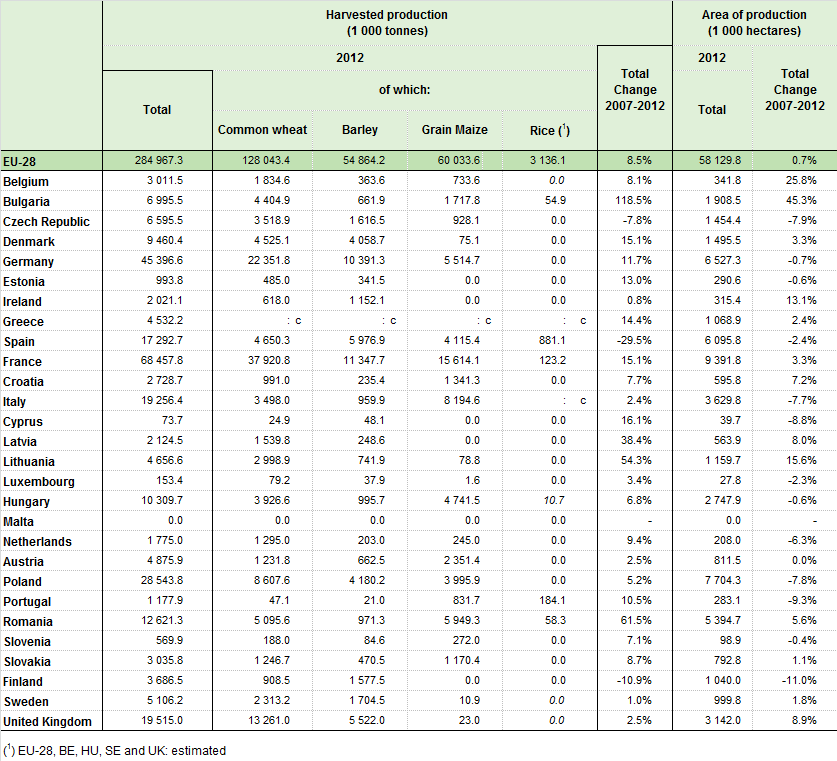
Tab.1 - Cereals (Prod. and Area).png
(
file
)
70 KB
1
16:39, 11 October 2013
Fig.2 - Cereals (EU-28).png
(
file
)
13 KB
1
16:44, 11 October 2013
Tab.2 - Root crops (Prod. and Area).png
(
file
)
80 KB
1
16:46, 11 October 2013
Fig.3 - Root crops (EU-28).png
(
file
)
23 KB
1
16:56, 11 October 2013
Tab.3 - Dried pulses (Prod. and Area).png
(
file
)
50 KB
1
17:00, 11 October 2013
Tab.4 - Oil seeds (Prod. and Area).png
(
file
)
66 KB
1
17:00, 11 October 2013
Fig.4 - Oil seeds (EU-28).png
(
file
)
16 KB
1
17:01, 11 October 2013
Tab.5 - Green Maize (Prod. and Area).png
(
file
)
51 KB
1
10:49, 14 October 2013
Tab.1-Slaughtering.jpg
(
file
)
429 KB
1
10:56, 14 October 2013
Fig.1-Livestock population.jpg
(
file
)
48 KB
1
10:57, 14 October 2013
Fig.2-Agricultural output.jpg
(
file
)
35 KB
1
10:59, 14 October 2013
Tab.2a- Farm structure (1).jpg
(
file
)
380 KB
1
11:00, 14 October 2013
Tab.2b- Farm structure (2).jpg
(
file
)
371 KB
1
15:26, 17 October 2013
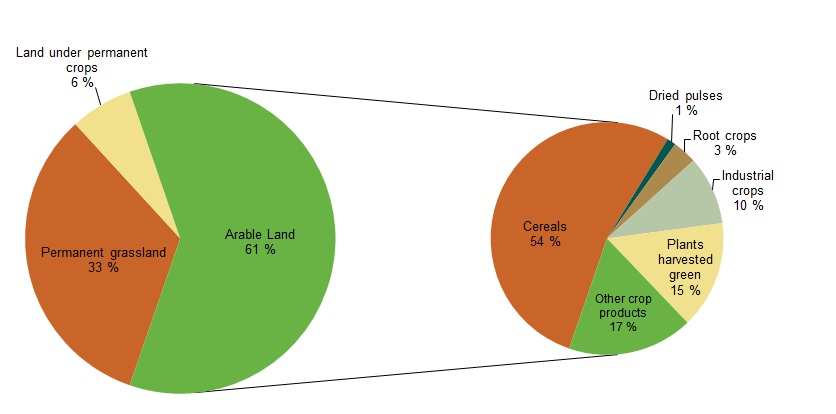
Utilised Agricultural Area (UAA), EU-28, 2011.jpg
(
file
)
46 KB
1
15:29, 17 October 2013
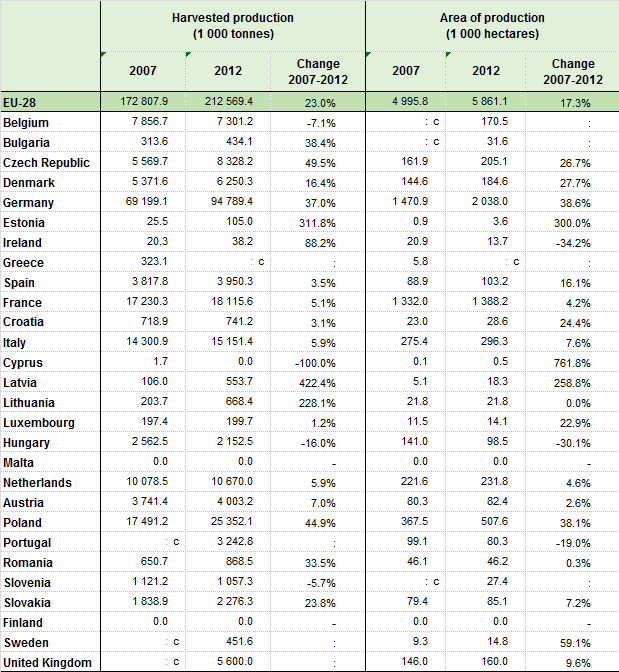
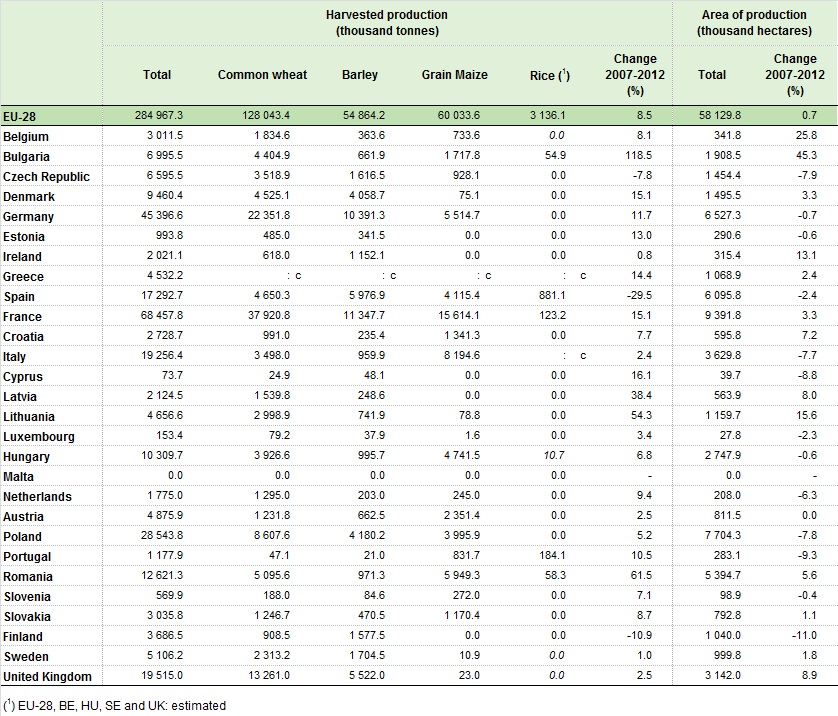
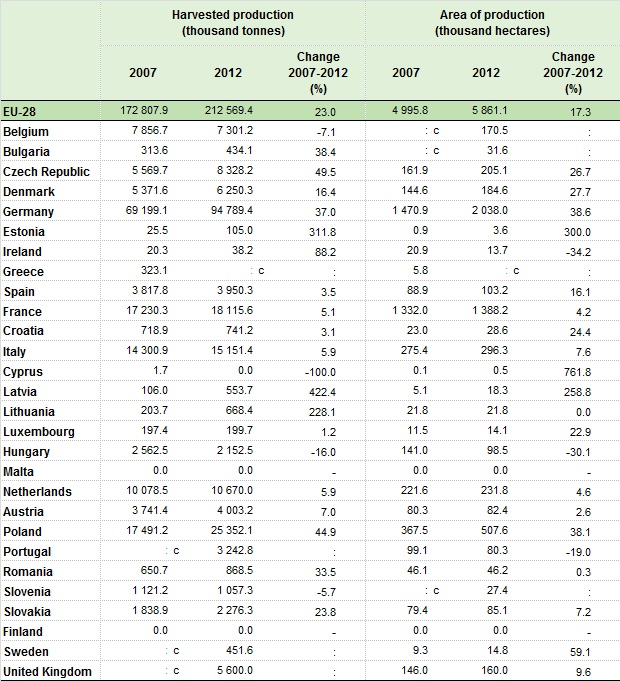
Harvested production and area of production of cereals, 2012.jpg
(
file
)
256 KB
1
15:36, 17 October 2013
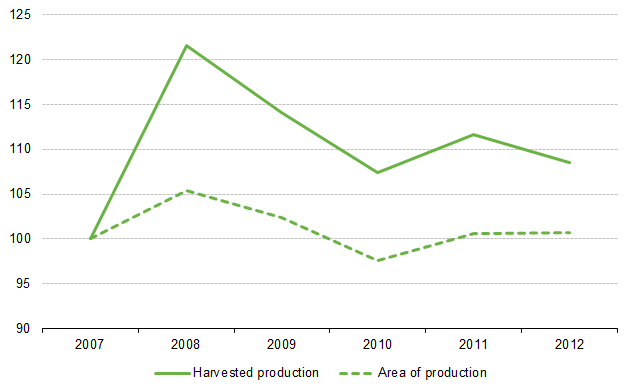
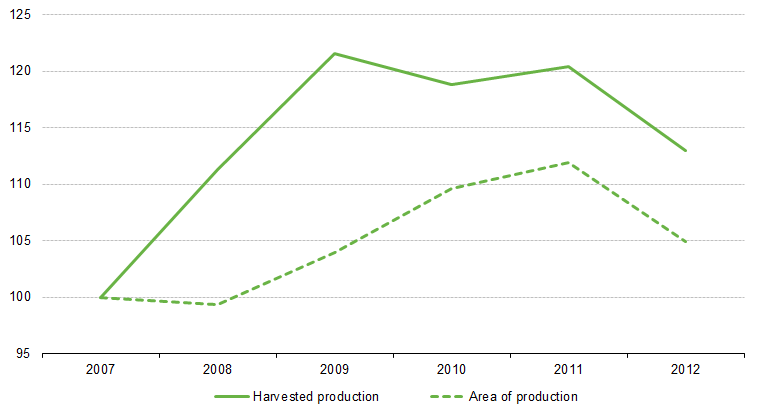
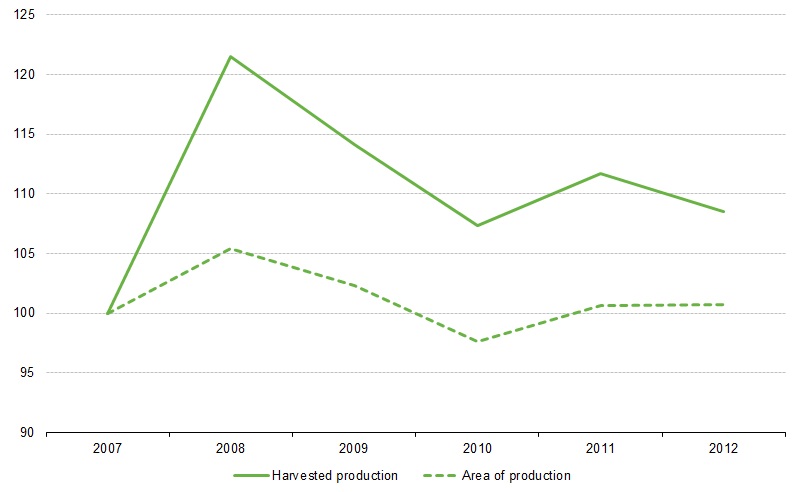
Development of harvested production and production area of cereals (including rice), EU-28.jpg
(
file
)
50 KB
1
15:38, 17 October 2013
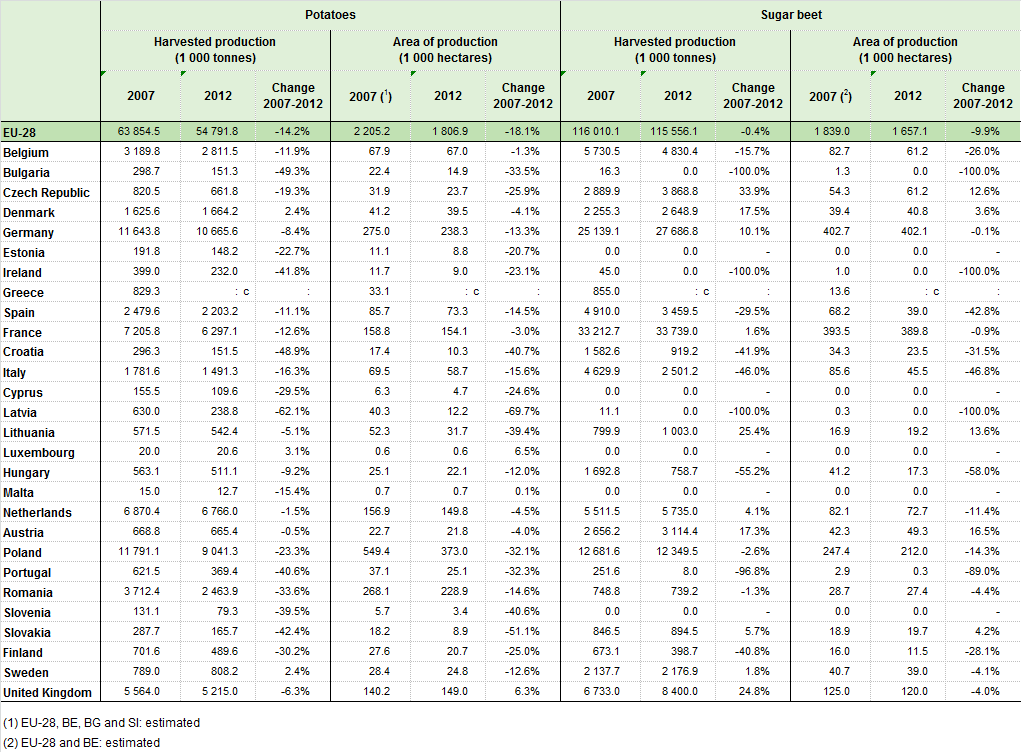
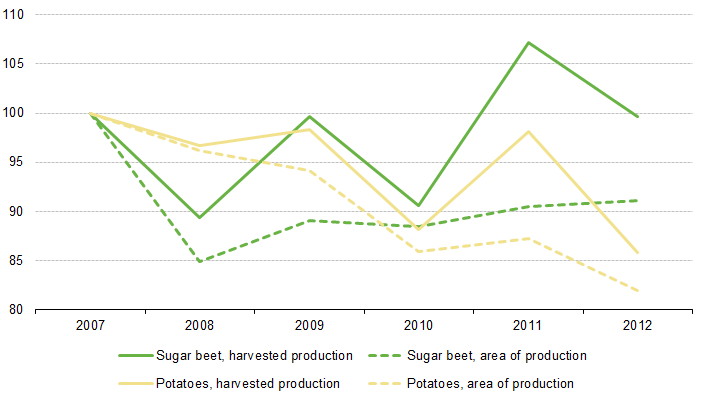
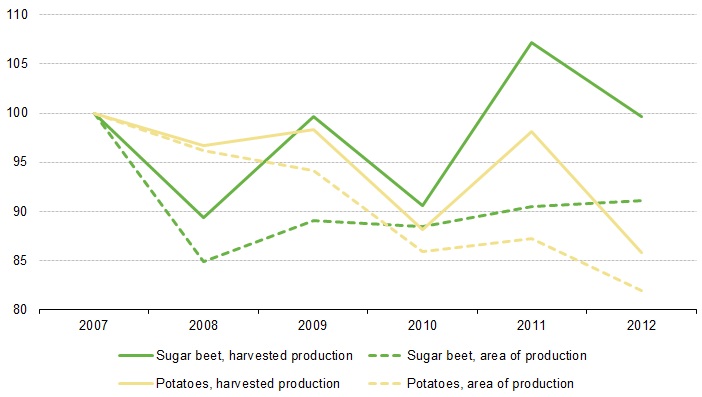
Development of harvested production and production area of potatoes and sugar beet, EU-28.jpg
(
file
)
58 KB
1
15:42, 17 October 2013
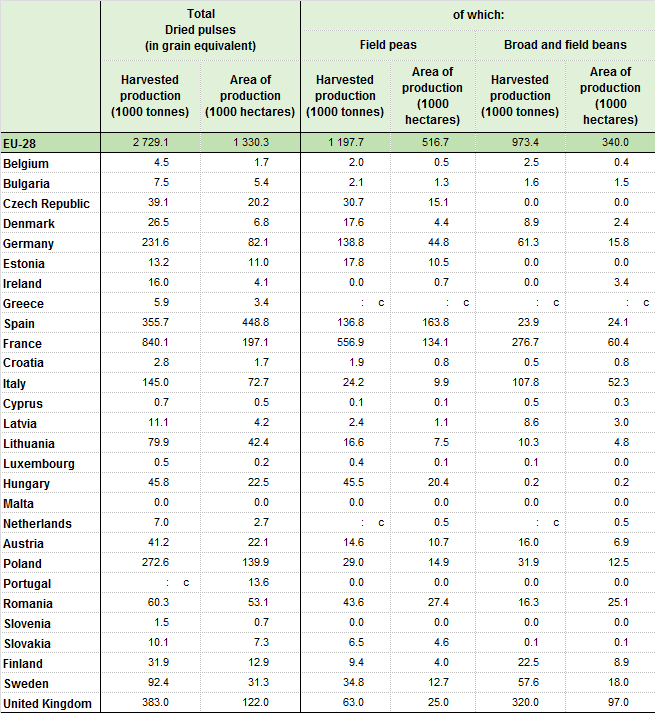
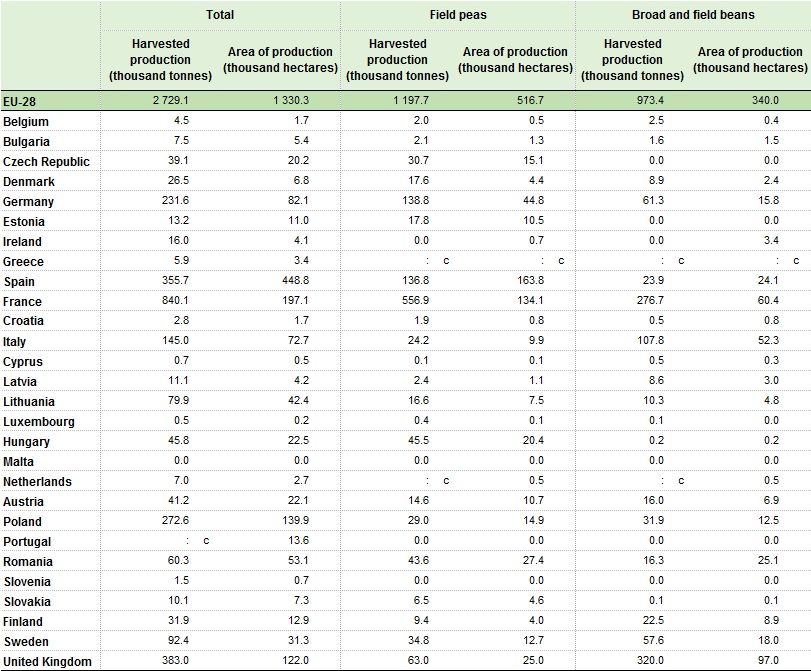
Harvested production and area of production of dried pulses, 2012.jpg
(
file
)
204 KB
1
15:43, 17 October 2013
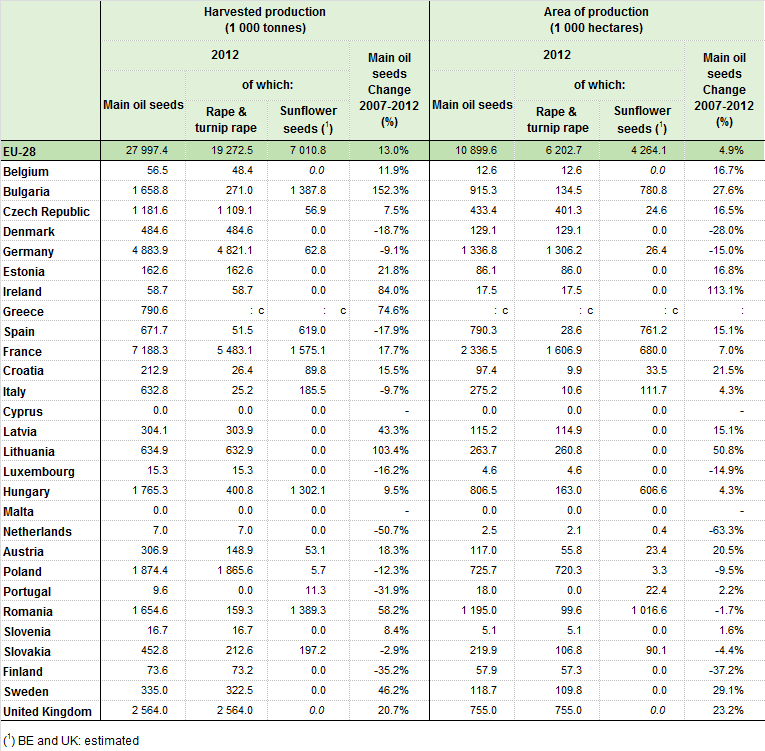
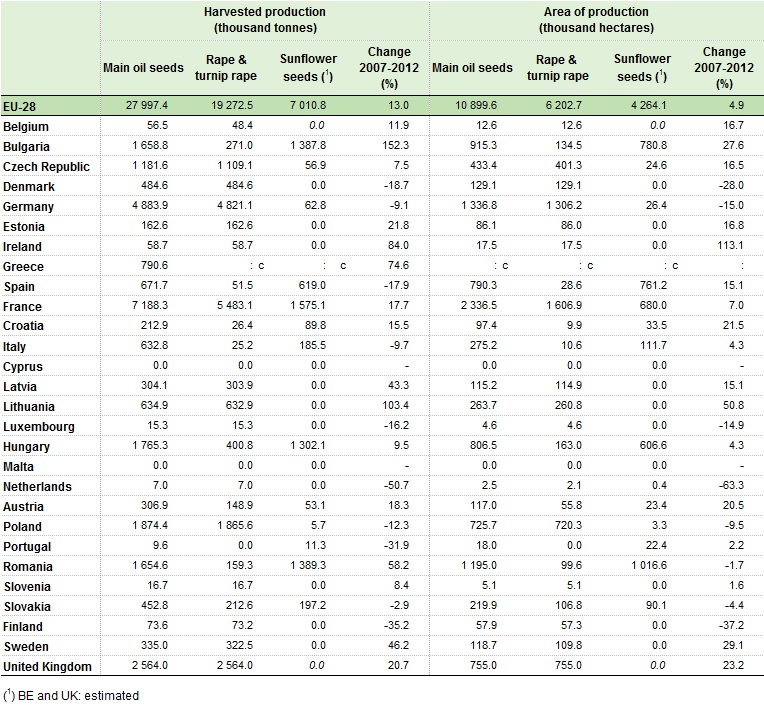
Harvested production and area of production of main oil seeds, 2012.jpg
(
file
)
231 KB
1
15:43, 17 October 2013
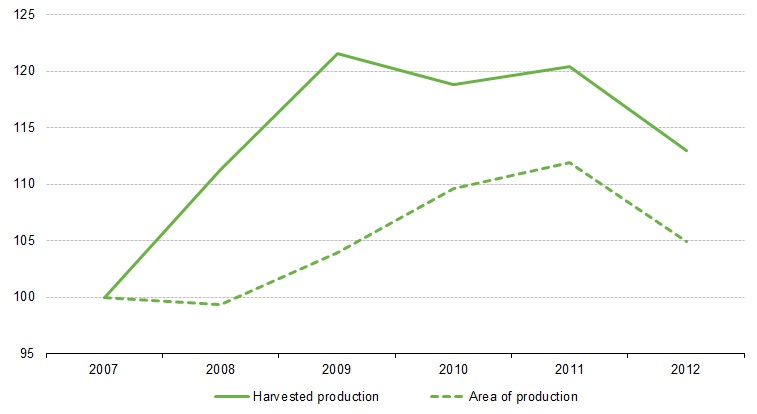
Development of harvested production and production area of main oil seeds, EU-28.jpg
(
file
)
45 KB
1
15:44, 17 October 2013
Harvested production and area of production of green maize.jpg
(
file
)
183 KB
1
10:01, 24 October 2013
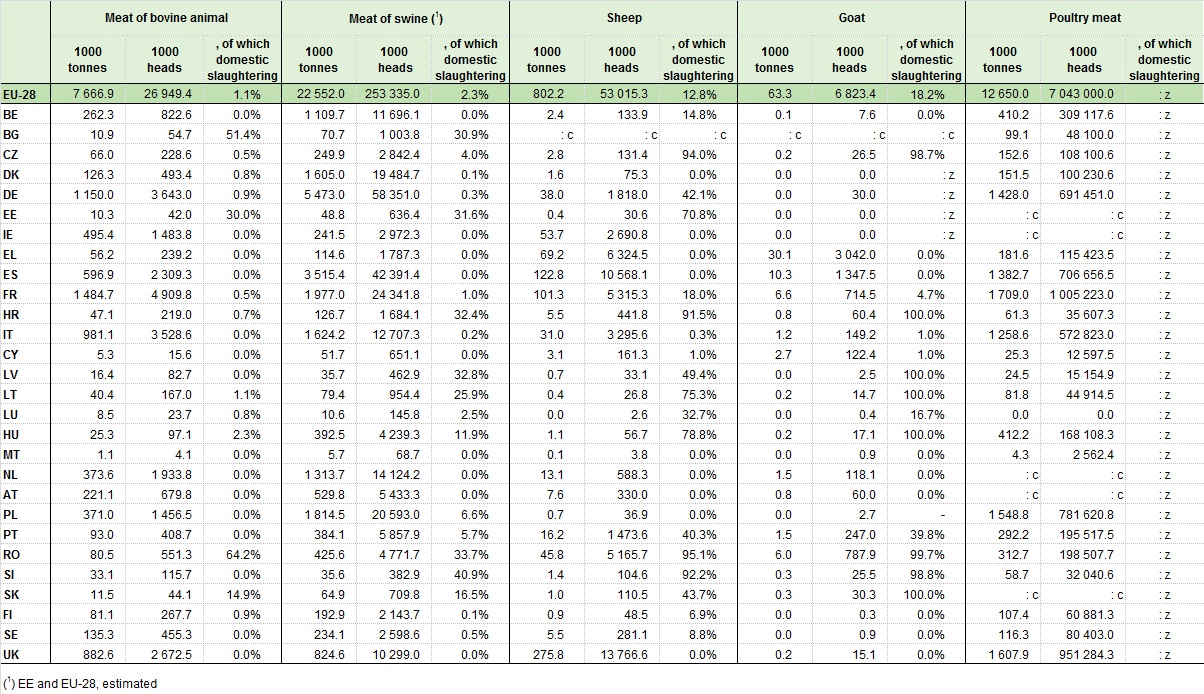
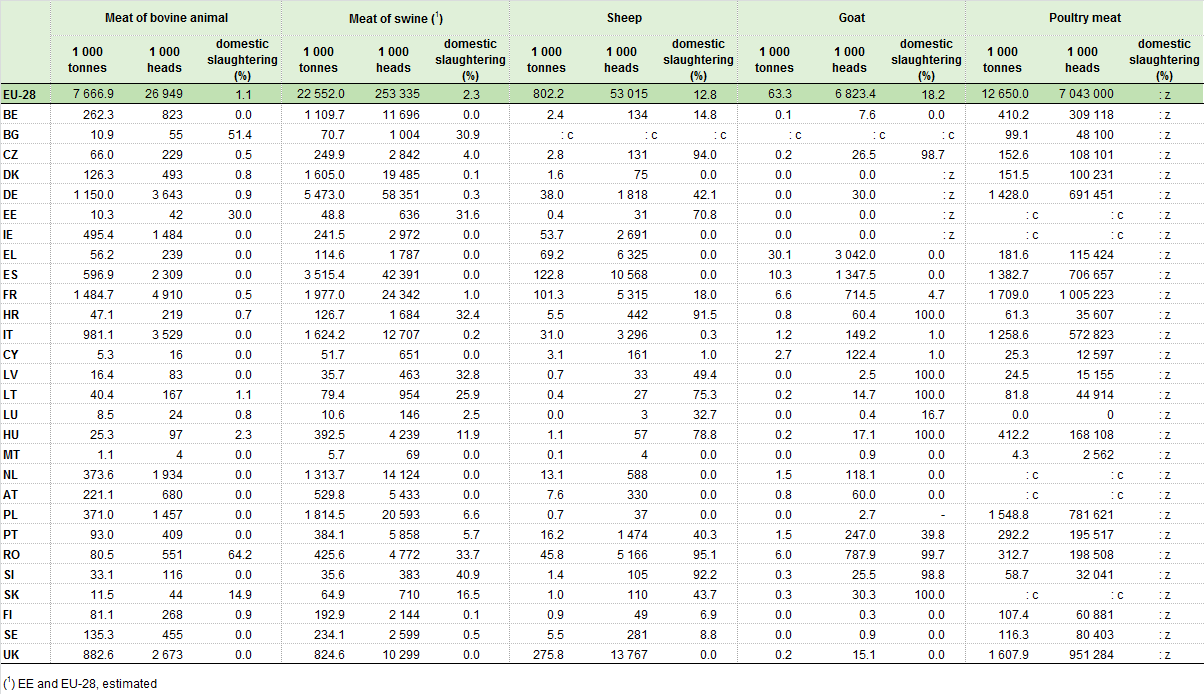
Slaughtering statistics by meat products, 2012.png
(
file
)
64 KB
1
10:01, 24 October 2013
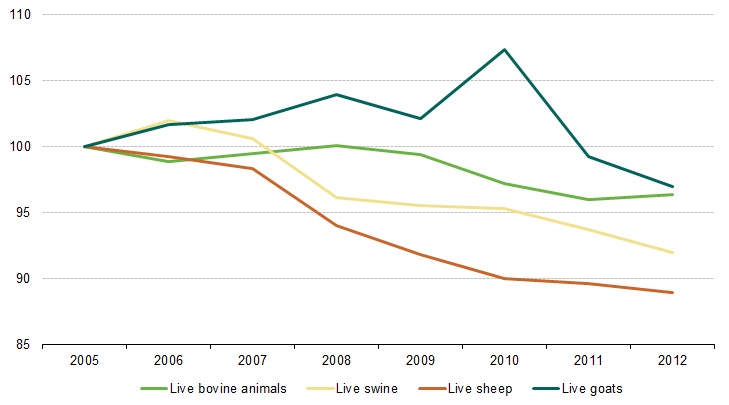
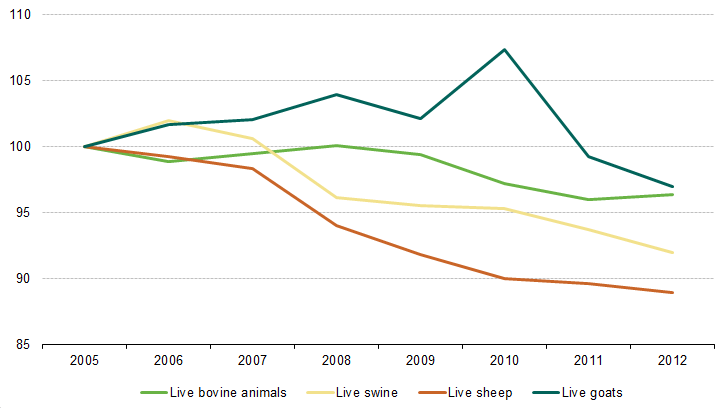
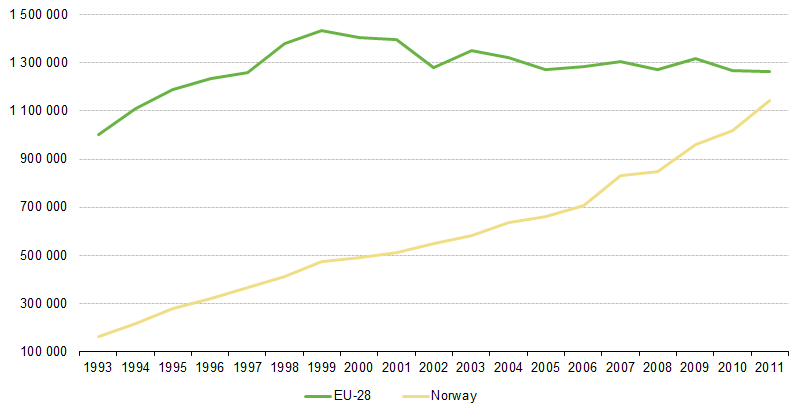
Development of livestock population in the EU.png
(
file
)
21 KB
1
10:02, 24 October 2013
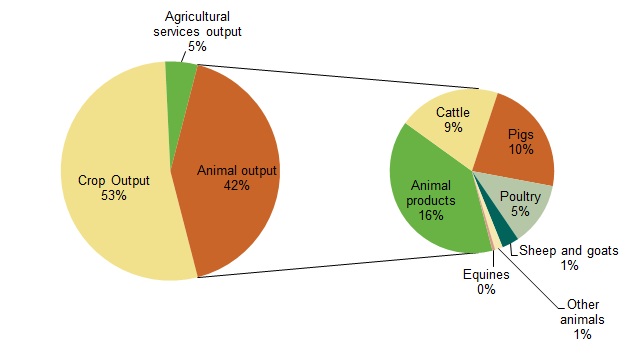
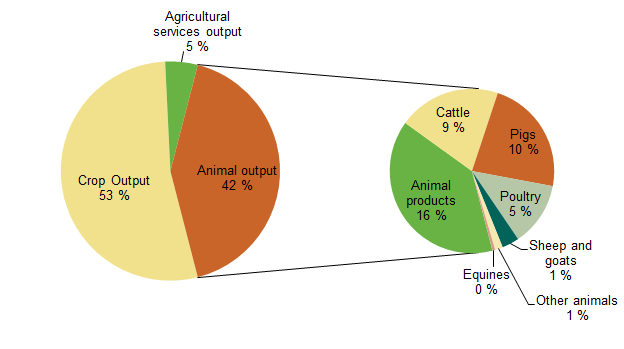
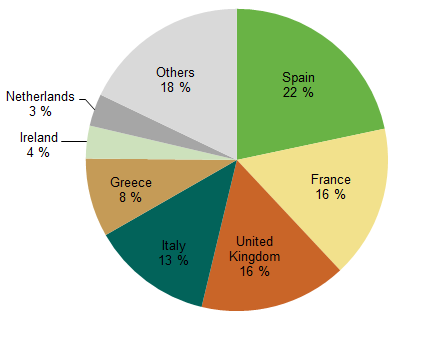
Agricultural output, EU-28, 2012.png
(
file
)
26 KB
1
10:03, 24 October 2013
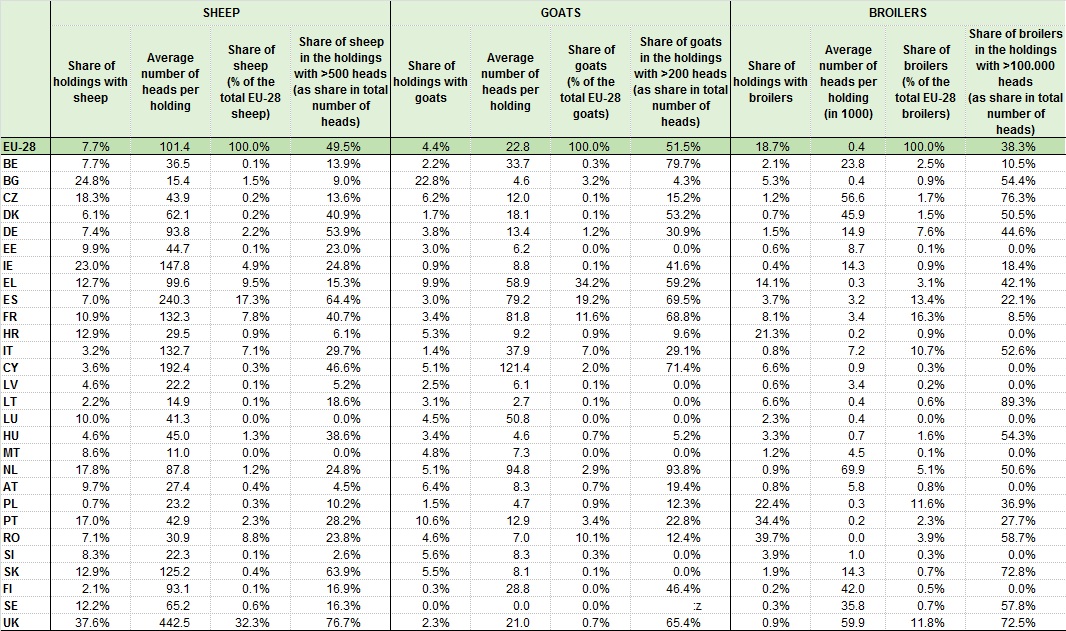
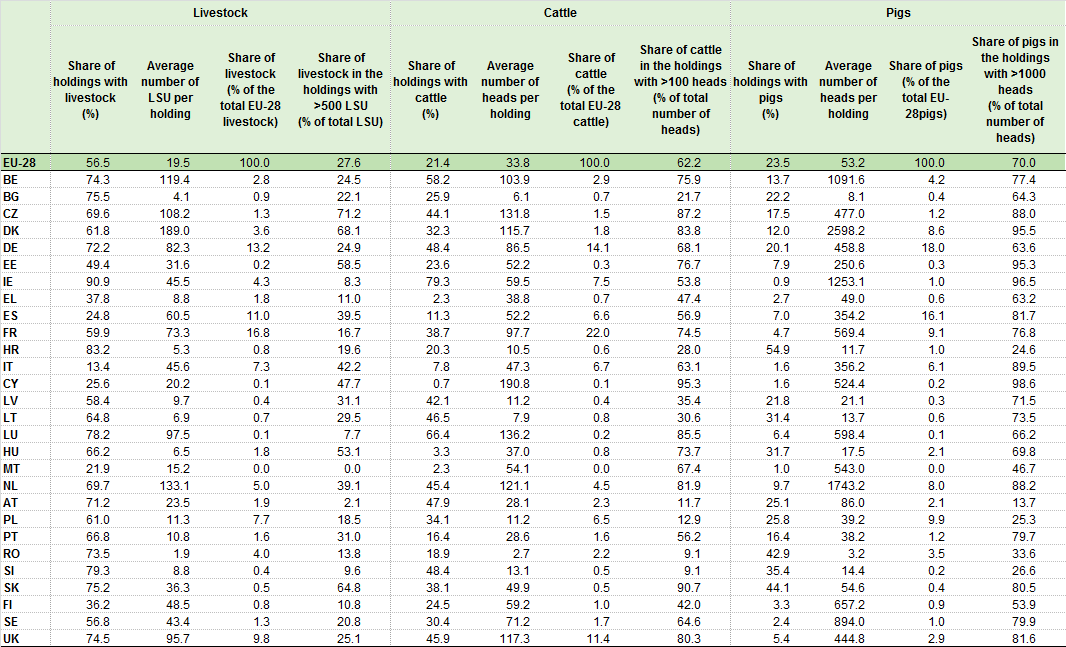
Structure of farms with livestock, 2010.png
(
file
)
68 KB
1
10:04, 24 October 2013
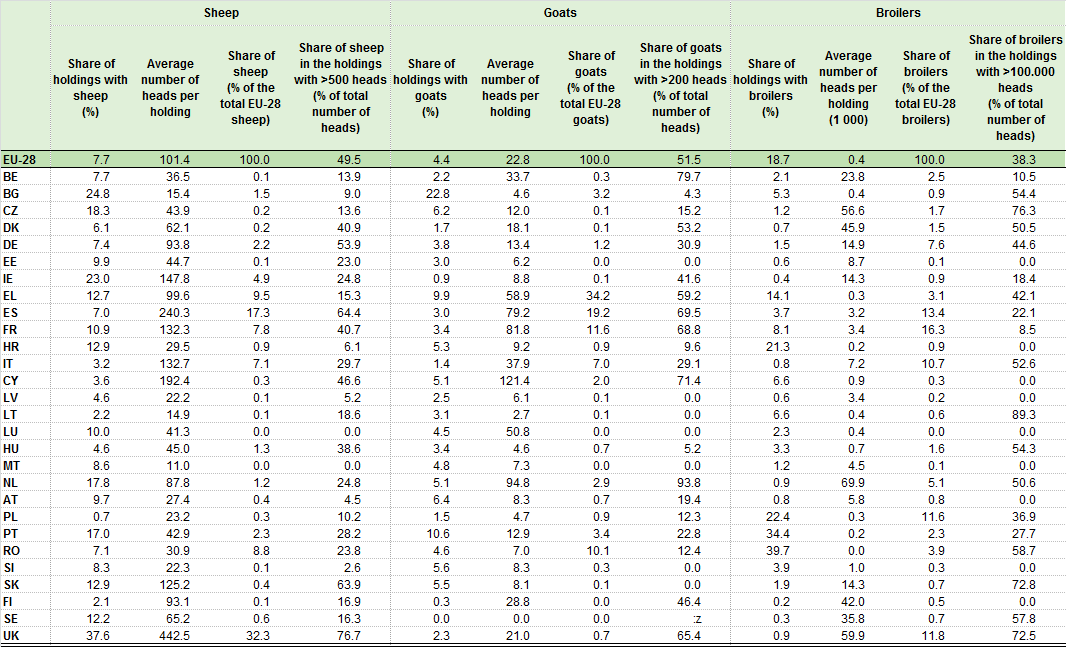
Structure of farms with livestock (continued), 2010.png
(
file
)
64 KB
1
11:52, 25 October 2013
Aquaculture production.png
(
file
)
18 KB
1
11:57, 25 October 2013
Main aquaculture producers, EU-28, 2011.png
(
file
)
19 KB
1
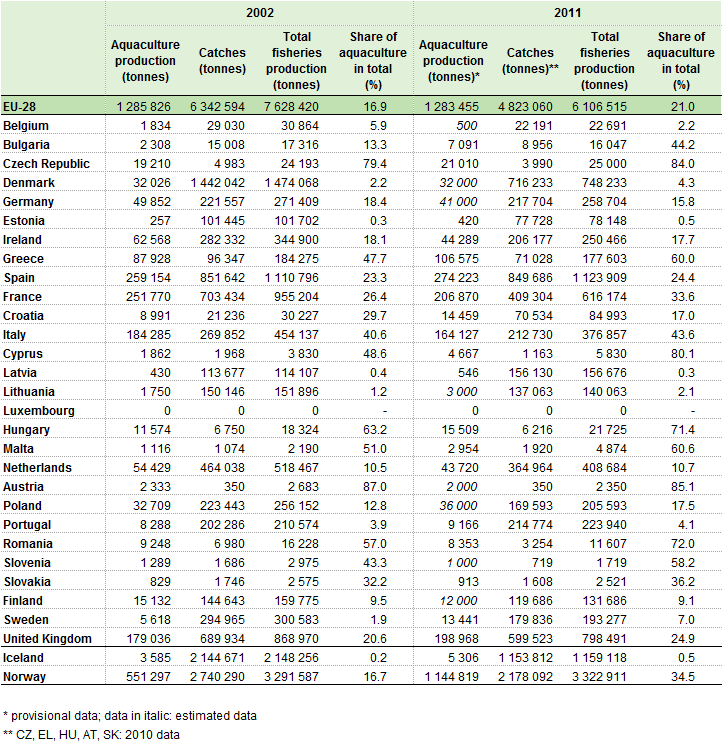
12:00, 25 October 2013
Importance of aquaculture in total fisheries.png
(
file
)
67 KB
1
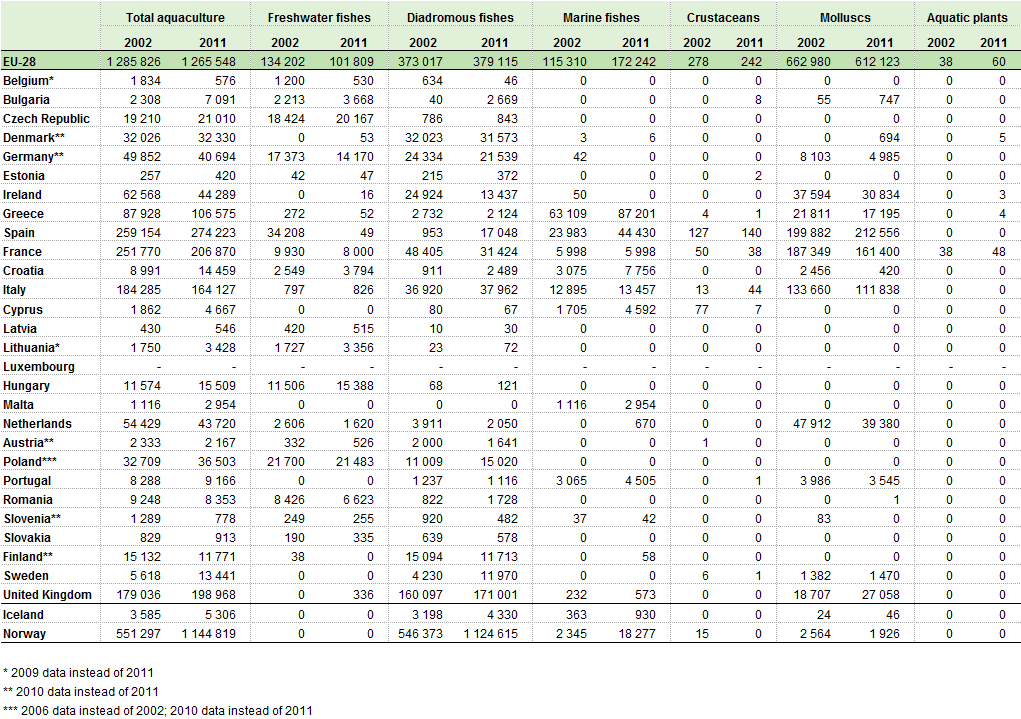
12:05, 25 October 2013
Aquaculture production by main species.png
(
file
)
77 KB
1
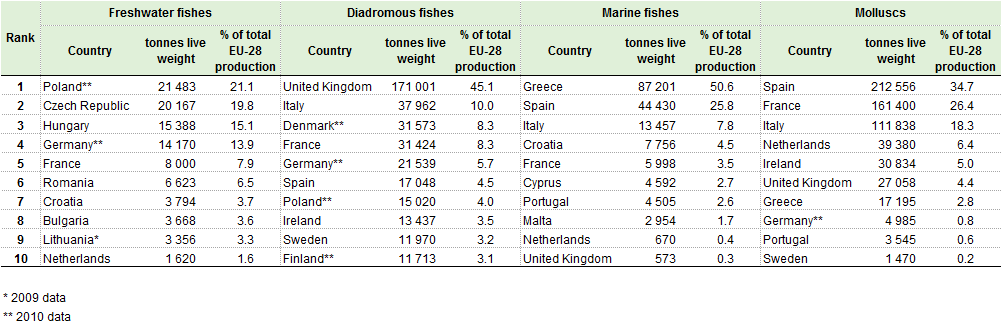
12:06, 25 October 2013
Aquaculture producers by main groups of species, 2011.png
(
file
)
35 KB
1
12:08, 25 October 2013
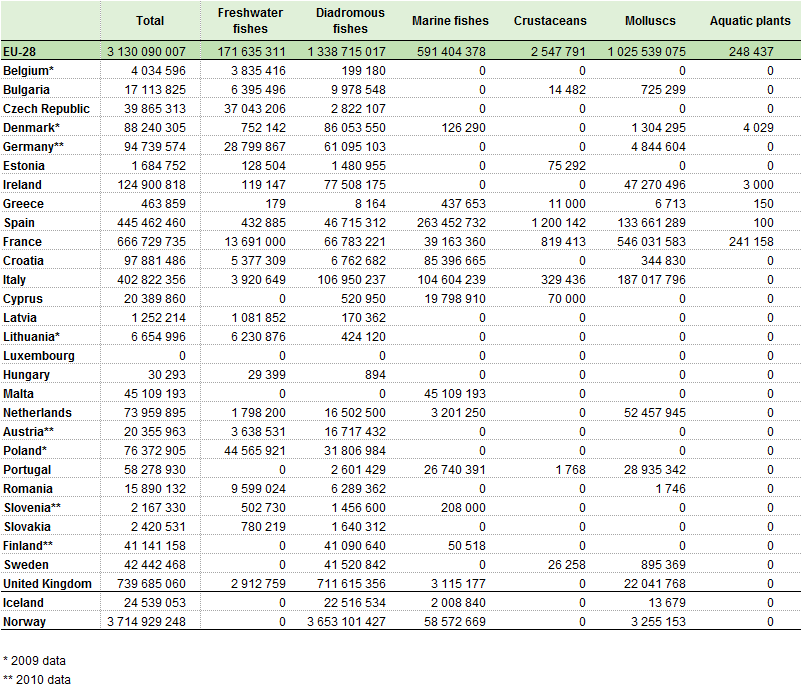
Value of aquaculture production, 2011.png
(
file
)
62 KB
1
12:10, 25 October 2013
Aquaculture production by group of species, EU-28, 2011.png
(
file
)
18 KB
1
12:12, 25 October 2013
Aquaculture production by group of species, Norway, 2011.png
(
file
)
12 KB
1
12:58, 25 October 2013
Value of aquaculture by group of species, EU-28, 2011.png
(
file
)
18 KB
1
12:59, 25 October 2013
Value of aquaculture by group of species, Norway, 2011.png
(
file
)
12 KB
1
16:19, 25 October 2013
Area under all vine varieties, 2009.png
(
file
)
15 KB
1
16:21, 25 October 2013
Area under vines, breakdown by varieties of vine, 2009.png
(
file
)
32 KB
1
16:22, 25 October 2013
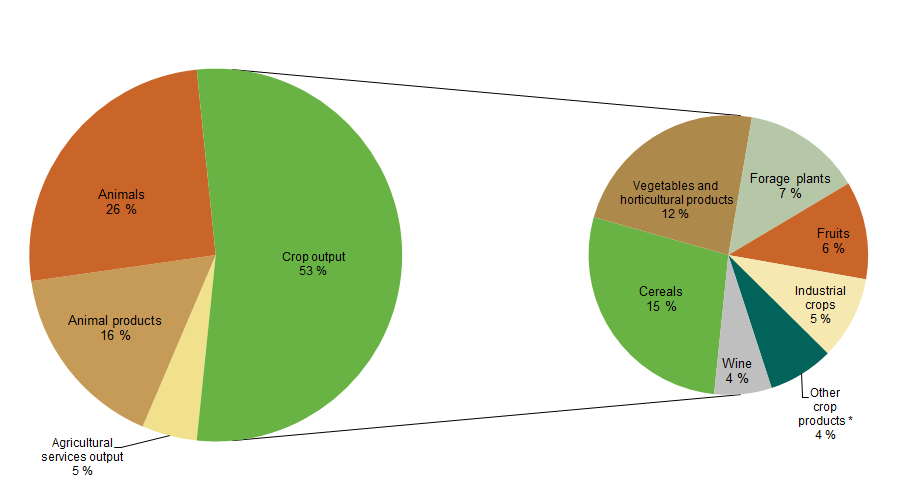
Agricultural output, 2012.png
(
file
)
43 KB
1
16:23, 25 October 2013
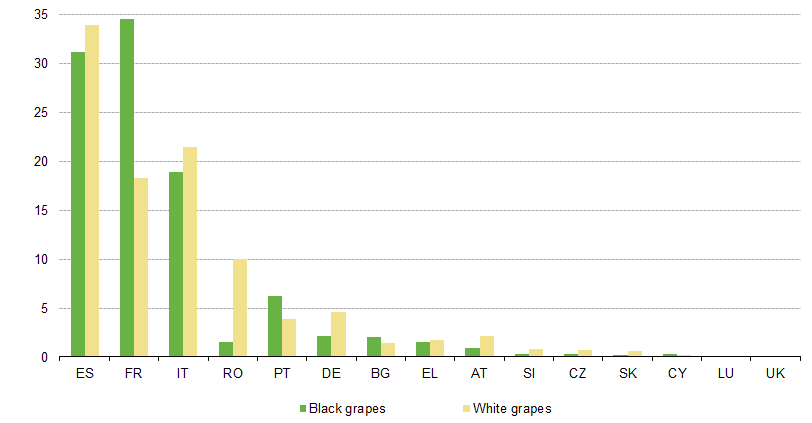
Cultivated area under wine-grape by vine varieties, 2009.png
(
file
)
11 KB
1
16:24, 25 October 2013
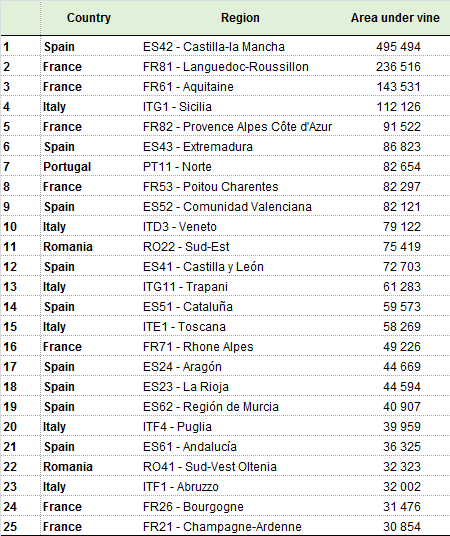
Main EU-regions in terms of cultivated area under vineyards, 2009.png
(
file
)
32 KB
1
16:25, 25 October 2013
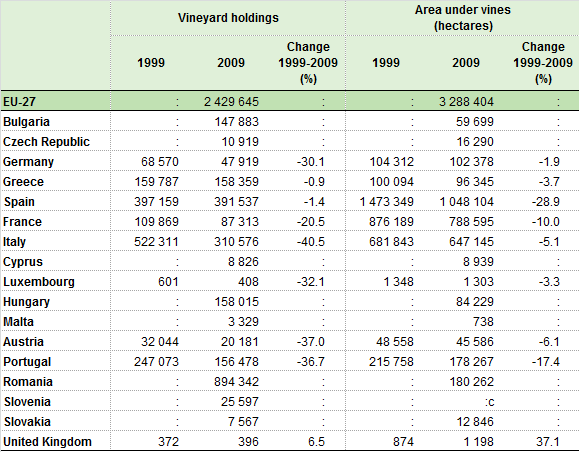
Vineyard holdings and area under vines, comparison 1999-2009.png
(
file
)
31 KB
1
11:43, 28 October 2013
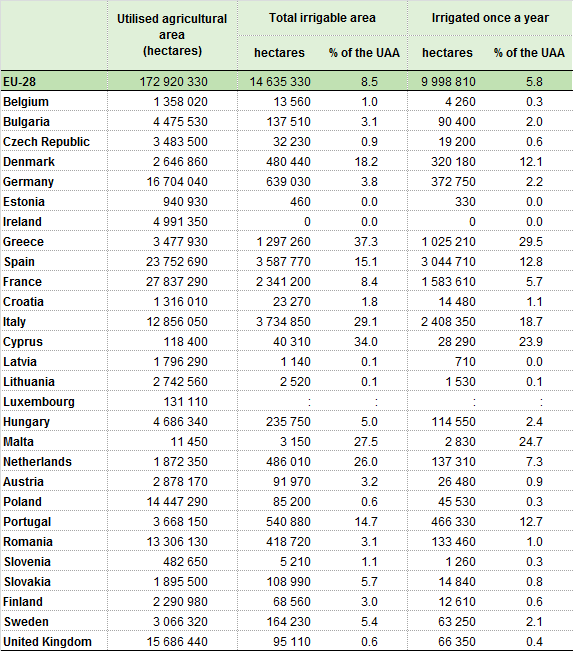
UAA and irrigable and irrigated areas, 2010.png
(
file
)
39 KB
1
11:45, 28 October 2013
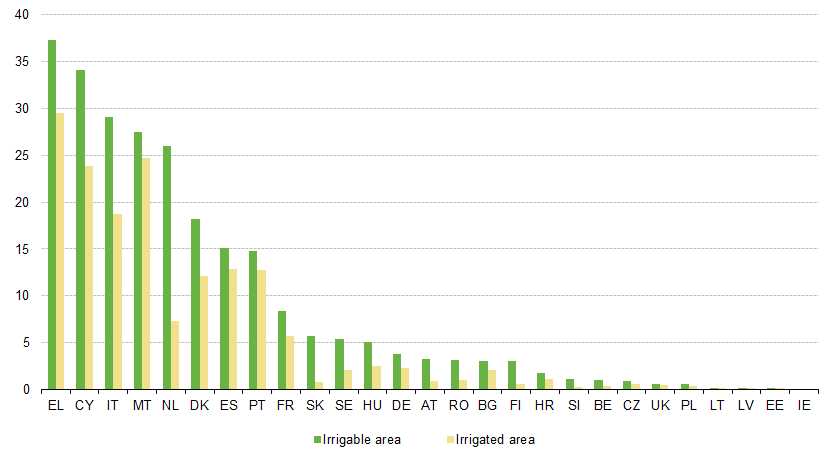
Irrigable and irrigated areas, 2010.png
(
file
)
13 KB
1
11:46, 28 October 2013
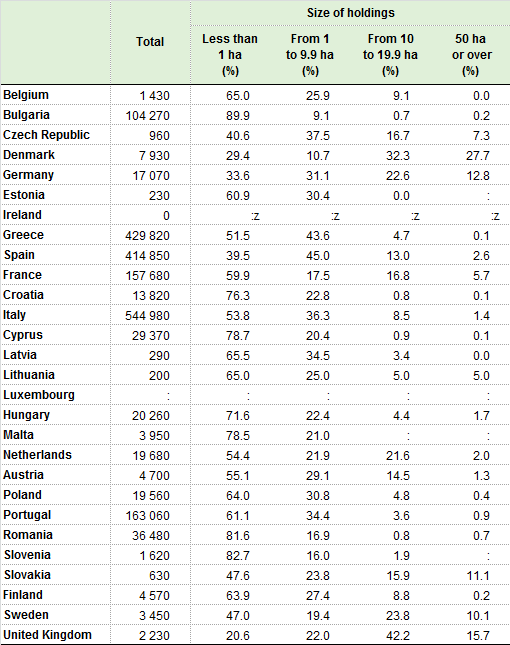
Holdings with irrigable area, 2010.png
(
file
)
35 KB
1
11:46, 28 October 2013
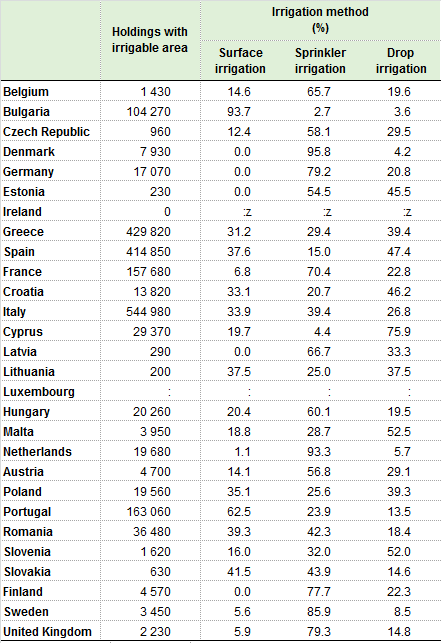
Irrigation methods, 2010.png
(
file
)
32 KB
1
11:49, 28 October 2013
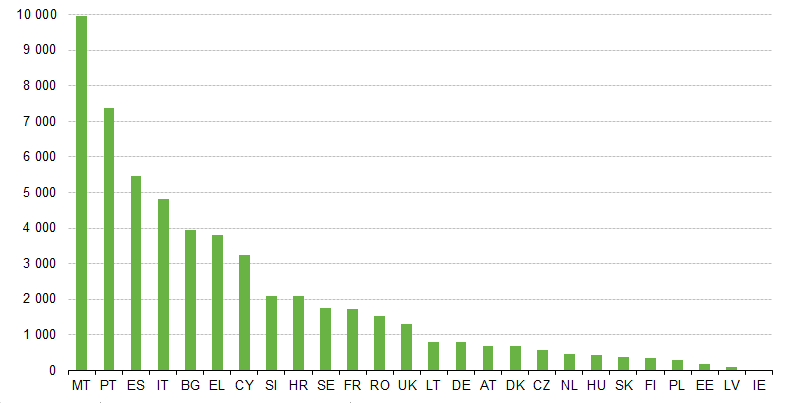
Average volume of water used for irrigation, 2010.png
(
file
)
12 KB
1
11:50, 28 October 2013
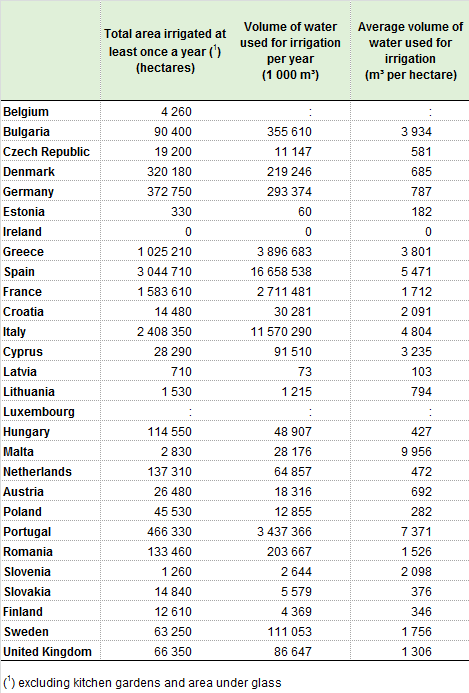
Volume of water used for irrigation, 2010.png
(
file
)
31 KB
1
17:57, 31 October 2013
SiF main crops - Tables and Graphs - Final 17.10.2013.xls
(
file
)
195 KB
1
First page
Previous page
Next page
Last page
Special page
ISSN 2443-8219

.png)
.png)
.png)
.png)
.png)
.png)
.png)
.png)


.jpg)
.jpg)
,_EU-28,_2011.jpg)

,_EU-28.jpg)


,_2010.png)


