Uploads by EXT-Z-Konstantinou
This special page shows all uploaded files.
| Date | Name | Thumbnail | Size | Description | Versions |
|---|---|---|---|---|---|
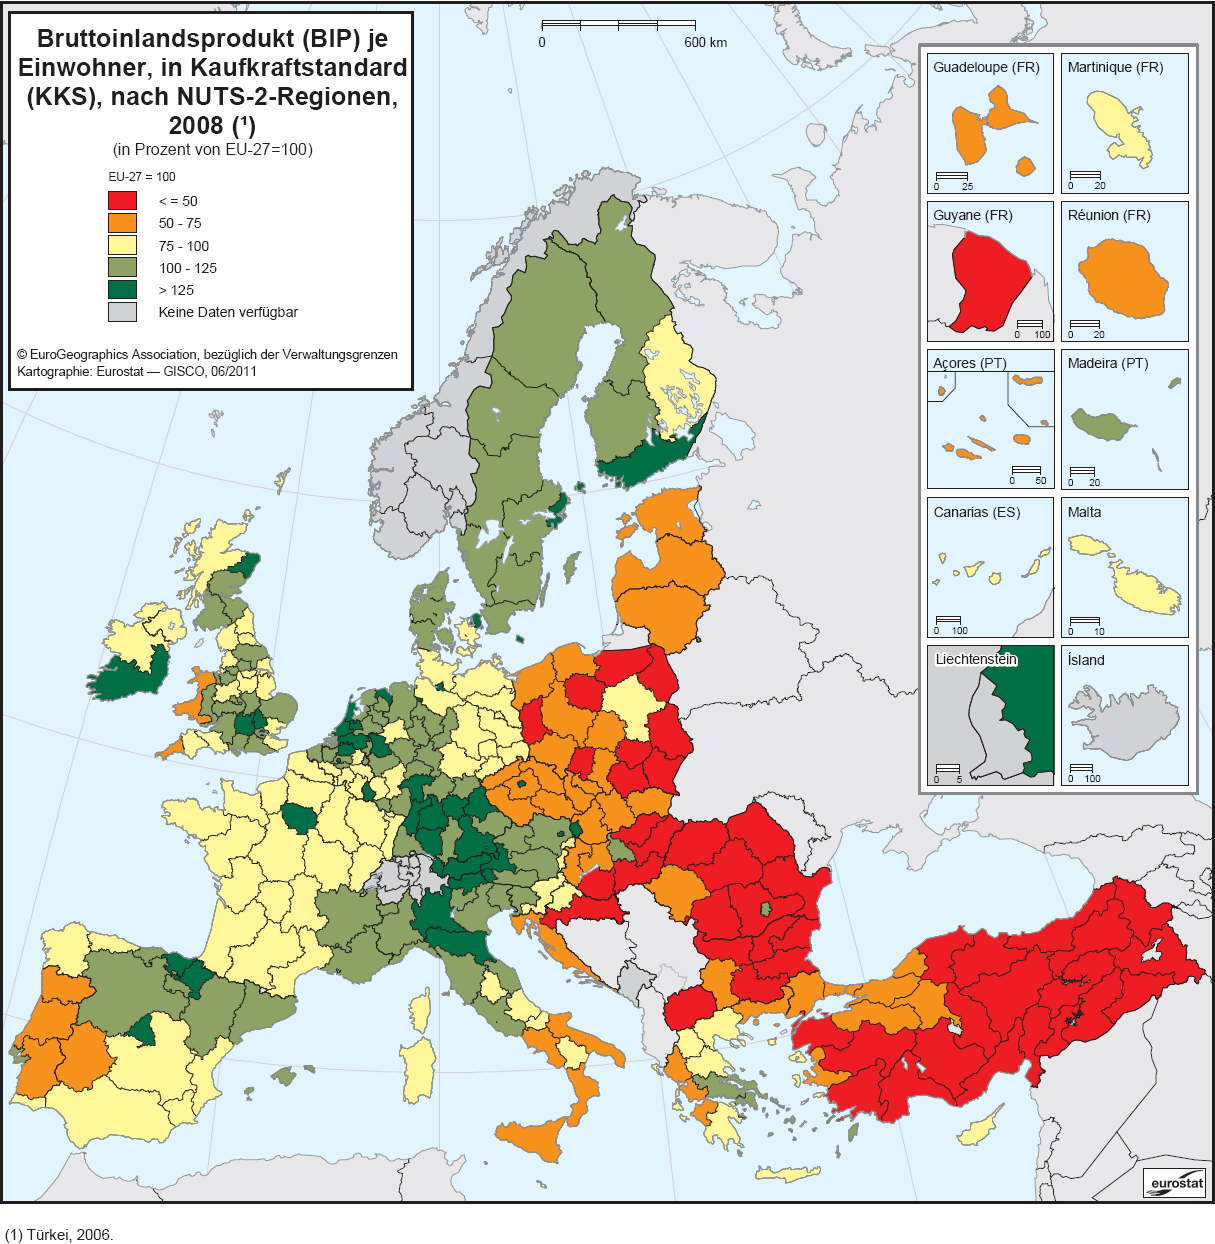
| 14:30, 18 January 2012 | Gross domestic product (GDP) per inhabitant, in purchasing power standard (PPS), by NUTS 2-de.PNG (file) | _per_inhabitant,_in_purchasing_power_standard_(PPS),_by_NUTS_2-de.PNG) |
344 KB | Karte 1: Bruttoinlandsprodukt (BIP) je Einwohner, in Kaufkraftstandard (KKS), nach NUTS-2-Regionen, 2008 (¹)(in Prozent von EU-27=100) - Quelle: Eurostat (online Datenkode: nama_r_e2gdp) | 1 |
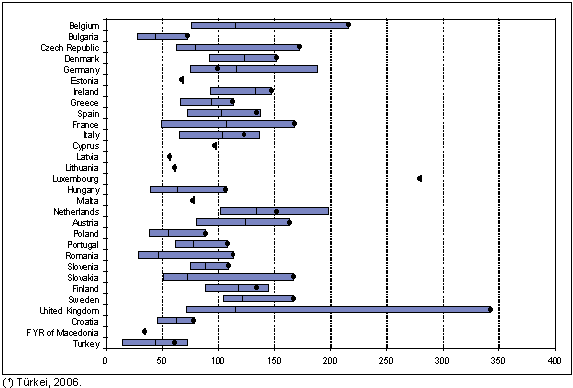
| 11:00, 19 January 2012 | Gross domestic product (GDP) per inhabitant, in purchasing power standard (PPS), highest and lowest NUTS 2 region within each country, 2008-de.PNG (file) | _per_inhabitant,_in_purchasing_power_standard_(PPS),_highest_and_lowest_NUTS_2_region_within_each_country,_2008-de.PNG) |
14 KB | Abbildung 1: Bruttoinlandsprodukt (BIP) je Einwohner, in Kaufkraftstandard (KKS), höchste und niedrigste Werte für NUTS-2-Regionen in jedem Land, 2008 (¹) (in % des EU-27 Durchschnitts, EU-27 = 100) - Quelle: Eurostat (online Datenkode: nama_r_e2gdp) | 1 |
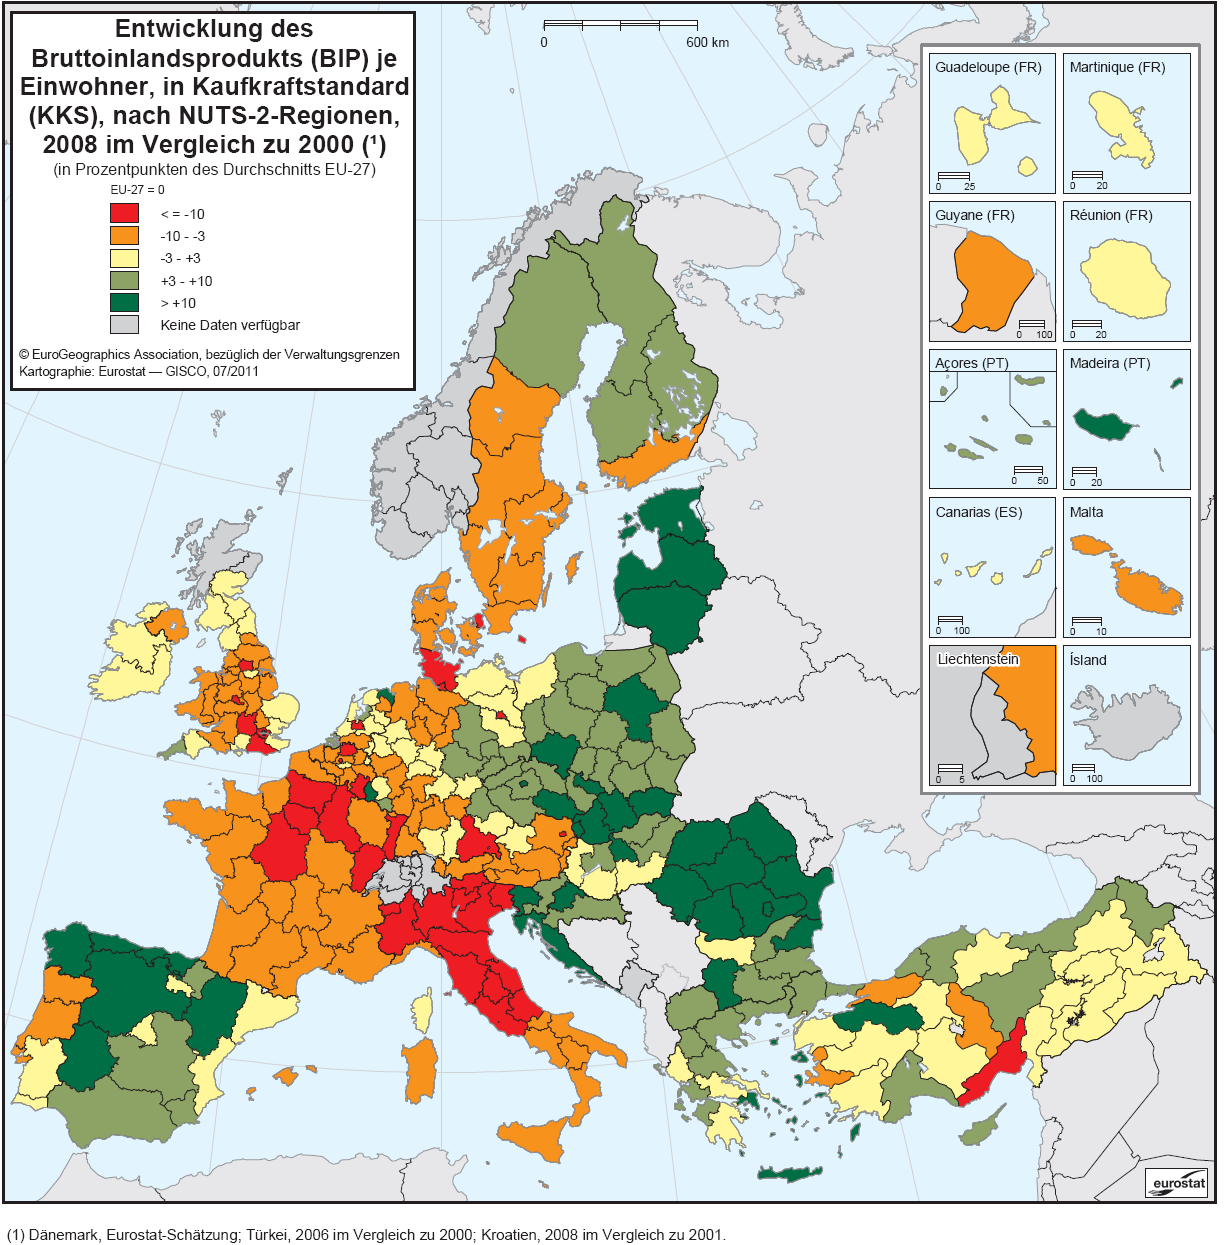
| 11:27, 19 January 2012 | Change of gross domestic product (GDP) per inhabitant, in purchasing power standard (PPS), by NUTS 2 regions, 2008 as compared with 2000-de.PNG (file) | _per_inhabitant,_in_purchasing_power_standard_(PPS),_by_NUTS_2_regions,_2008_as_compared_with_2000-de.PNG) |
352 KB | Karte 2: Entwicklung des Bruttoinlandsprodukts (BIP) je Einwohner, in Kaufkraftstandard (KKS), nach NUTS-2-Regionen, 2008 im Vergleich zu 2000 (1) (in Prozentpunkten des Durchschnitts EU-27) - Quelle: Eurostat (online Datenkode: nama_r_e2gdp) | 1 |
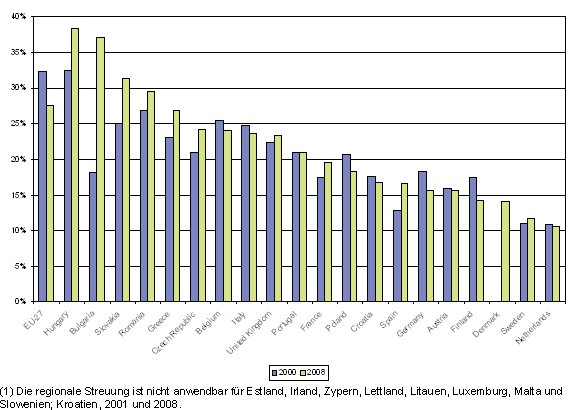
| 11:39, 19 January 2012 | Dispersion of regional GDP per inhabitant, in PPS, NUTS level 2, 2000 and 2008 (%)-de.PNG (file) | -de.PNG) |
15 KB | Abbildung 7.2: Streuung des regionalen BIP je Einwohner, in KKS, NUTS-Ebene 2, 2000 und 2008 (1) (%)Quelle: Eurostat (online Datenkode: nama_r_e0digdp) | 1 |
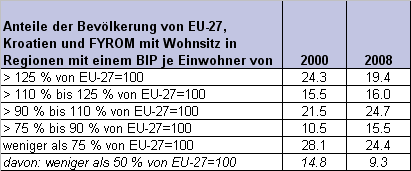
| 11:57, 19 January 2012 | Proportions of resident population of EU-27, Croatia and former Yugoslav Republic of Macedonia in economically stronger and weaker regions-de.PNG (file) |  |
8 KB | Tabelle 1: Anteile der Bevölkerung von EU-27, Kroatien und FYROM mit Wohnsitz in wirtschaftlich stärkeren und schwächeren Regionen - Quelle: Eurostat (nama_r_e2gdp) | 1 |
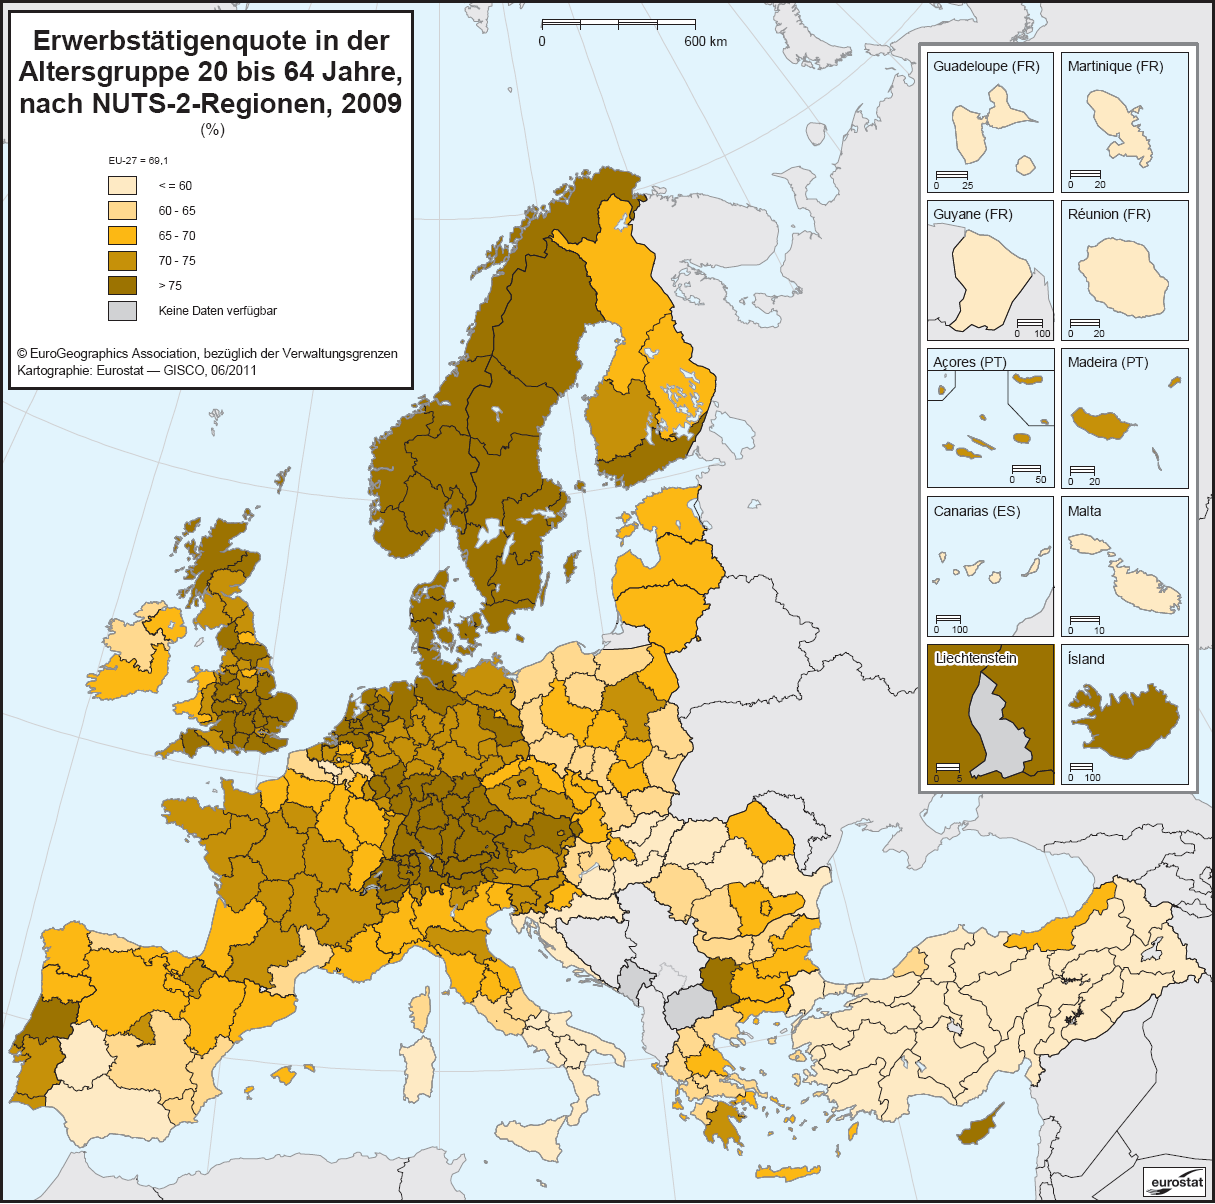
| 18:09, 2 February 2012 | Employment rate for the 20-64 age group, by NUTS2 regions, 2009 (%)-de.PNG (file) | -de.PNG) |
338 KB | Karte 1: Erwerbstätigenquote in der Altersgruppe 20 bis 64 Jahre, nach NUTS-2-Regionen, 2009 (%) - Quelle: Eurostat (online Datenkode: lfst_r_lfe2emprt) | 1 |
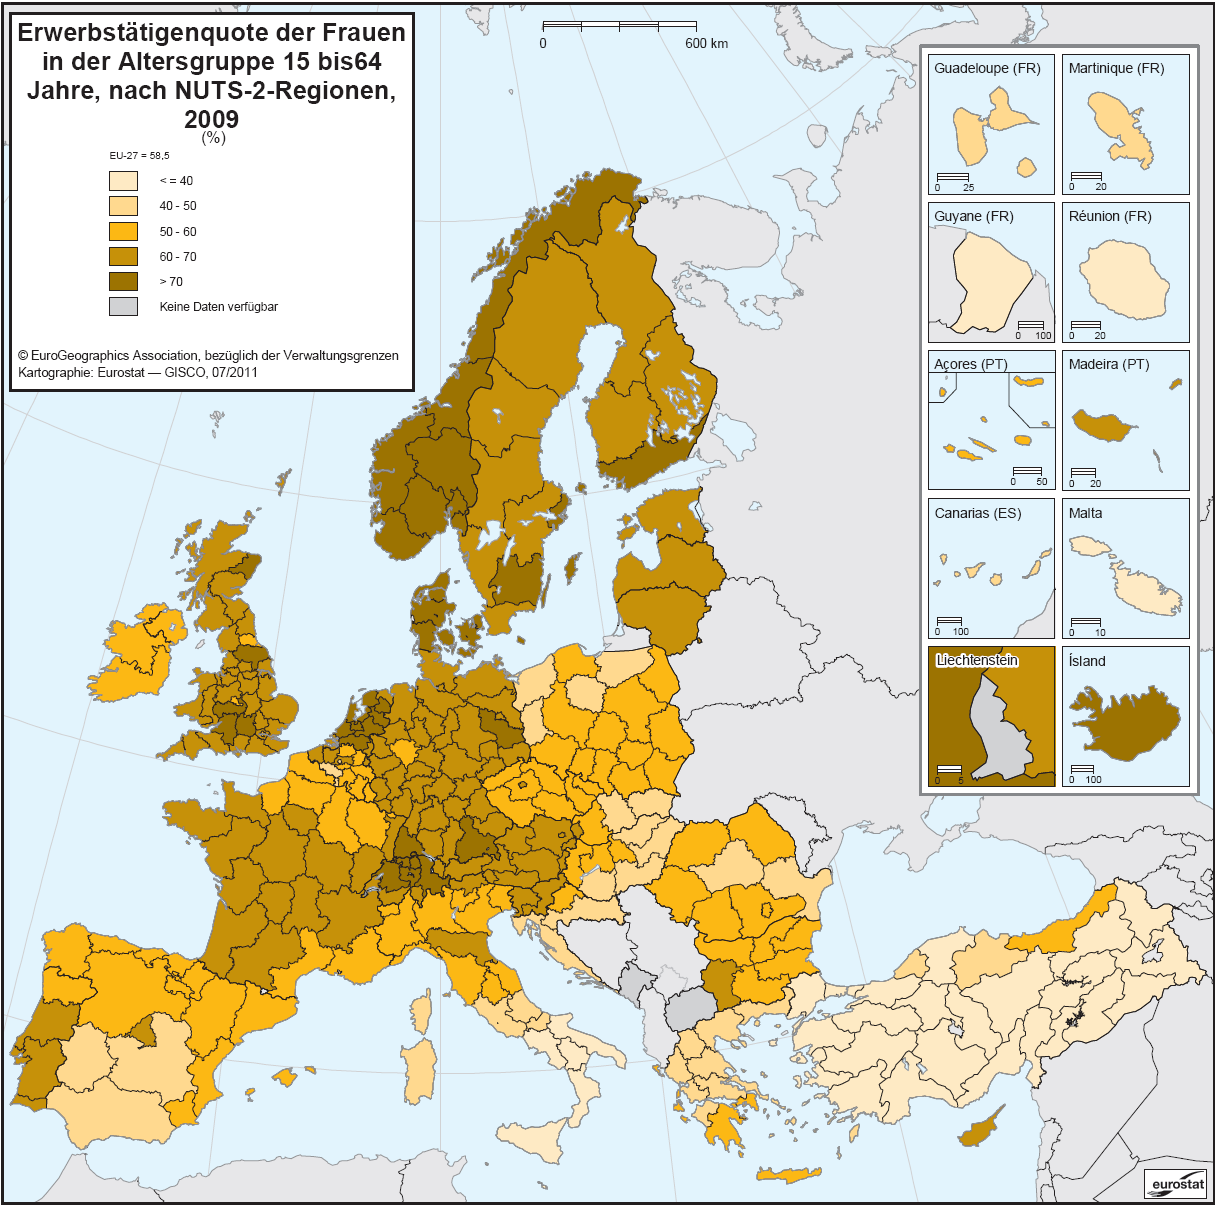
| 18:20, 2 February 2012 | Female employment rate for 15-64 age group, by NUTS2 regions, 2009 (%)-de.PNG (file) | -de.PNG) |
336 KB | Karte 2: Erwerbstätigenquote der Frauen in der Altersgruppe 15 bis 64 Jahre, nach NUTS-2-Regionen, 2009 (%) - Quelle: Eurostat (online Datenkode: lfst_r_lfe2emprt) | 1 |
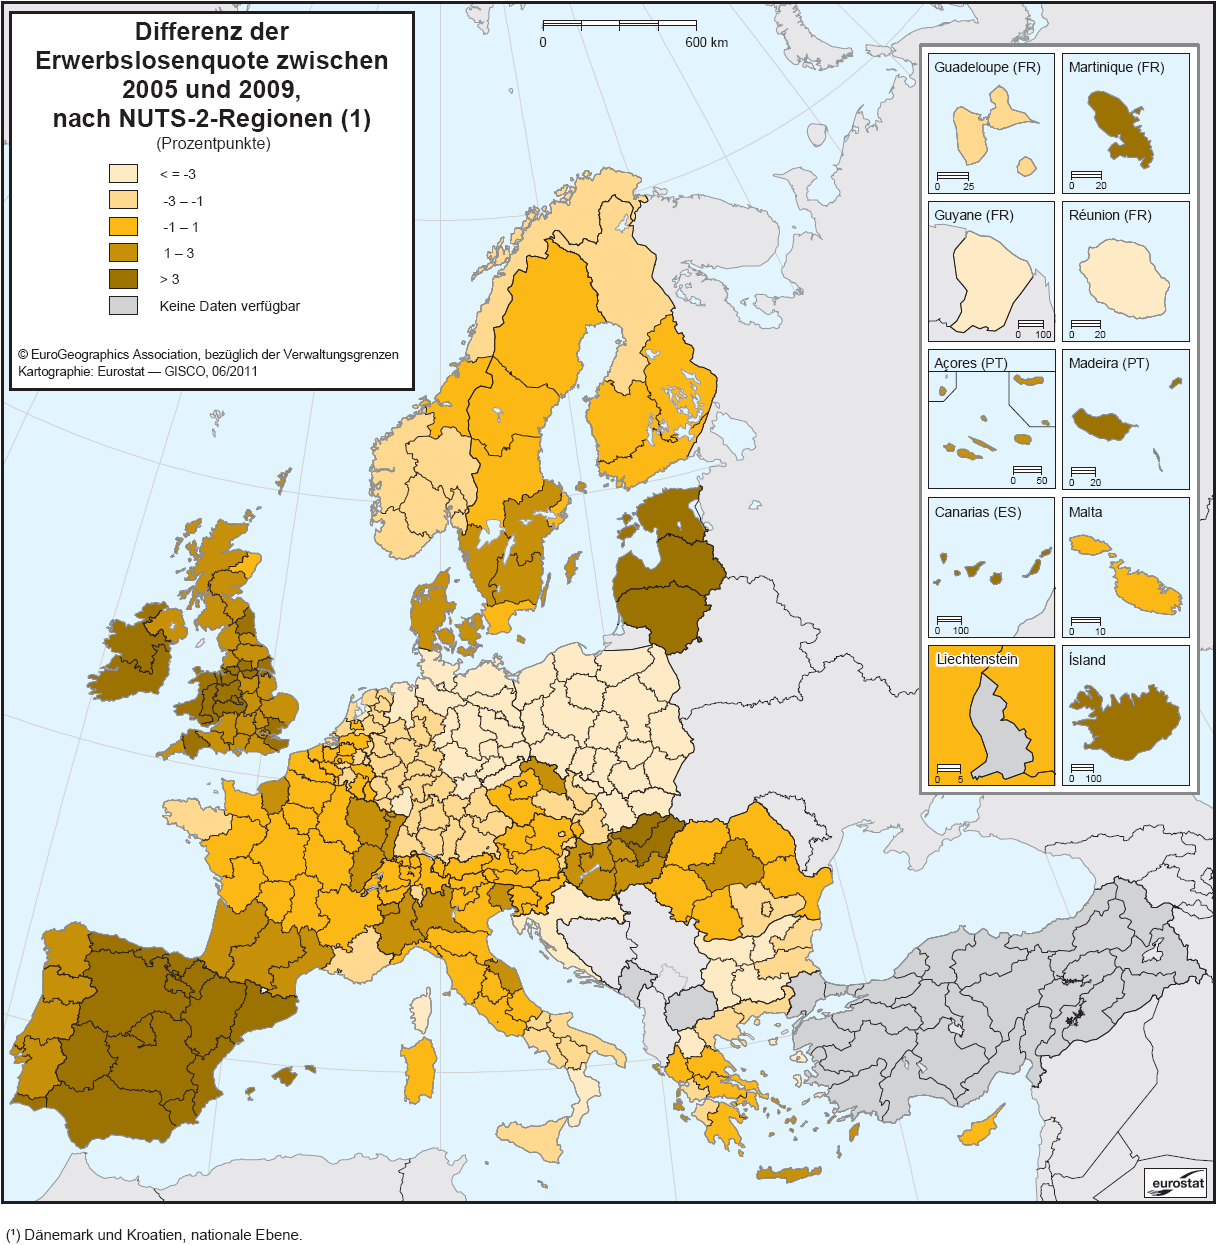
| 12:39, 3 February 2012 | Change in unemployment rate, by NUTS 2 regions, 2009 compared with 2005 (Percentage points)-de.PNG (file) | -de.PNG) |
339 KB | Karte 4: Differenz der Erwerbslosenquote zwischen 2005 und 2009, nach NUTS-2-Regionen (1) (Prozentpunkte) - Quelle: Eurostat (online Datenkode: lfst_r_lfu3rt) | 1 |
| 12:42, 3 February 2012 | Long-term unemployment share by NUTS 2 regions, 2009 (%)-de.PNG (file) | -de.PNG) |
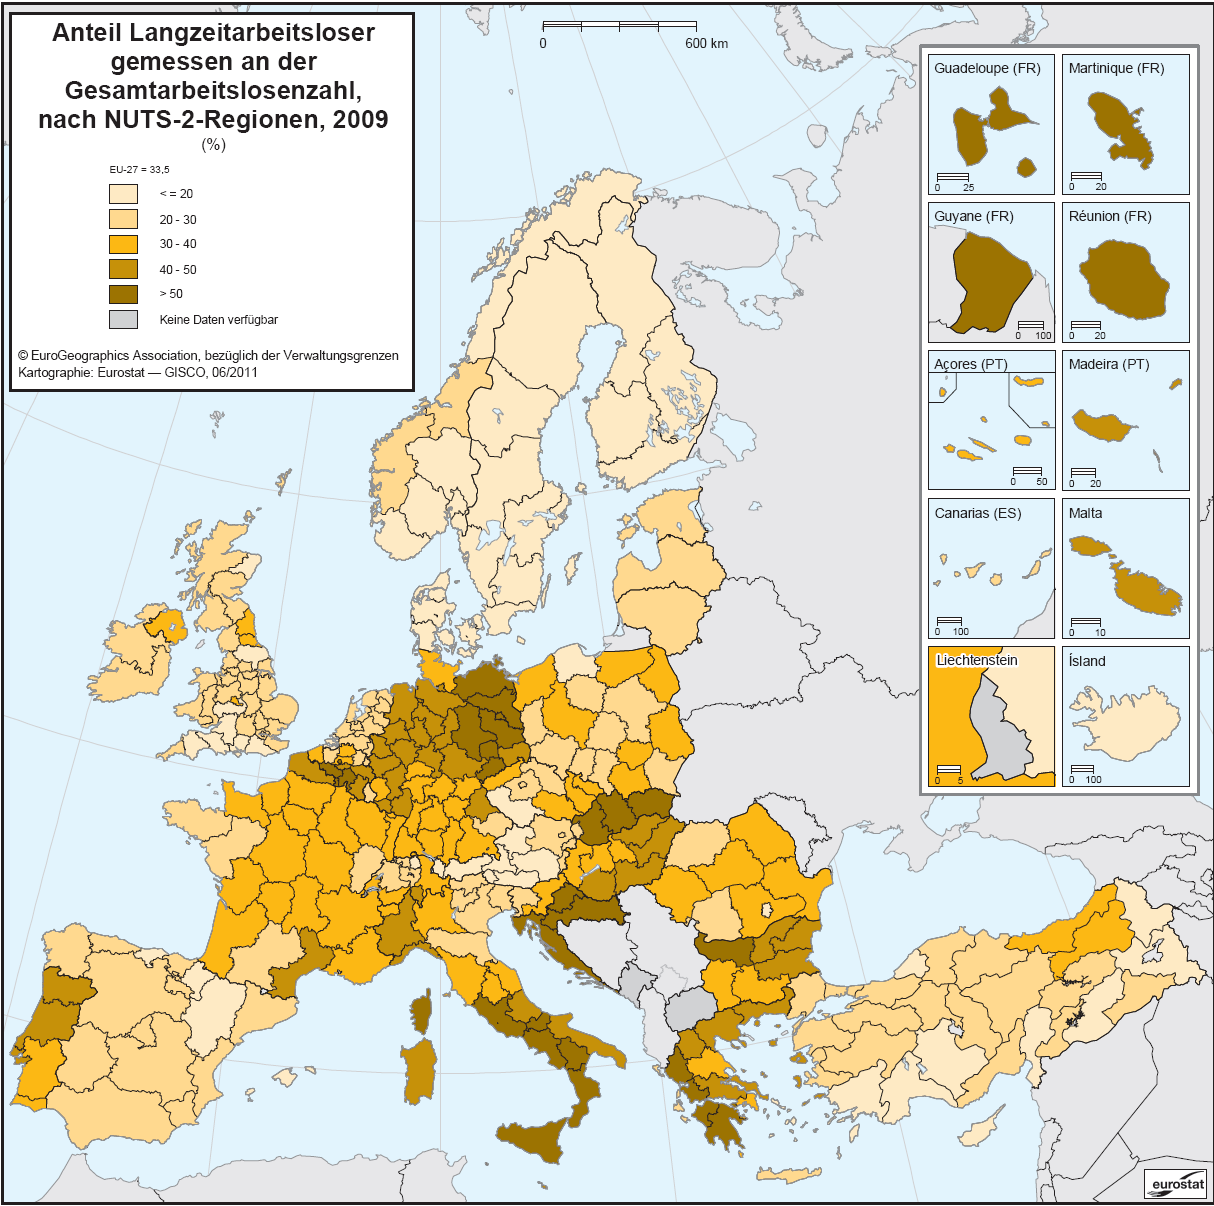
339 KB | Karte 5: Anteil Langzeitarbeitsloser gemessen an der Gesamtarbeitslosenzahl, nach NUTS-2-Regionen, 2009 (%) - Quelle: Eurostat (online Datenkode: llfst_r_lfu2ltu) | 1 |
| 12:47, 3 February 2012 | Youth unemployment rate (15-24), by NUTS 2 regions, 2009 (%)-de.PNG (file) | ,_by_NUTS_2_regions,_2009_(%25)-de.PNG) |
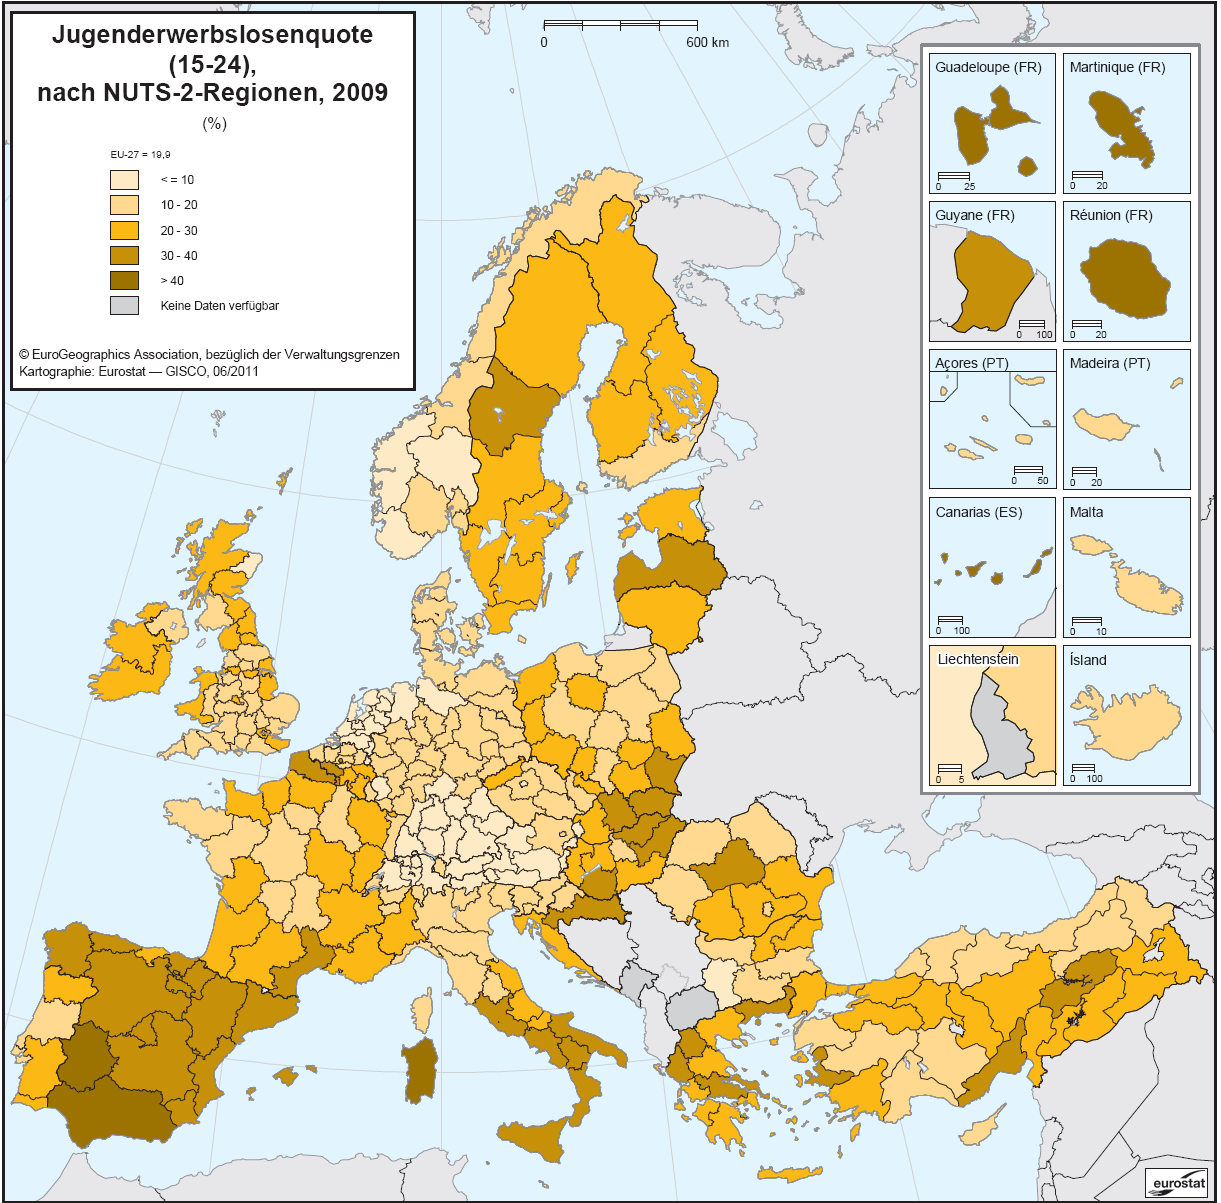
336 KB | Karte 6: Jugenderwerbslosenquote (15-24), nach NUTS-2-Regionen, 2009 (%) - Quelle: Eurostat (online Datenkode: lfst_r_lfu3rt) | 1 |
| 11:46, 6 February 2012 | Dispersion of employment and unemployment rates, by NUTS 2 regions, 2007-09.PNG (file) |  |
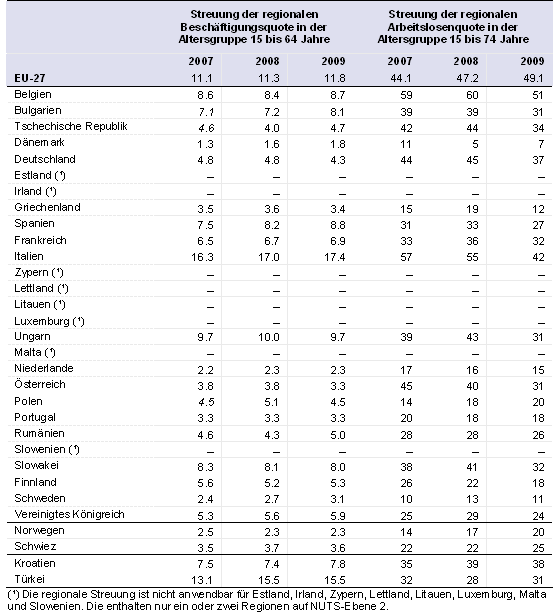
26 KB | Tabelle 2: Streuung der regionalen Beschäftigungs- und Arbeitslosenquoten, nach NUTS-2-Regionen, 2007–09 (Variationskoeffizient) - Quelle: Eurostat (online Datenkode: lfst_r_lmder and lfst_r_lmdur) | 3 |
| 11:54, 6 February 2012 | Unemployment rate, national level, 2004-09 (%)-de.PNG (file) | -de.PNG) |
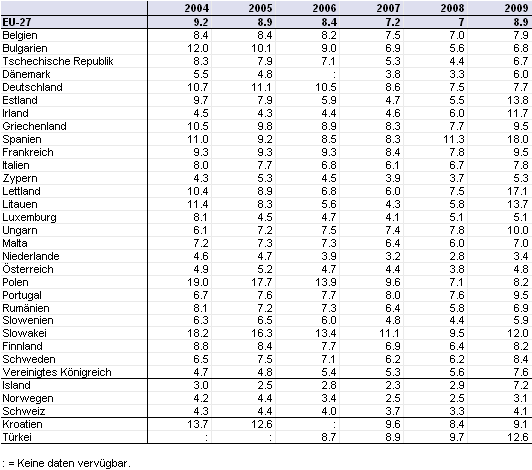
20 KB | Tabelle 1: Arbeitslosenquote, nationale Ebene, 2004–09 (%) - Quelle: Eurostat (online Datenkode: lfst_r_lfu3rt) | 4 |
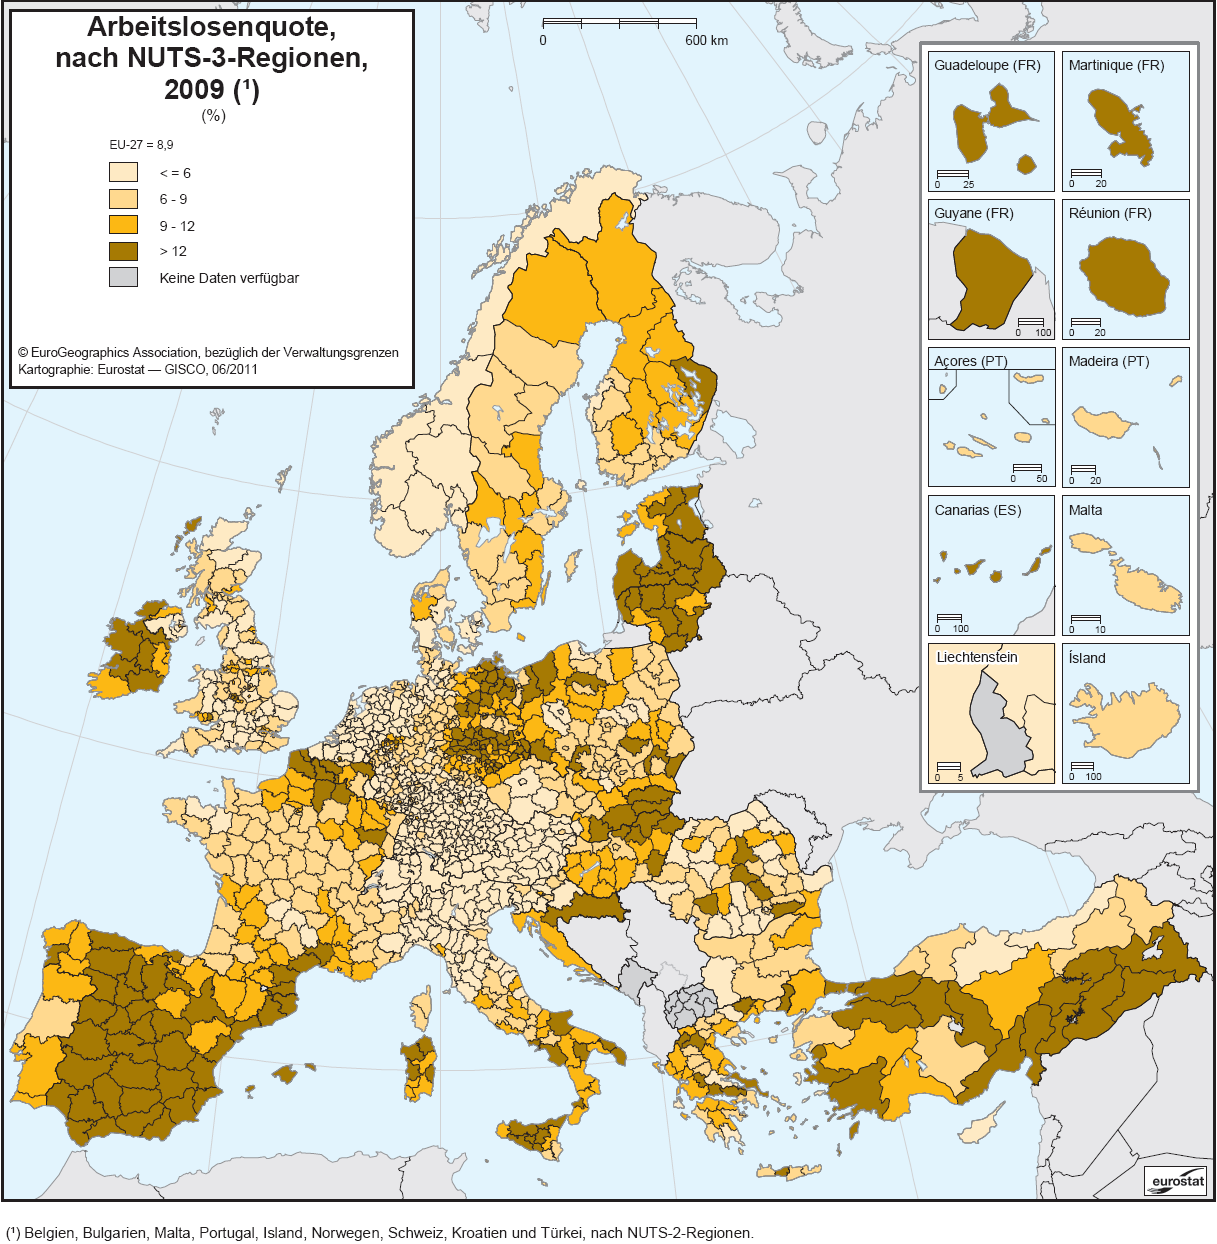
| 12:04, 6 February 2012 | Unemployment rate, by NUTS 3 regions, 2009 (%)-de.PNG (file) | -de.PNG) |
418 KB | (Karte 3: Arbeitslosenquote, nach NUTS-3-Regionen, 2009 (1) (%) - Quelle: Eurostat (online Datenkode: lfst_r_lfu3rt) | 3 |
| 12:27, 6 February 2012 | Dispersion of employment and unemployment rates, by NUTS 2 regions, 2007-09-de.PNG (file) |  |
26 KB | Tabelle 2: Streuung der regionalen Beschäftigungs- und Arbeitslosenquoten, nach NUTS-2-Regionen, 2007–09 (Variationskoeffizient) - Quelle: Eurostat (online Datenkode: lfst_r_lmder and lfst_r_lmdur) | 1 |
| 13:38, 6 February 2012 | Hourly labour cost (excluding apprentices), by NUTS 1 regions, 2008-de.PNG (file) | ,_by_NUTS_1_regions,_2008-de.PNG) |
294 KB | Karte 1: Arbeitskosten je geleistete Stunde (ohne Auszubildende), nach NUTS-1-Regionen, 2008 (¹) - Quelle: Eurostat (online Datenkode: lc_r08cost_r2 und lc_n08cost_r1) | 2 |
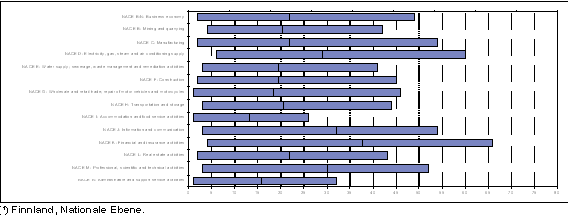
| 14:53, 6 February 2012 | Hourly labour costs by economic activity, highest and lowest NUTS 1 region in EU-27, 2008-de.PNG (file) |  |
9 KB | Abbildung 1: Arbeitskosten je geleistete Stunde in den jeweiligen Wirtschaftsbereichen, höchste und niedrigste NUTS-1 Region in EU-27, 2008 (¹), (EUR pro Stunde) - Quelle: Eurostat (online Datenkode: lc_r08cost_r2) | 1 |
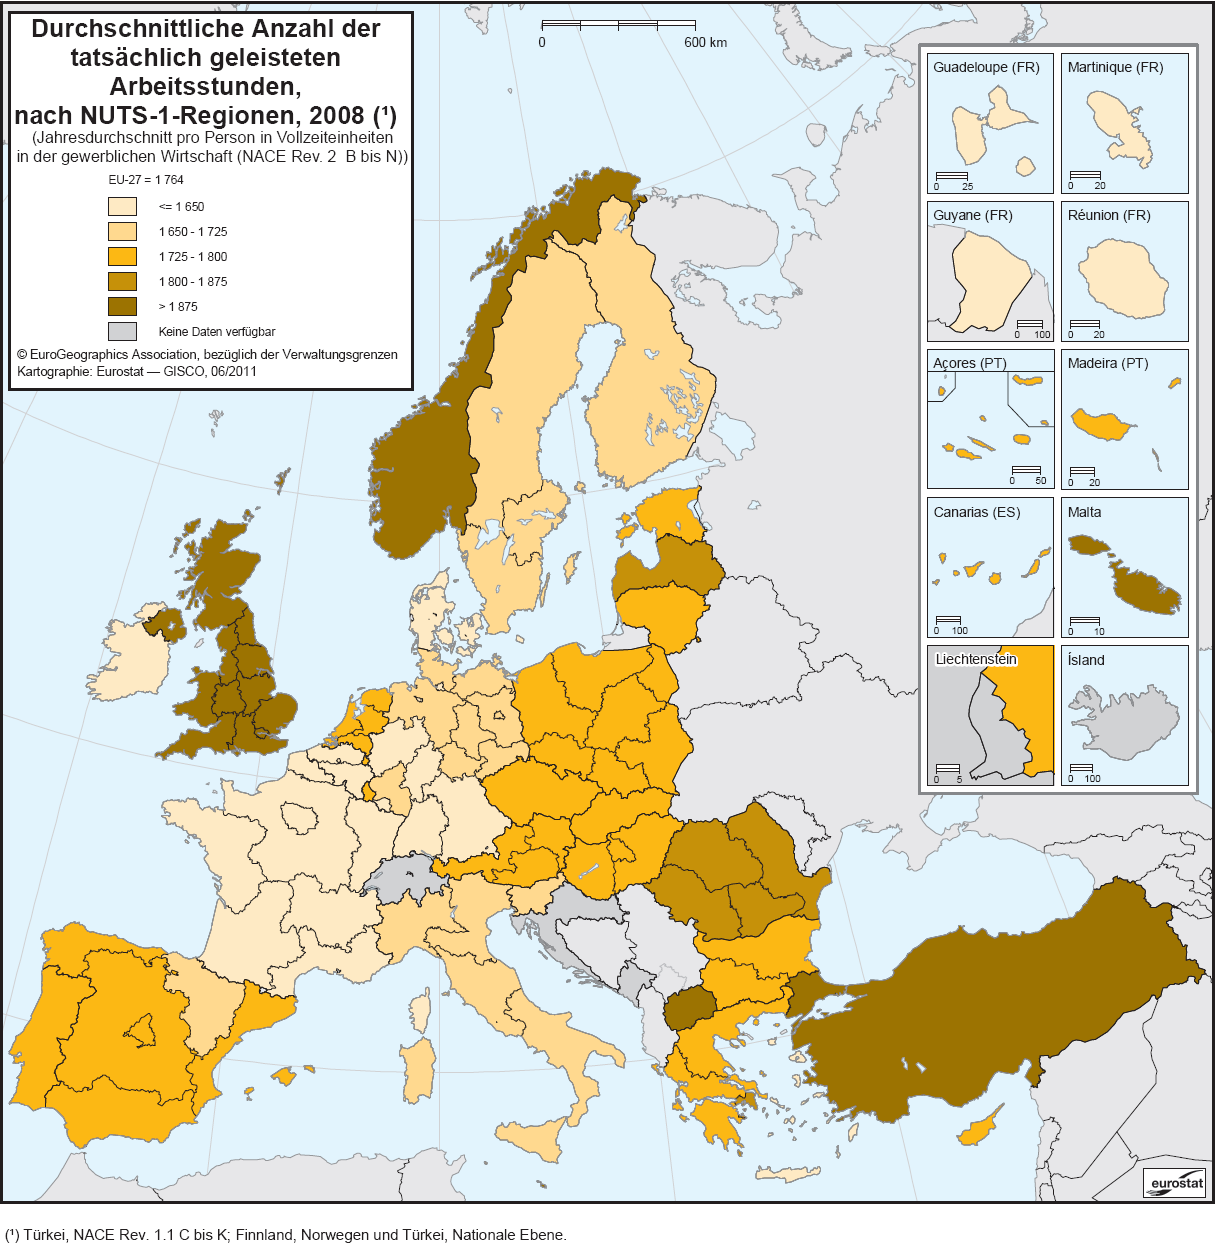
| 15:04, 6 February 2012 | Average hours actually worked, by NUTS 1 regions, 2008-de.PNG (file) |  |
296 KB | Karte 2: Durchschnittliche Anzahl der tatsächlich geleisteten Arbeitsstunden, nach NUTS-1-Regionen, 2008 (¹) - Quelle: Eurostat (online Datenkode: lc_r08num2_r2 und lc_n08num2_r1) | 1 |
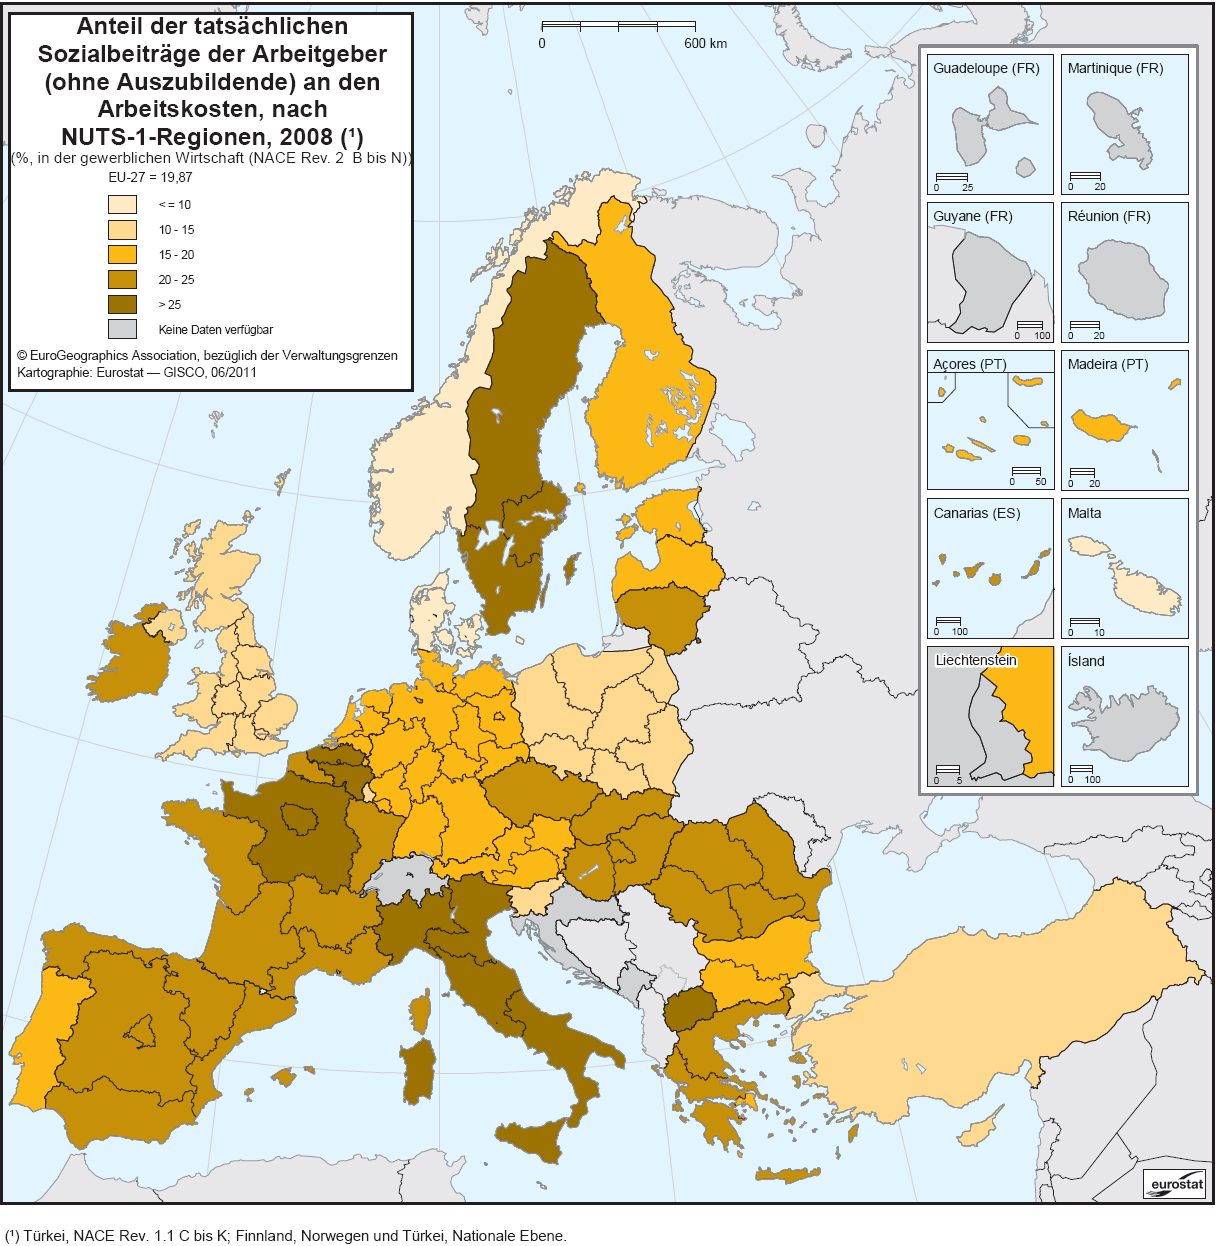
| 15:18, 6 February 2012 | Share of employers’ actual social contributions (excluding apprentices) in total labour cost, by NUTS 1 regions, 2008-de.PNG (file) | _in_total_labour_cost,_by_NUTS_1_regions,_2008-de.PNG) |
293 KB | Karte 3: Anteil der tatsächlichen Sozialbeiträge der Arbeitgeber (ohne Auszubildende) an den Arbeitskosten, nach NUTS-1-Regionen, 2008 (¹) - Quelle: Eurostat (online Datenkode: lc_n08struc_r2 und lc_n08struc_r1) | 1 |
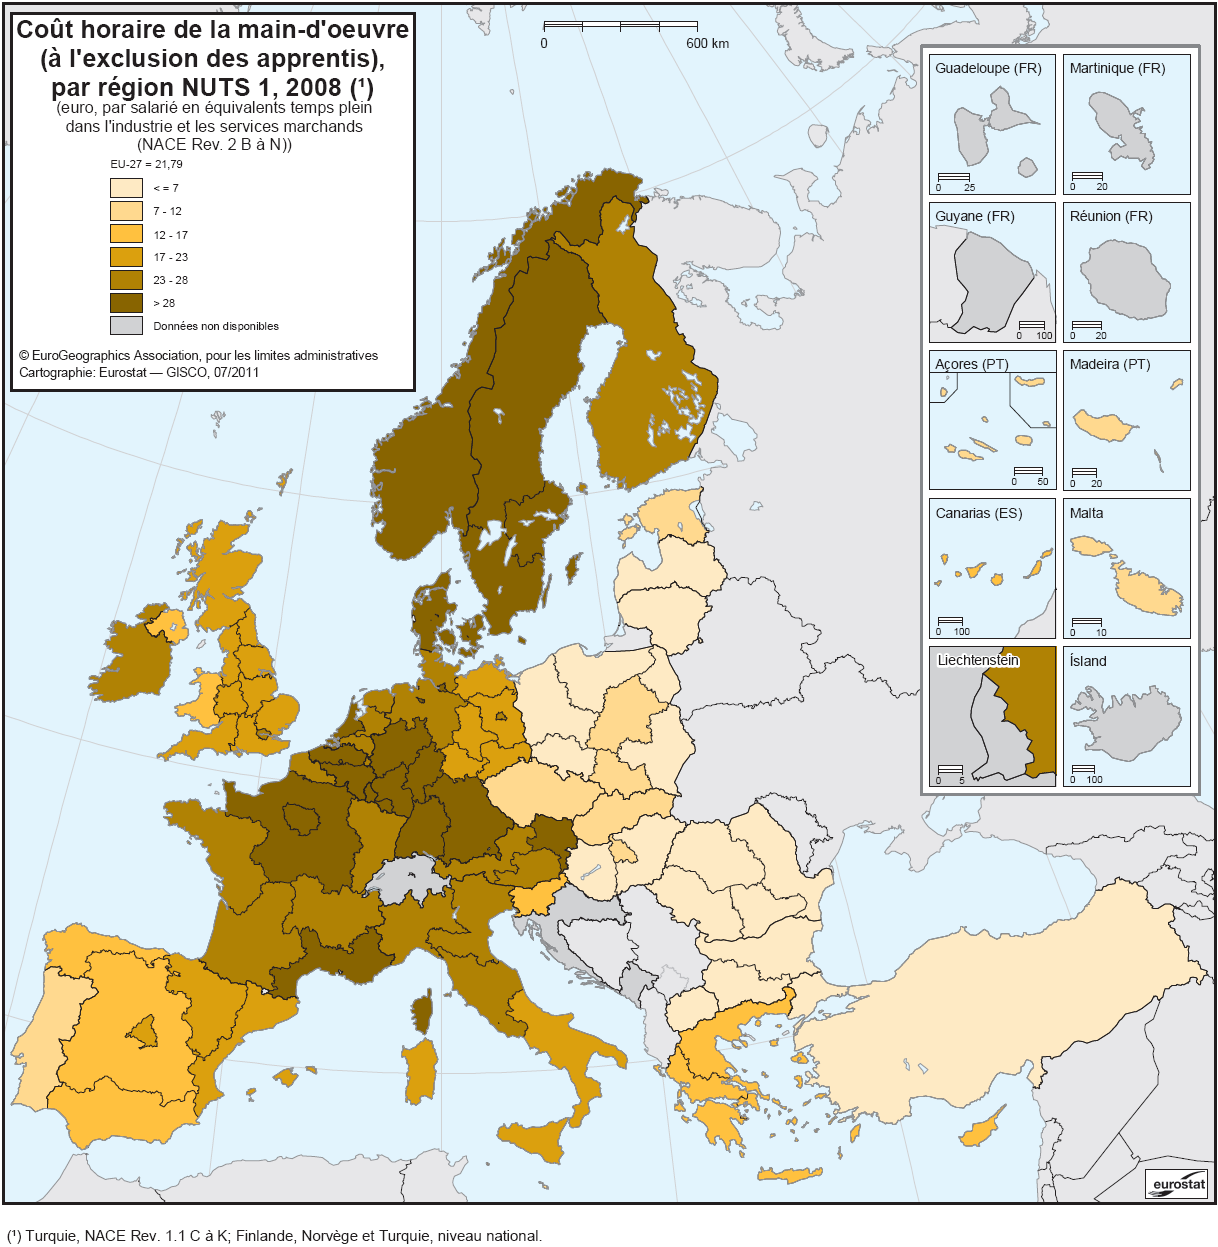
| 13:14, 7 February 2012 | Hourly labour cost (excluding apprentices), by NUTS 1 regions, 2008-fr.PNG (file) | ,_by_NUTS_1_regions,_2008-fr.PNG) |
294 KB | Carte 1: Coût horaire de la main-d'oeuvre (à l'exclusion des apprentis), par région NUTS 1, 2008 (¹) - Source: Eurostat (code des données en ligne: lc_r08cost_r2 et lc_n08cost_r1) | 1 |
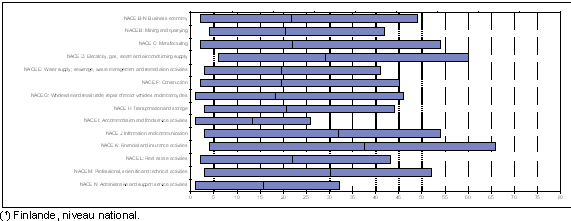
| 13:20, 7 February 2012 | Hourly labour costs by economic activity, highest and lowest NUTS 1 region in EU-27, 2008-fr.PNG (file) |  |
10 KB | Graphique 1: Coût horaire de la main-d'œuvre par activité économique, valeurs maximale et minimale des régions NUTS 1 dans EU-27, 2008 (EUR par heure) - Source: Eurostat (code des données en ligne: lc_r08cost_r2) | 1 |
| 13:28, 7 February 2012 | Average hours actually worked, by NUTS 1 regions, 2008-fr.PNG (file) |  |
293 KB | Carte 2: Moyenne d'heures effectivement travaillées, par région NUTS 1, 2008 (¹) - Source: Eurostat (code des données en ligne: lc_r08num2_r2 et lc_n08num2_r1) | 1 |
| 13:35, 7 February 2012 | Share of employers’ actual social contributions (excluding apprentices) in total labour cost, by NUTS 1 regions, 2008-fr.PNG (file) | _in_total_labour_cost,_by_NUTS_1_regions,_2008-fr.PNG) |
294 KB | Carte 3: Part des cotisations sociales effectives à la charge de l'employeur (à l'exclusion de celles des apprentis) dans le coût de la main-d'oeuvre, par région NUTS 1, 2008 (¹) - Source: Eurostat (code des données en ligne: lc_n08struc_r2 et lc_n0 | 1 |
| 13:07, 8 February 2012 | Population density, by NUTS 3 regions, 2008-de.PNG (file) |  |
441 KB | Karte 1: Bevölkerungsdichte, nach NUTS-3-Regionen, 2008 (Einwohner je km²) - Quelle: Eurostat (online Datenkode: demo_r_d3dens) | 1 |
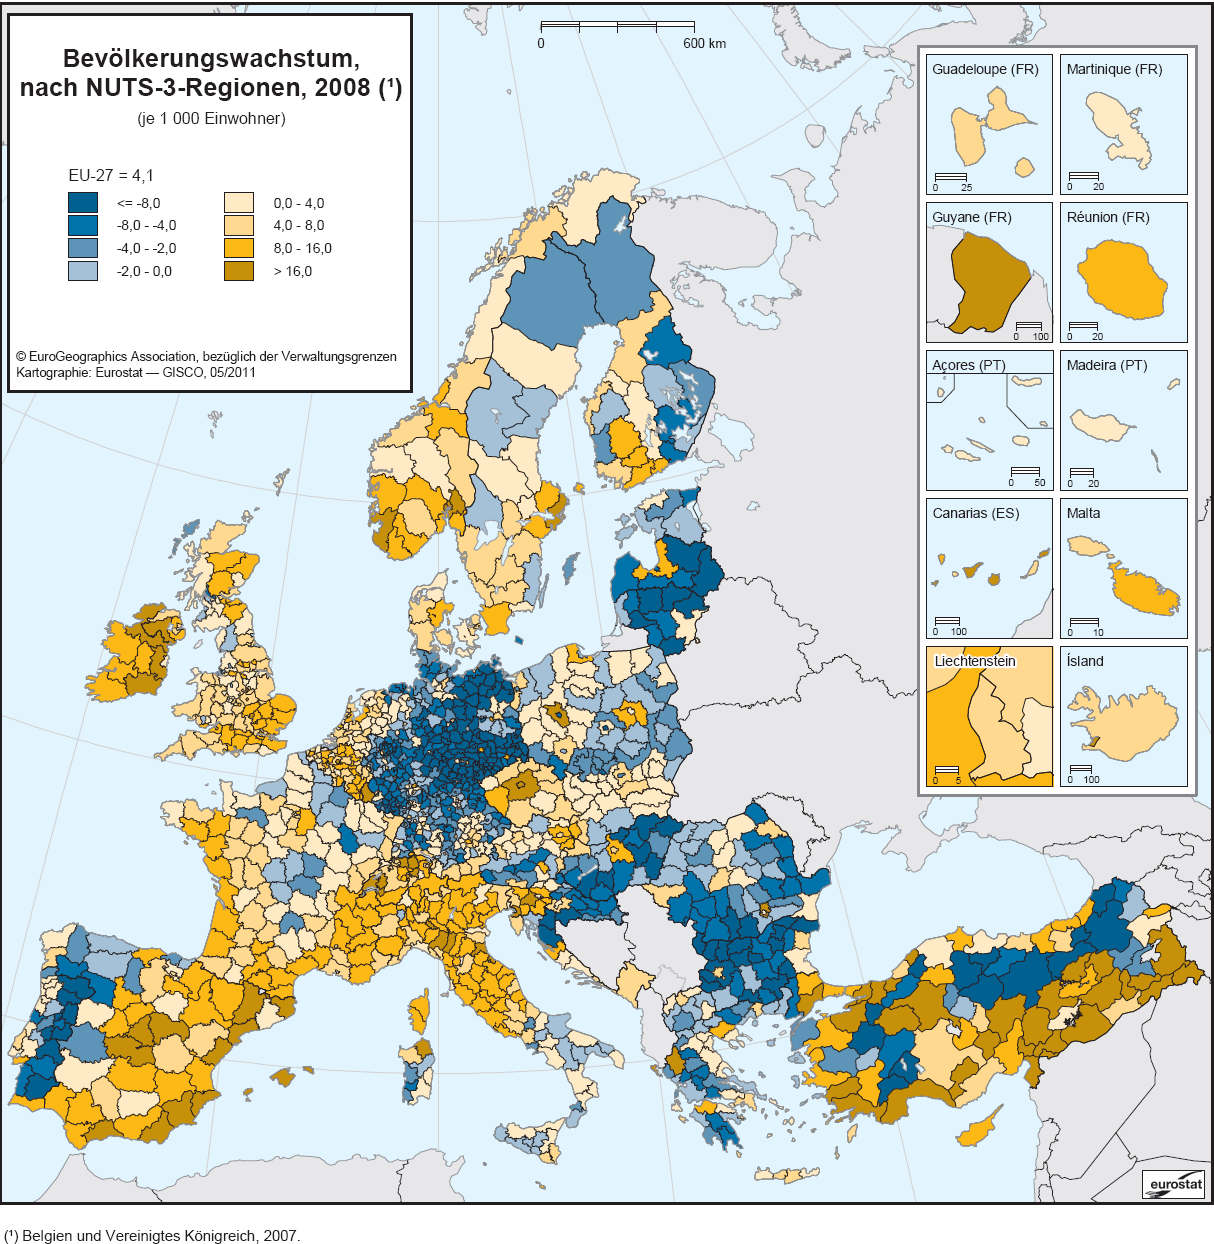
| 13:35, 8 February 2012 | Population change, by NUTS 3 regions, 2008-de.PNG (file) |  |
453 KB | Karte 2: Bevölkerungswachstum, nach NUTS-3-Regionen, 2008 (je 1 000 Einwohner) - Quelle: Eurostat (online Datenkode: demo_r_gind3) | 2 |
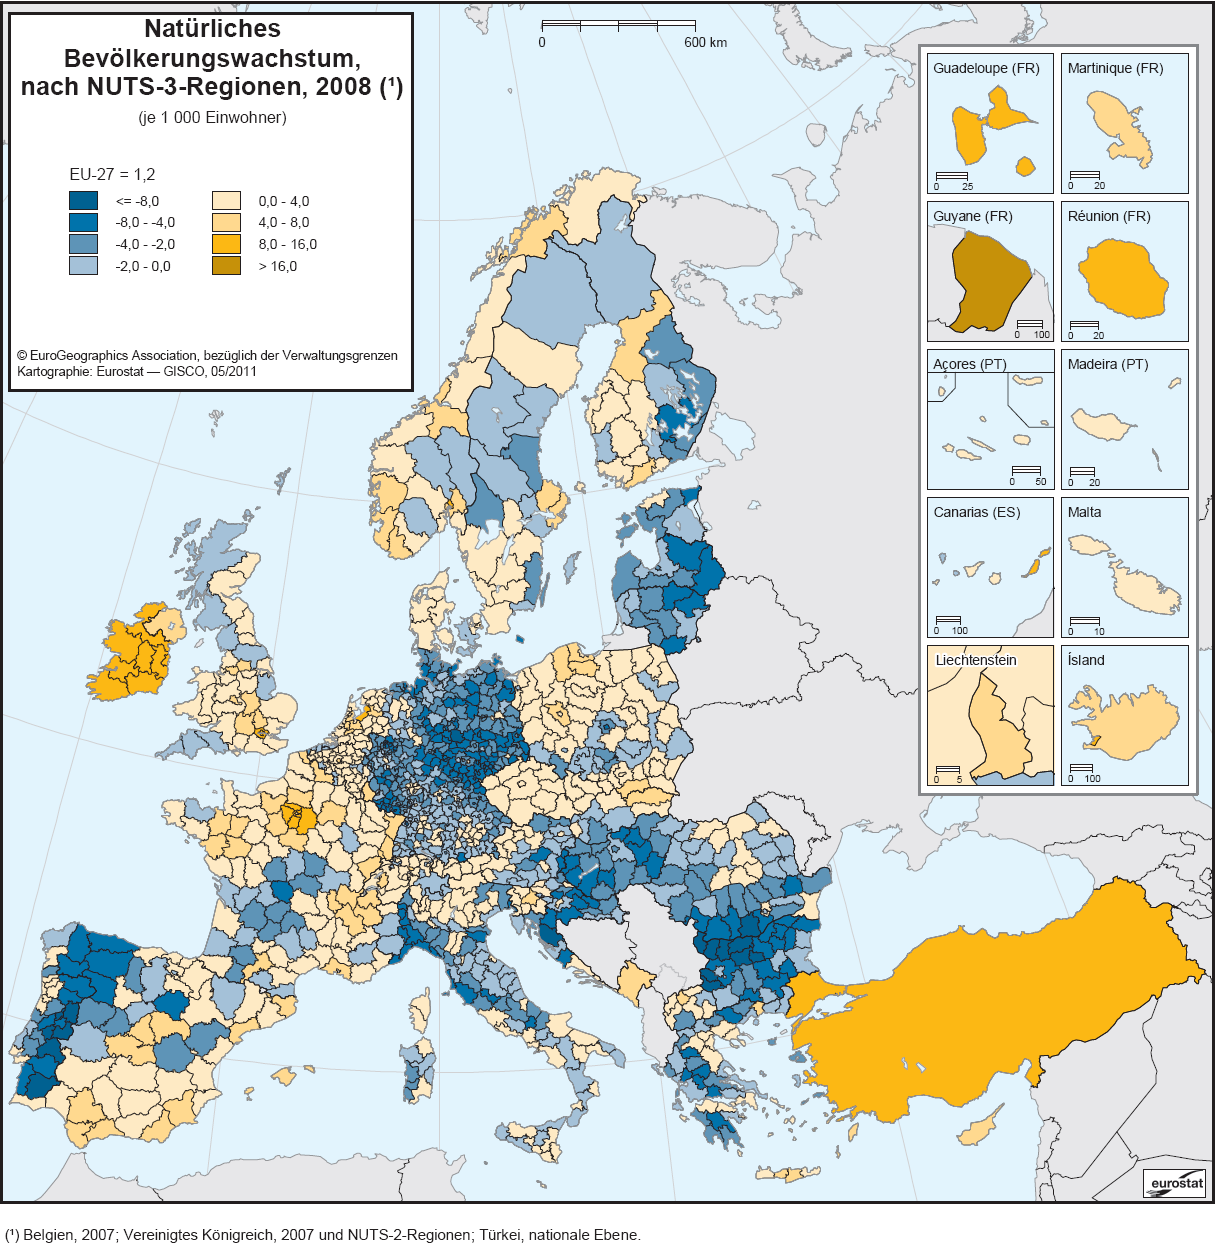
| 13:48, 8 February 2012 | Natural population change, by NUTS 3 regions, 2008-de.PNG (file) |  |
421 KB | Karte 3: Natürliches Bevölkerungswachstum, nach NUTS-3-Regionen, 2008 (je 1 000 Einwohner) - Quelle: Eurostat (online Datenkode: demo_r_gind3 und demo_gind) | 1 |
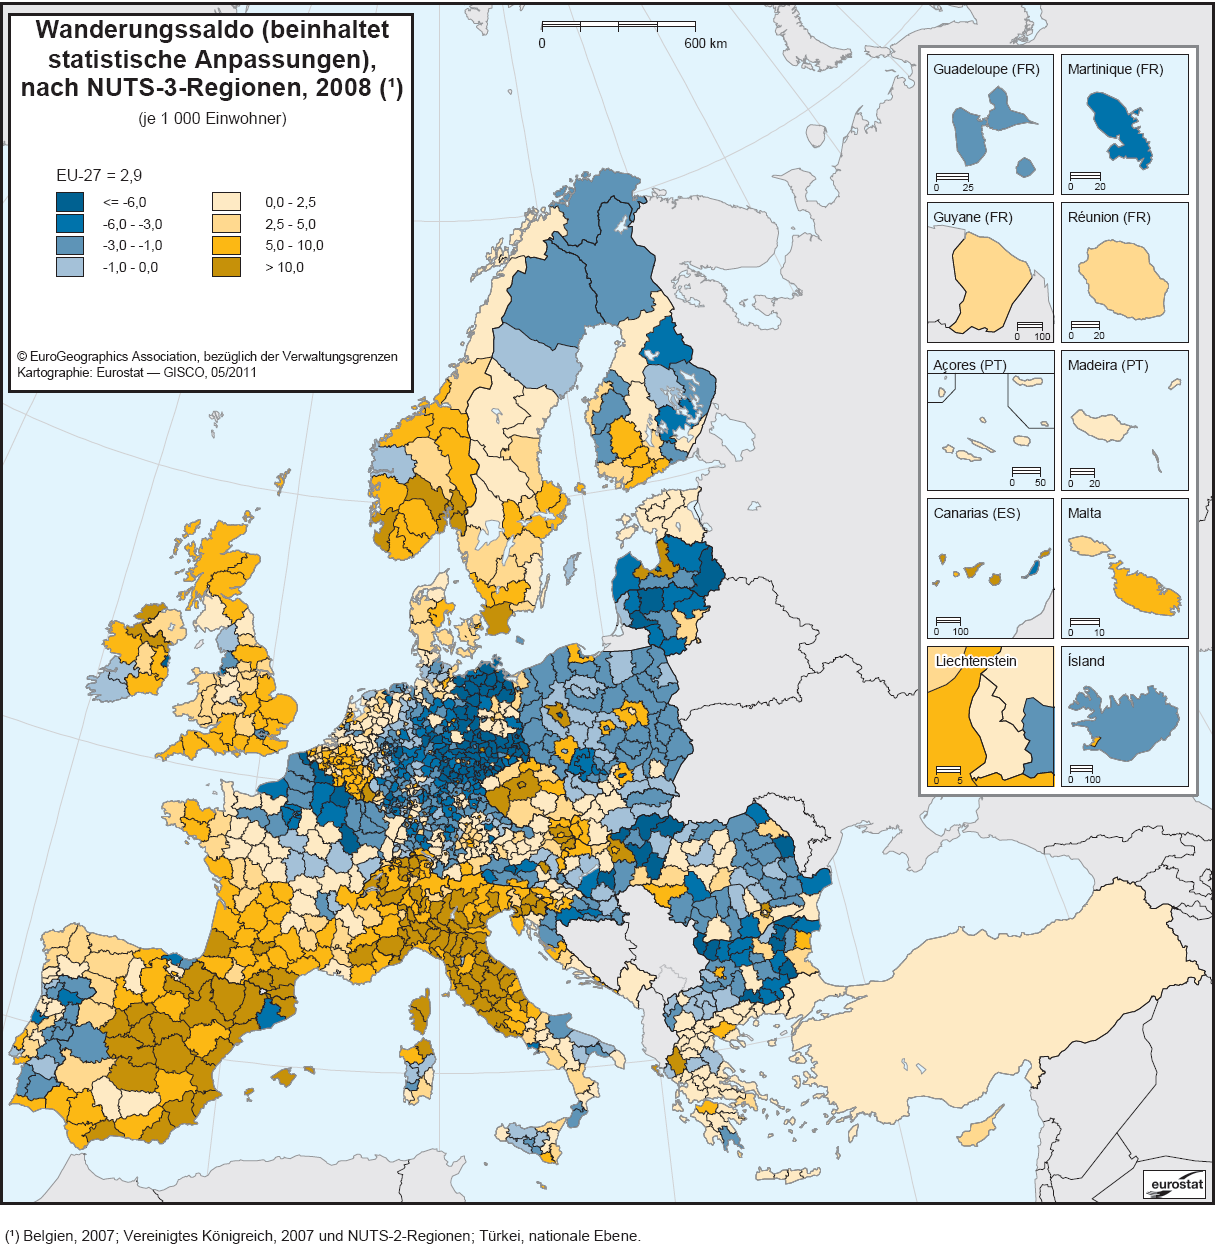
| 13:59, 8 February 2012 | Net migration (including statistical adjustment), by NUTS 3 regions, 2008-de.PNG (file) | ,_by_NUTS_3_regions,_2008-de.PNG) |
429 KB | Karte 4: Wanderungssaldo (beinhaltet statistische Anpassungen), nach NUTS-3-Regionen, 2008 (je 1 000 Einwohner) - Quelle: Eurostat (online Datenkode: demo_r_gind3 und demo_gind) | 1 |
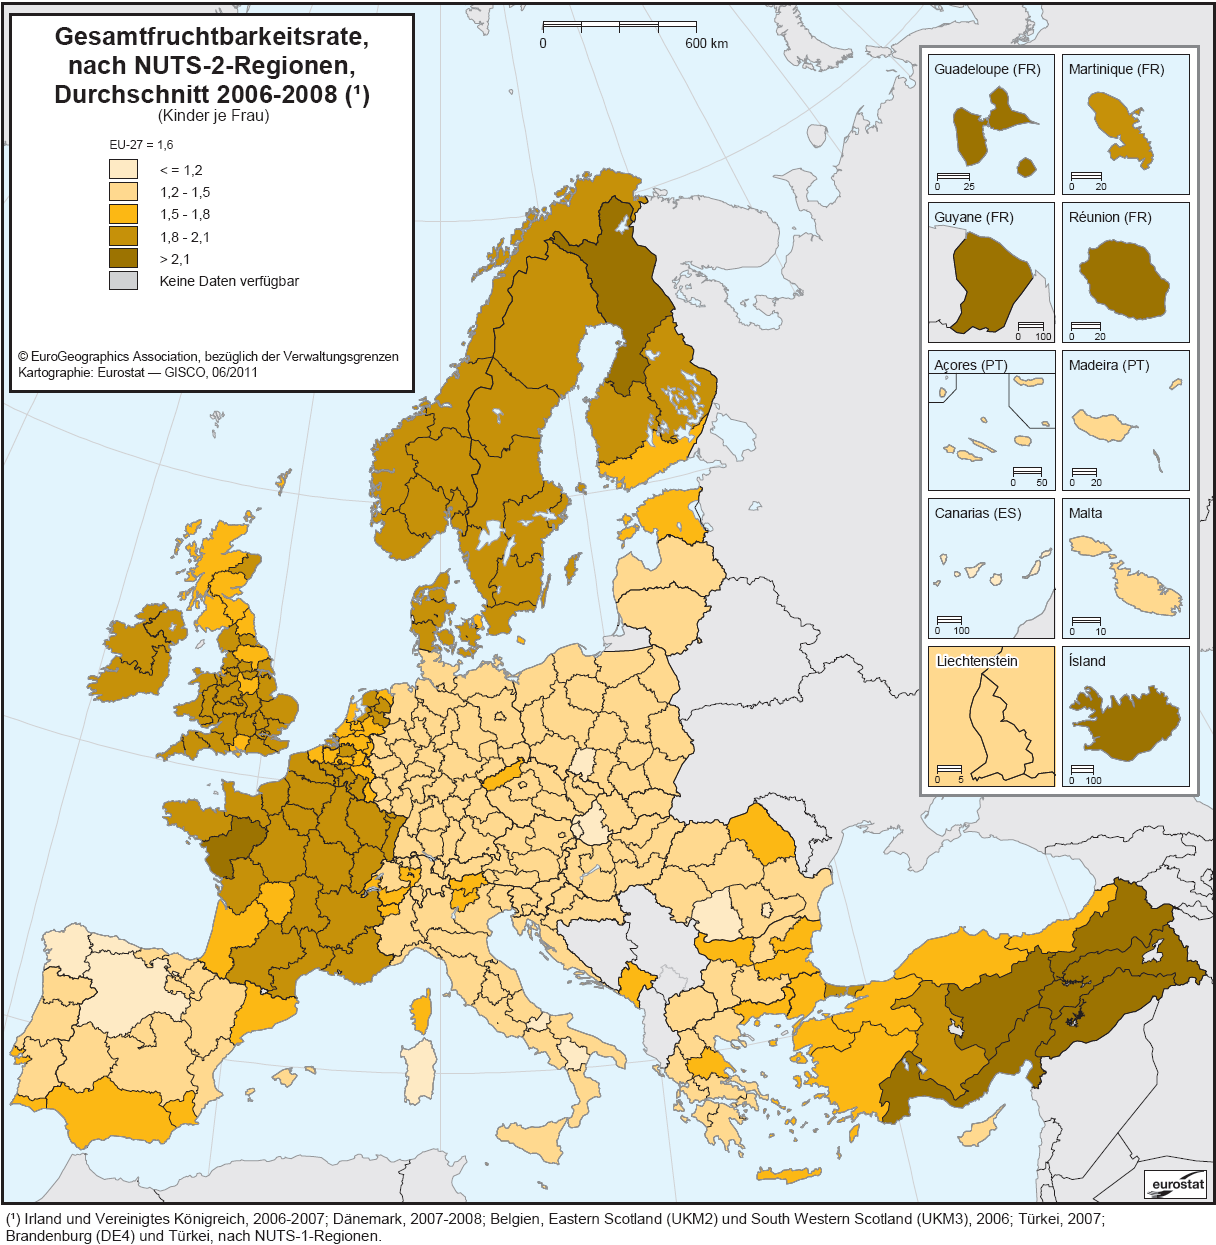
| 14:19, 8 February 2012 | Total fertility rate, by NUTS 2 regions, average 2006–08-de.PNG (file) |  |
339 KB | Karte 5: Gesamtfruchtbarkeitsrate, nach NUTS-2-Regionen, Durchschnitt 2006-2008 (Kinder je Frau) - Quelle: Eurostat (online Datenkode: demo_r_frate2) | 1 |
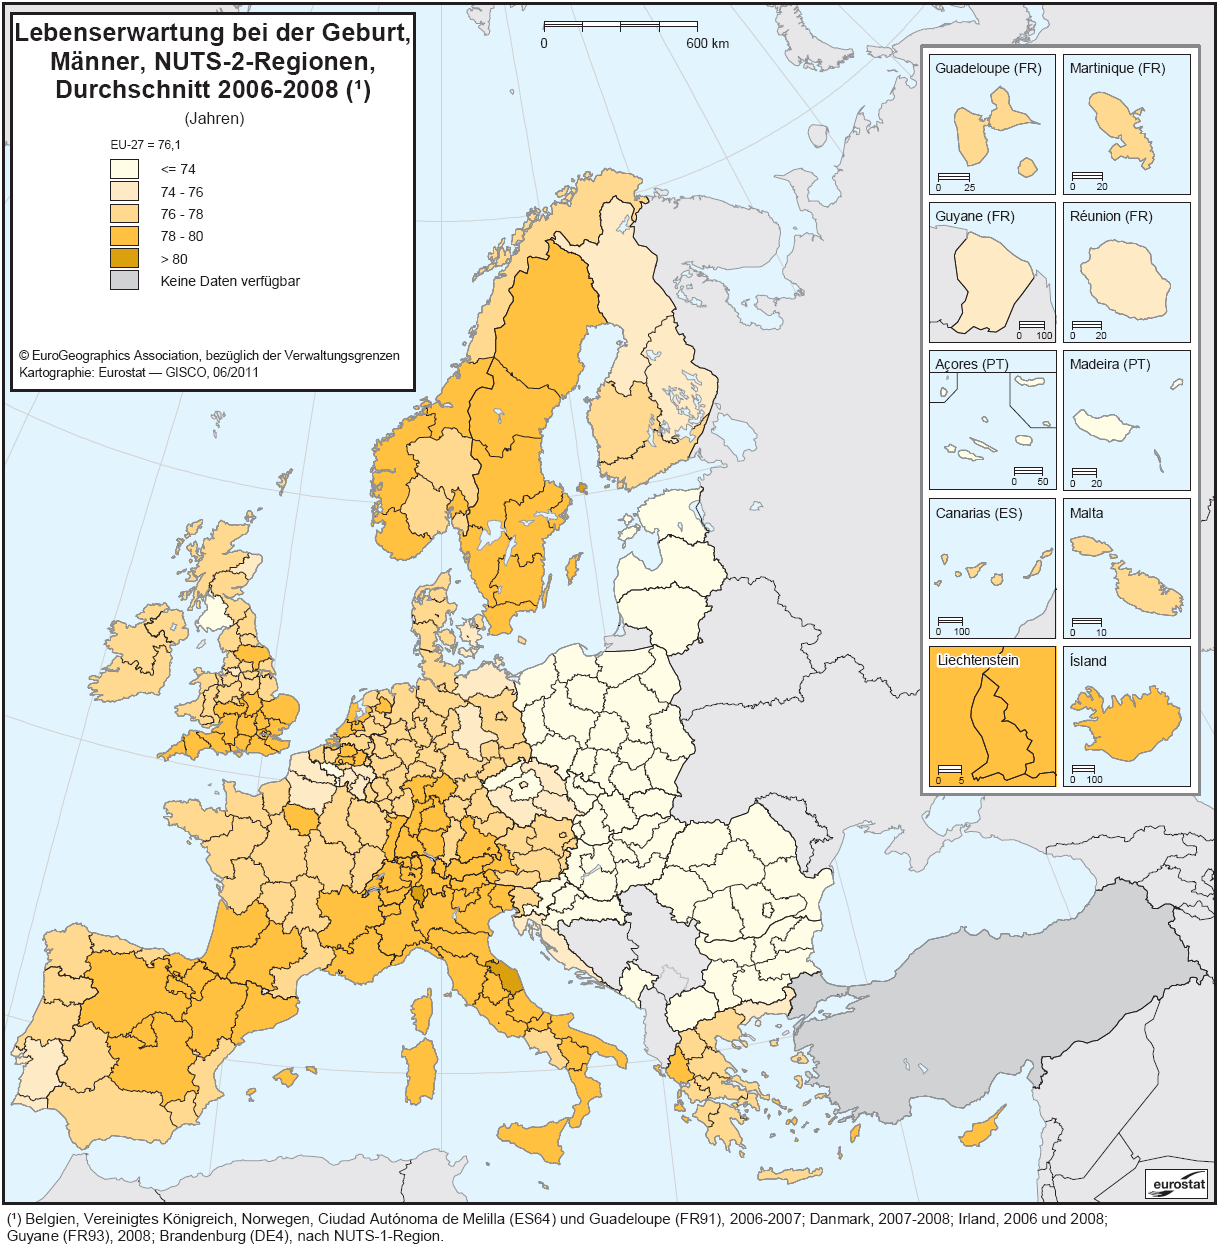
| 15:36, 8 February 2012 | Life expectancy at birth, males, by NUTS 2 regions, average 2006–08-de.PNG (file) |  |
331 KB | Karte 6: Lebenserwartung bei der Geburt, Männer, NUTS-2-Regionen, Durchschnitt 2006-2008 (Jahren) - Quelle: Eurostat (online Datenkode: demo_r_mlifexp) | 1 |
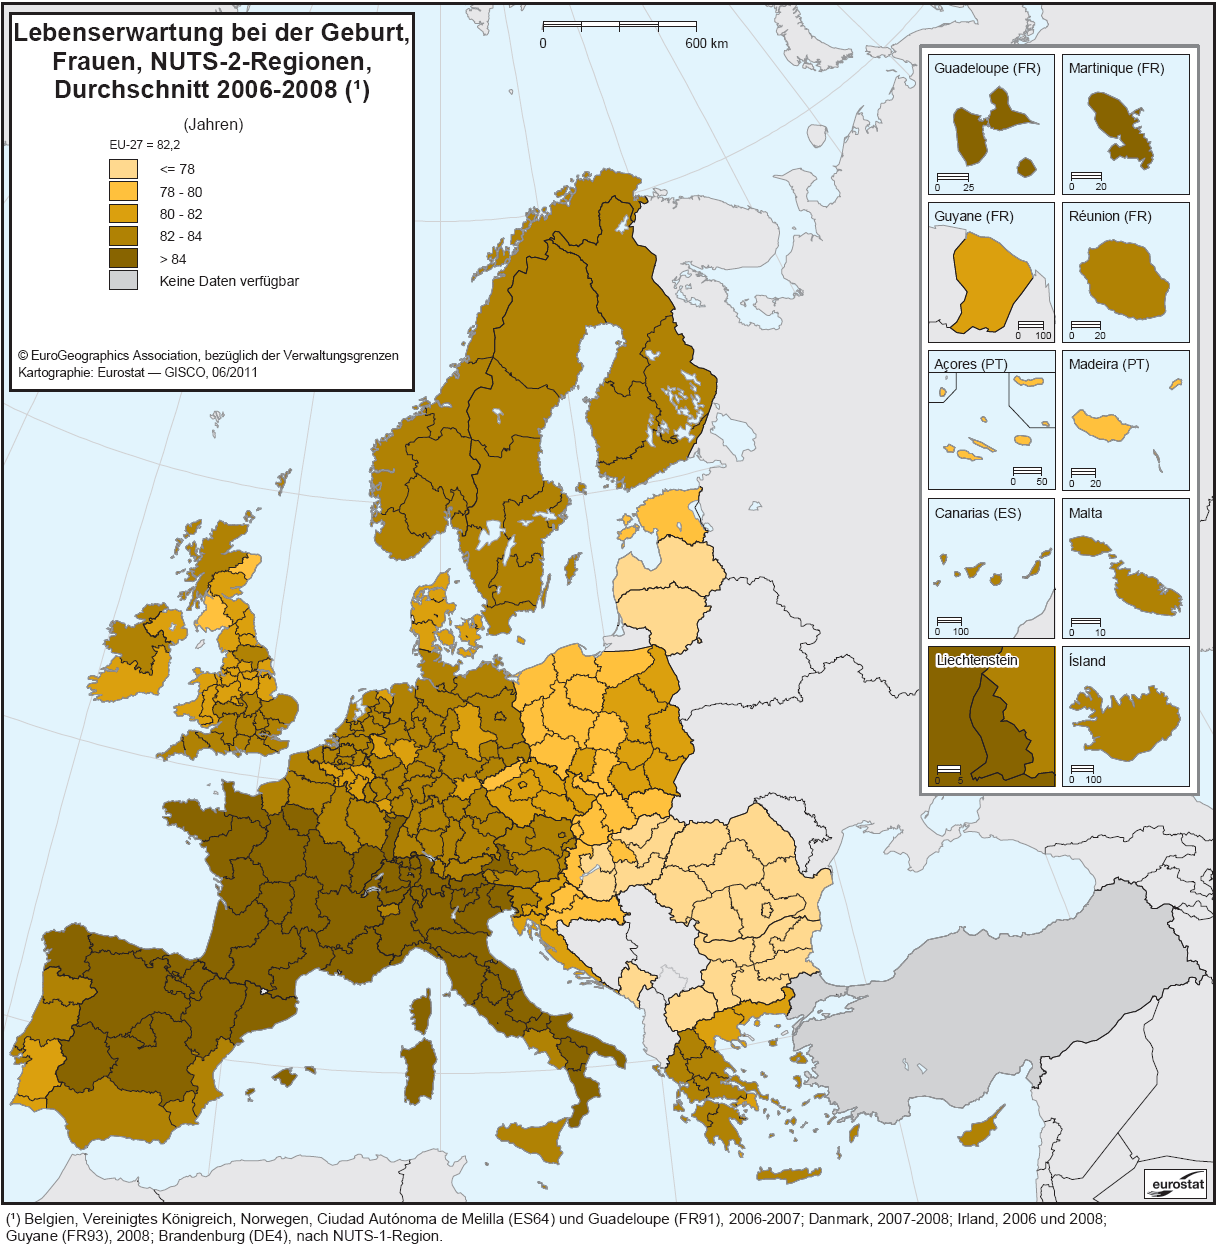
| 15:50, 8 February 2012 | Life expectancy at birth, females, by NUTS 2 regions, average 2006–08-de.PNG (file) |  |
328 KB | Karte 7: Lebenserwartung bei der Geburt, Frauen, NUTS-2-Regionen, Durchschnitt 2006-2008 (Jahren) - Quelle: Eurostat (online Datenkode: demo_r_mlifexp) | 1 |
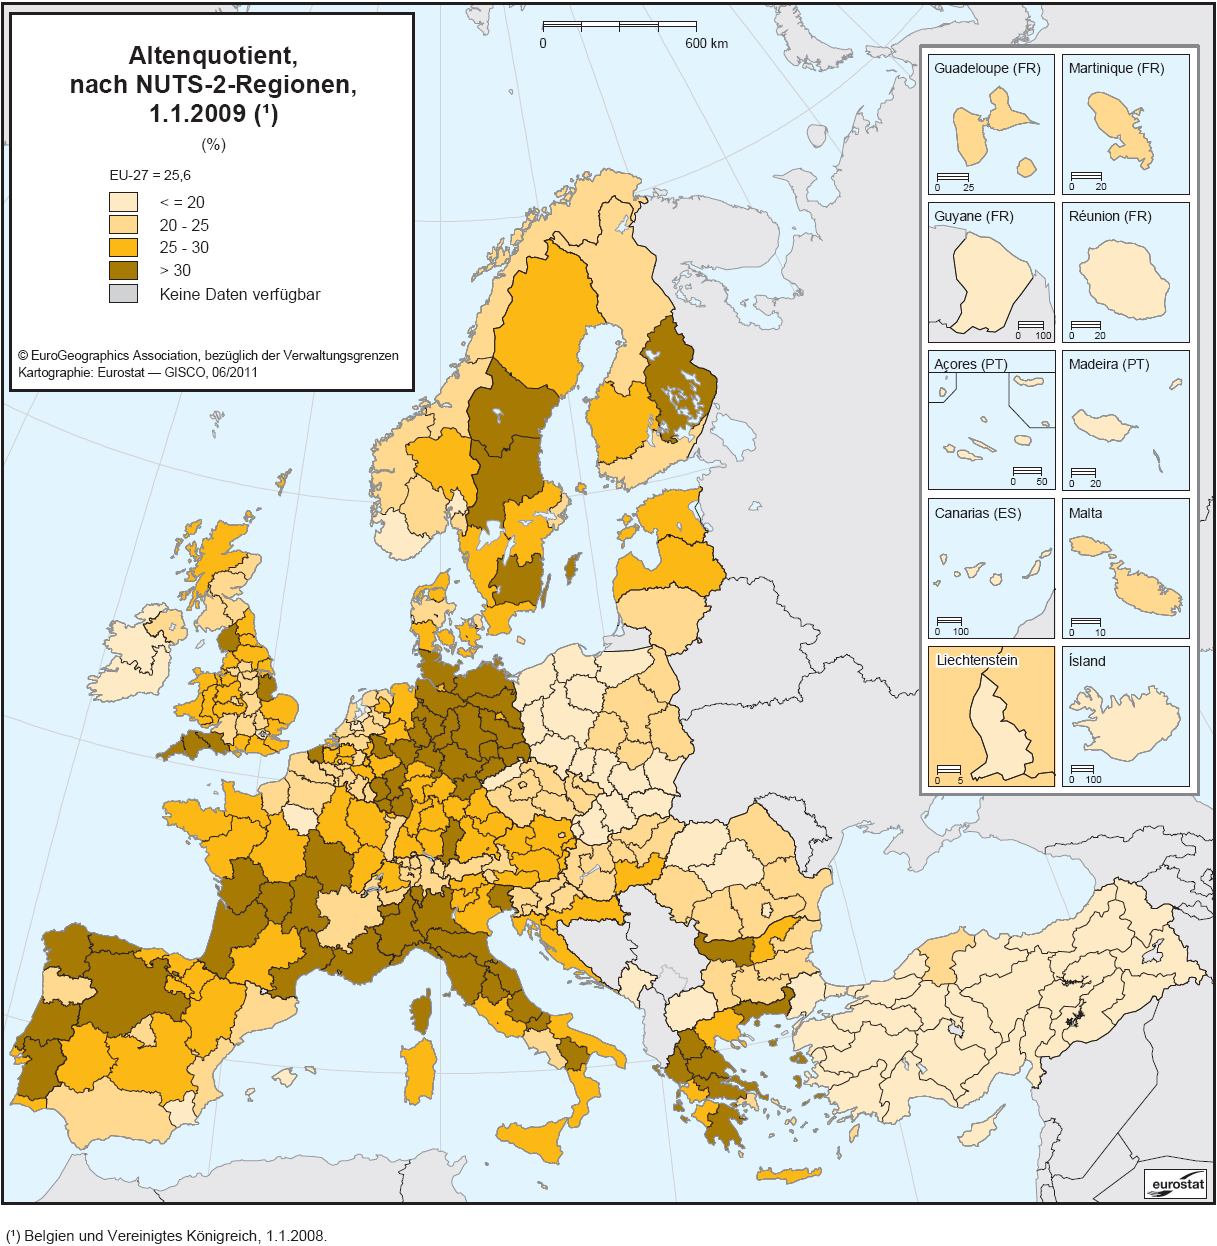
| 16:00, 8 February 2012 | Old-age dependency ratio, by NUTS 2 regions, 1 January 2009-de.PNG (file) |  |
340 KB | Karte 8: Altenquotient, nach NUTS-2-Regionen, 1.1.2009 (%) - Quelle: Eurostat (online Datenkode: demo_r_d2jan) | 1 |
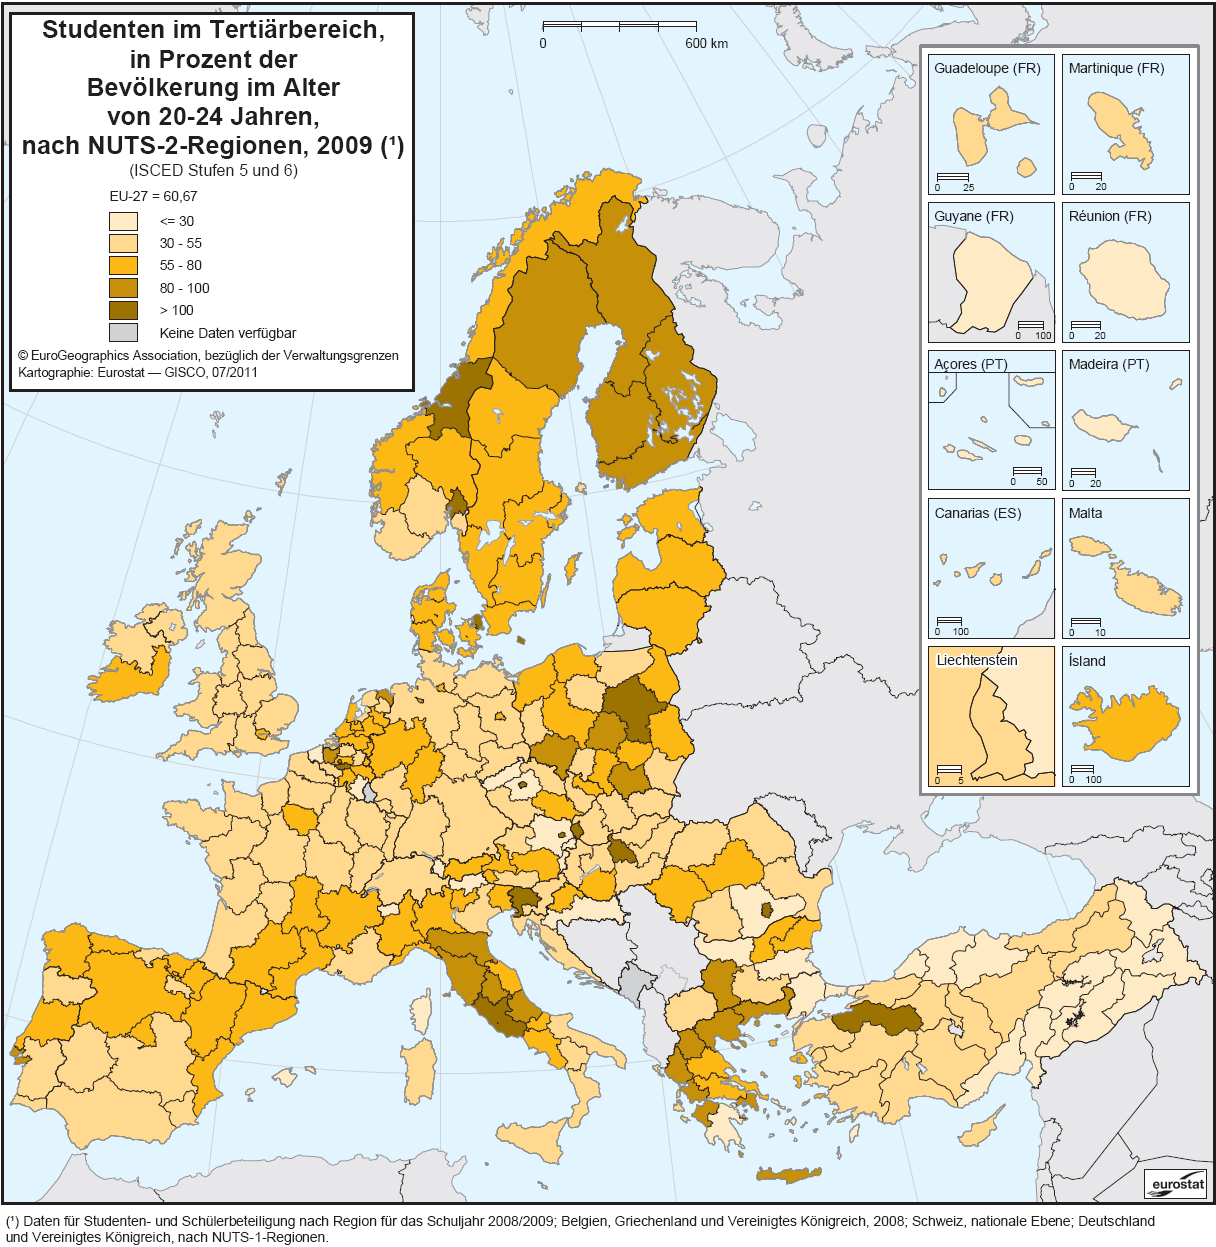
| 10:54, 9 February 2012 | Students in tertiary education, as a percentage of the population aged 20 to 24 years old, by NUTS 2 regions, 2009-de.PNG (file) |  |
339 KB | Karte 1: Studenten im Tertiärbereich, in Prozent der Bevölkerung im Alter von 20-24 Jahren, nach NUTS-2-Regionen, 2009 (ISCED Stufen 5 und 6) - Quelle: Eurostat (online Datenkode: tgs00094) | 1 |
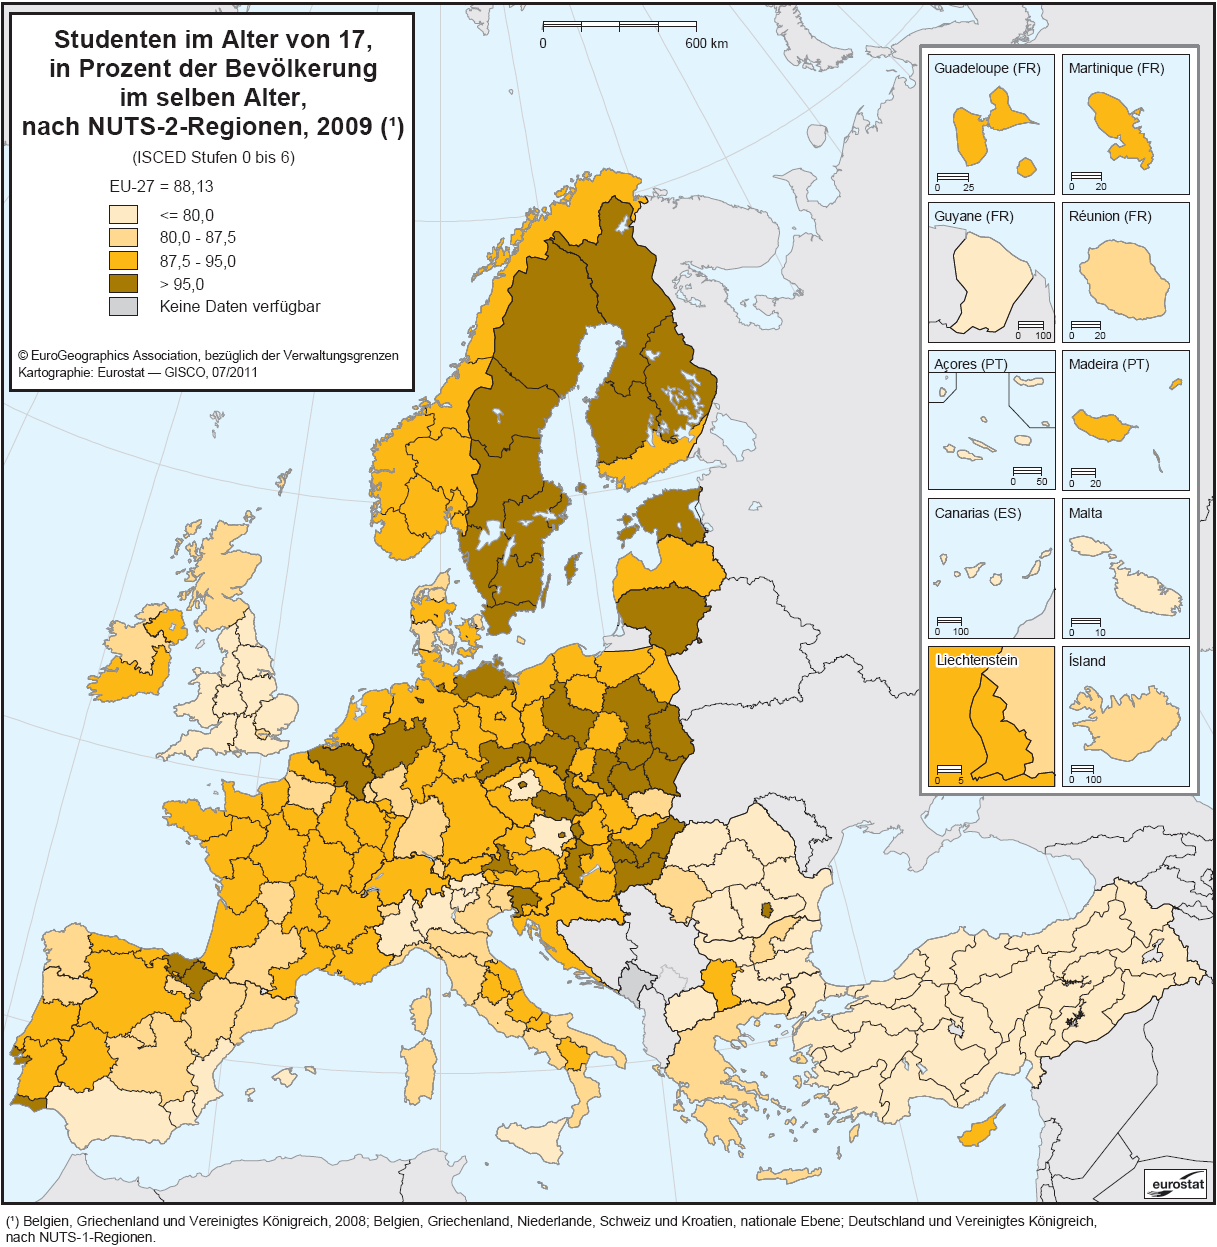
| 11:35, 9 February 2012 | Students aged 17, as a percentage of corresponding age population, by NUTS 2 regions, 2009-de.PNG (file) |  |
332 KB | Karte 2: Studenten im Alter von 17, in Prozent der Bevölkerung im selben Alter, nach NUTS-2-Regionen, 2009 (ISCED Stufen 0 bis 6) - Quelle: Eurostat (online Datenkode: tgs00091) | 1 |
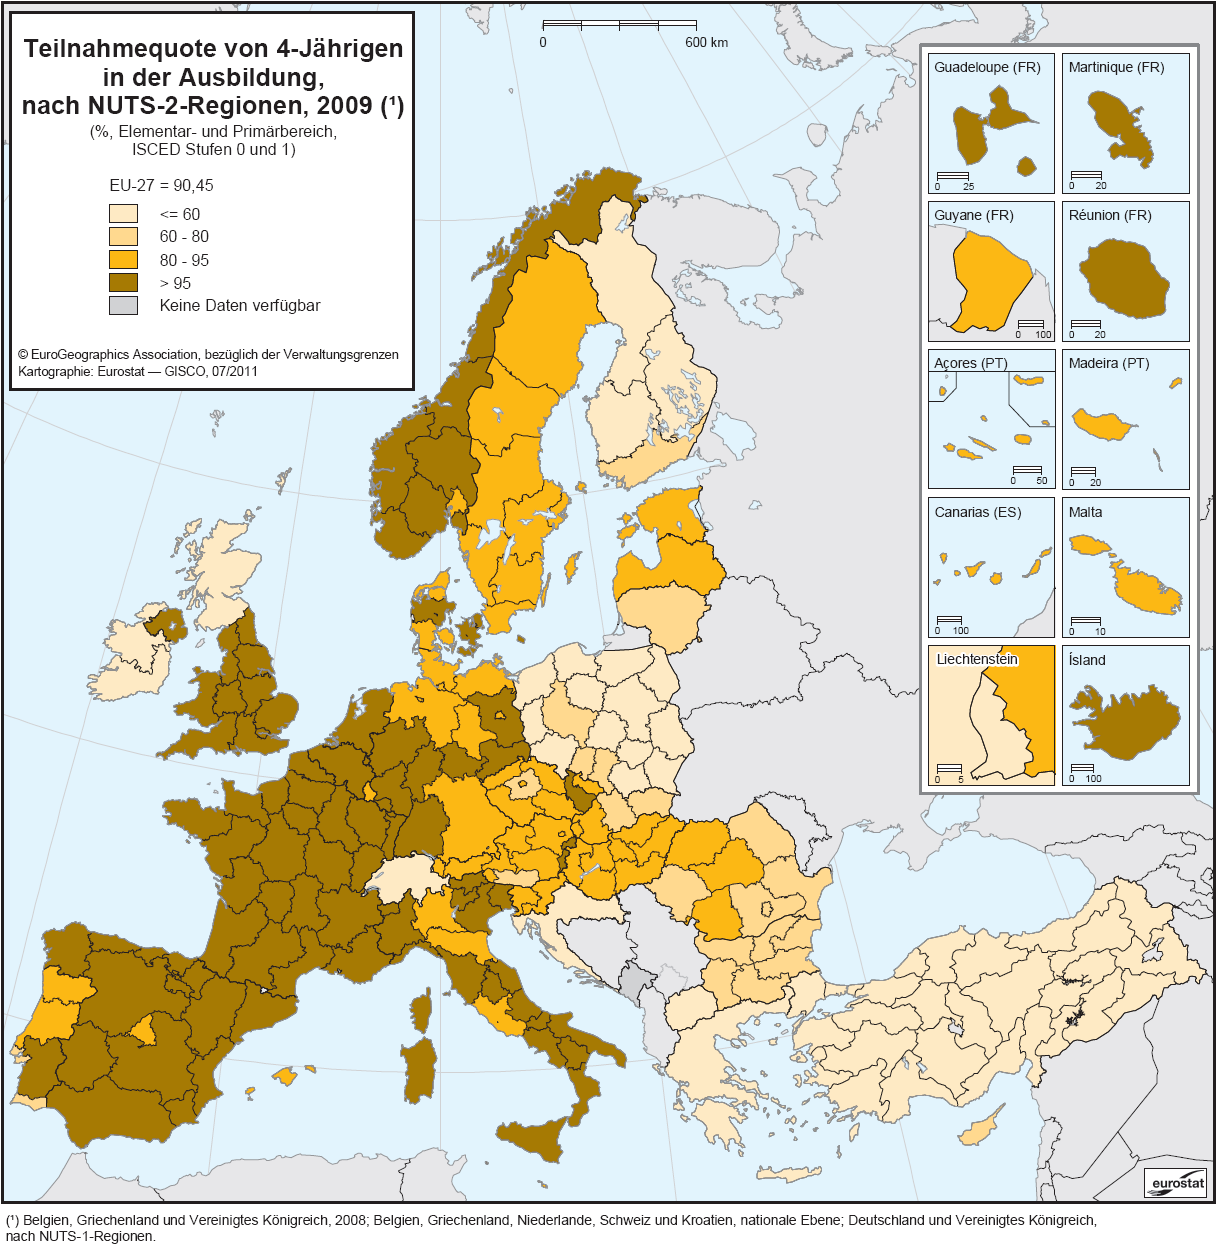
| 11:40, 9 February 2012 | Participations rates of 4-year-olds in education, by NUTS 2 regions, 2009-de.PNG (file) |  |
330 KB | Karte 3: Teilnahmequote von 4-Jährigen in der Ausbildung, nach NUTS-2-Regionen, 2009 (%, Elementar- und Primärbereich, ISCED Stufen 0 und 1) - Quelle: Eurostat (online Datenkode: tgs00092) | 1 |
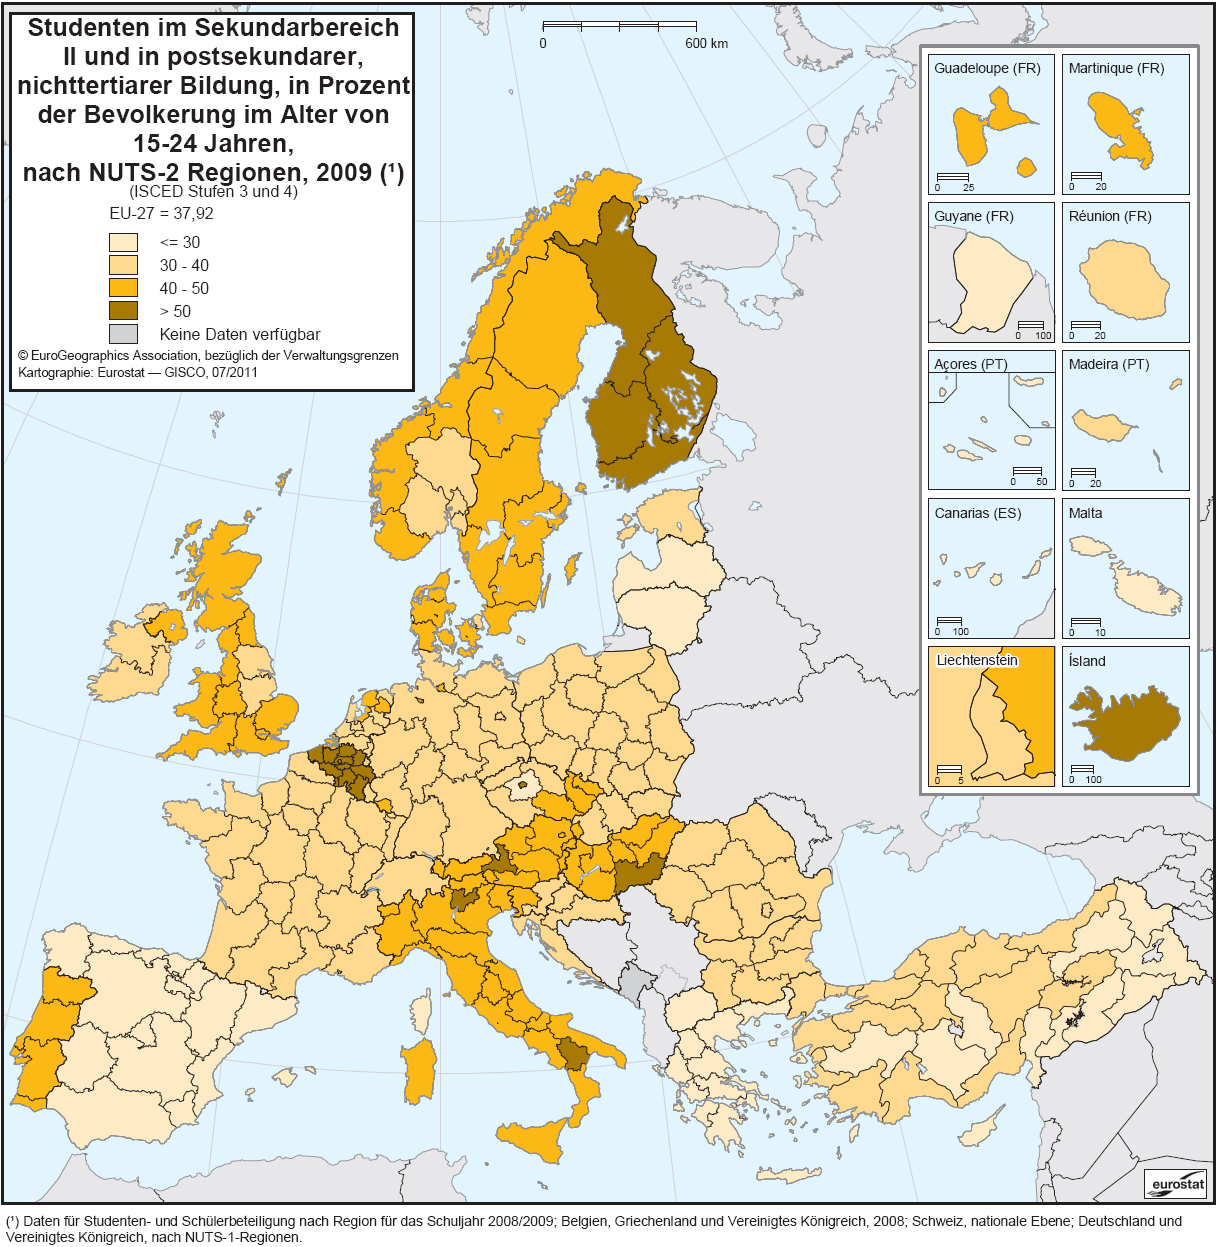
| 11:52, 9 February 2012 | Students at upper secondary and post-secondary non-tertiary education, as a percentage of the population aged 15 to 24, by NUTS 2 regions, 2009-de.PNG (file) |  |
338 KB | Karte 4: Studenten im Sekundarbereich II und in postsekundarer, nichttertiarer Bildung, in Prozent der Bevolkerung im Alter von 15-24 Jahren, nach NUTS-2 Regionen, 2009 (ISCED Stufen 3 und 4) - Quelle: Eurostat (online Datenkode: tgs00093) | 1 |
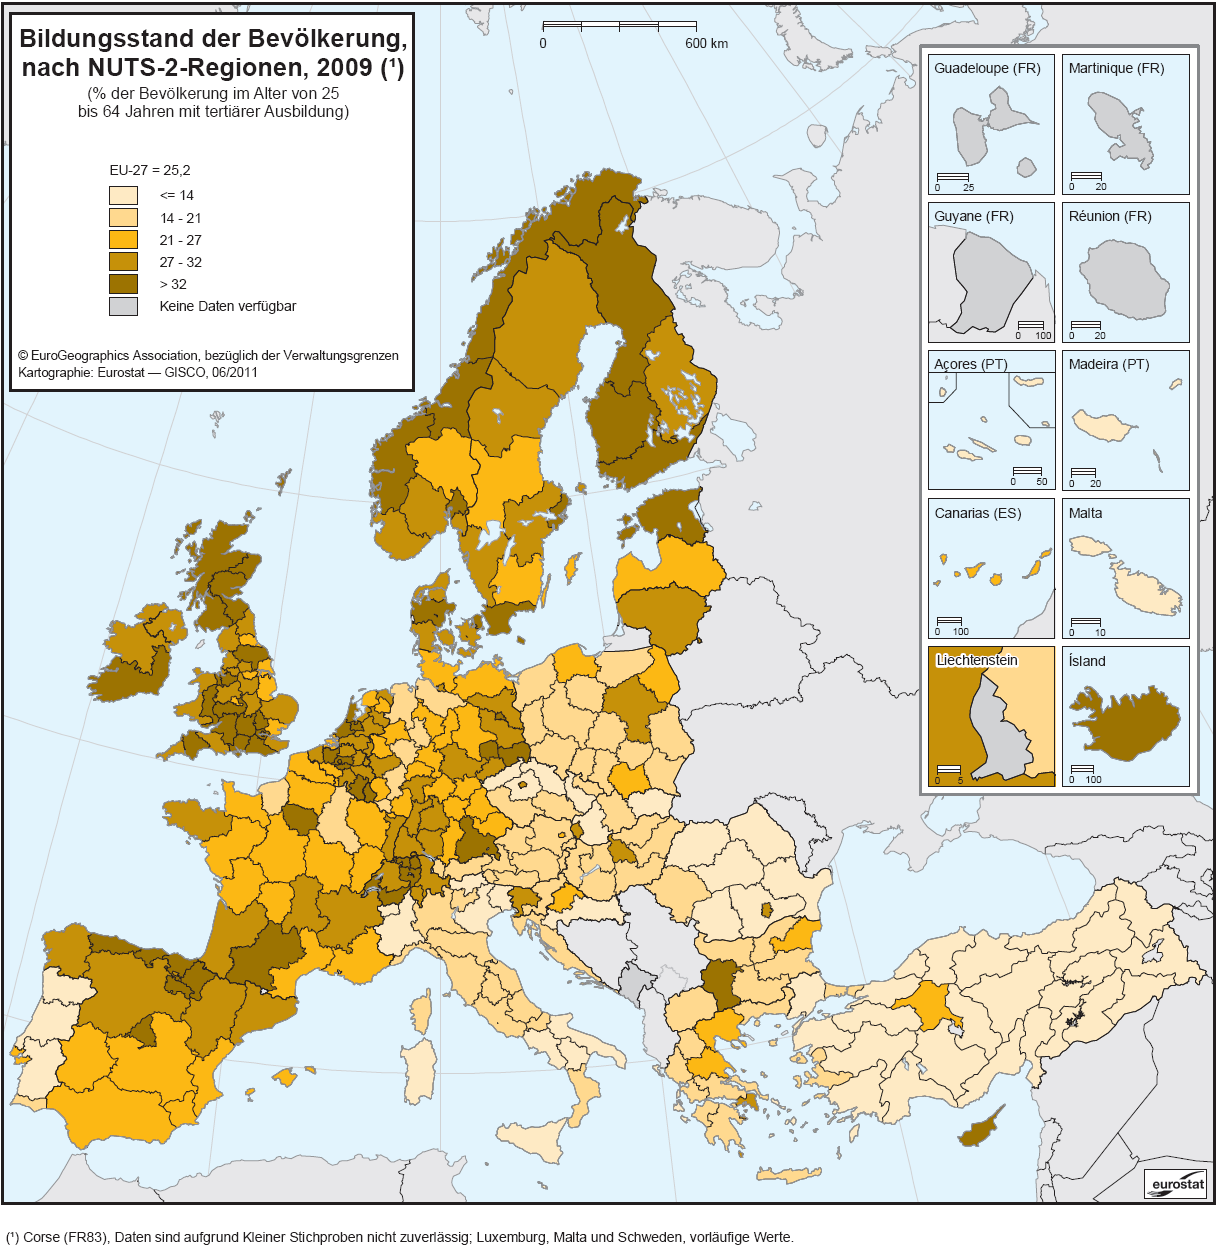
| 12:00, 9 February 2012 | Educational attainment level, by NUTS 2 regions, 2009-de.PNG (file) |  |
346 KB | Karte 5: Bildungsstand der Bevölkerung, nach NUTS-2-Regionen, 2009 (% der Bevölkerung im Alter von 25 bis 64 Jahren mit tertiärer Ausbildung) - Quelle: Eurostat (online Datenkode: edat_lfse_11) | 1 |
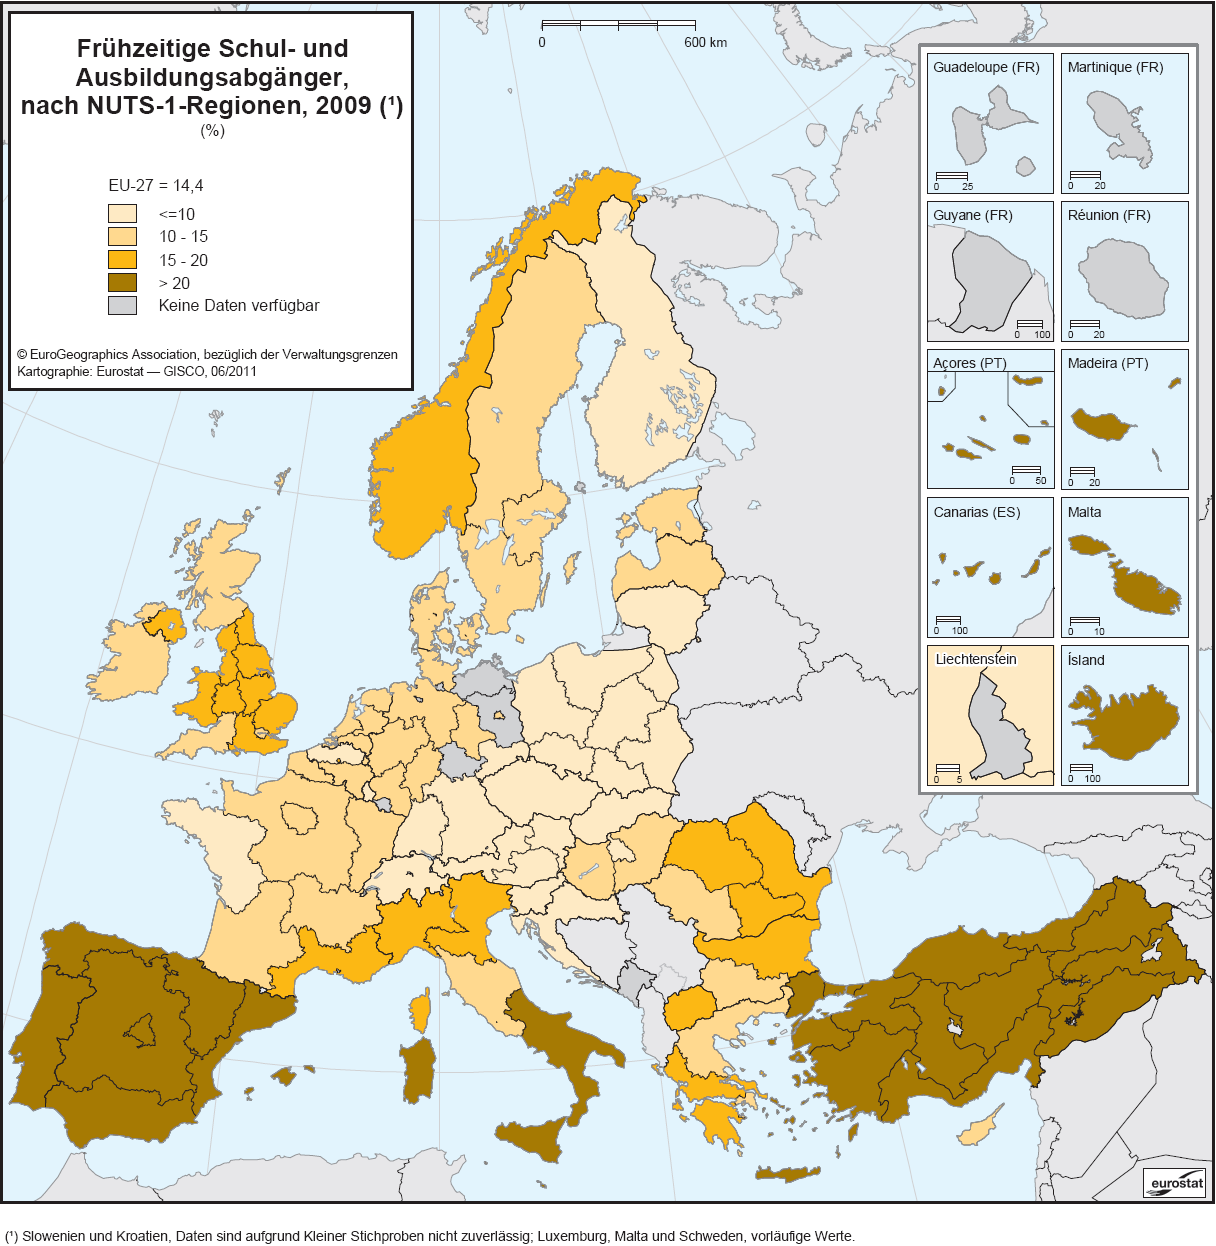
| 12:06, 9 February 2012 | Early leavers from education and training, by NUTS 1 regions, 2009-de.PNG (file) |  |
298 KB | Karte 6: Frühzeitige Schul- und Ausbildungsabgänger, nach NUTS-1-Regionen, 2009 (%) - Quelle: Eurostat (online Datenkode: edat_lfse_16) | 1 |
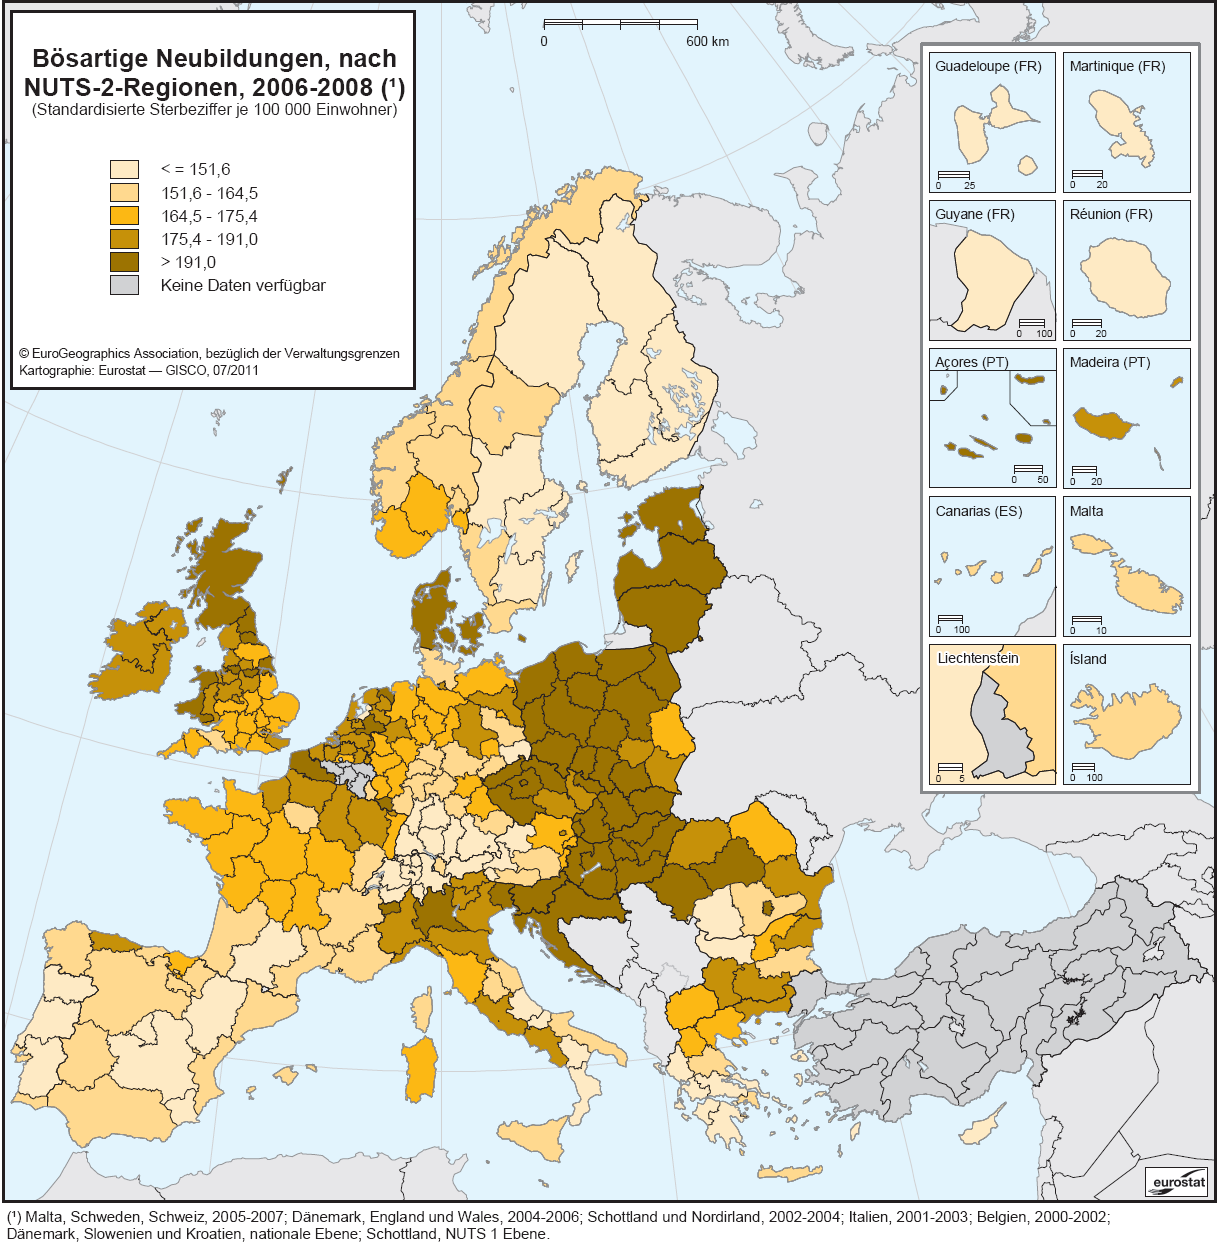
| 14:11, 13 February 2012 | Malignant neoplasms, by NUTS 2 regions, 2006–08-de.PNG (file) |  |
346 KB | Karte 5.1: Bösartige Neubildungen, nach NUTS-2-Regionen, 2006-2008 (Standardisierte Sterbeziffer je 100 000 Einwohner) - Quelle: Eurostat (online Datenkode: tgs00058) | 1 |
| 14:43, 13 February 2012 | Image-Malignant neoplasms, by NUTS 2 regions, 2006–08-de.PNG (file) |  |
346 KB | Karte 1: Bösartige Neubildungen, nach NUTS-2-Regionen, 2006-2008 (Standardisierte Sterbeziffer je 100 000 Einwohner) - Quelle: Eurostat (online Datenkode: tgs00058) | 1 |
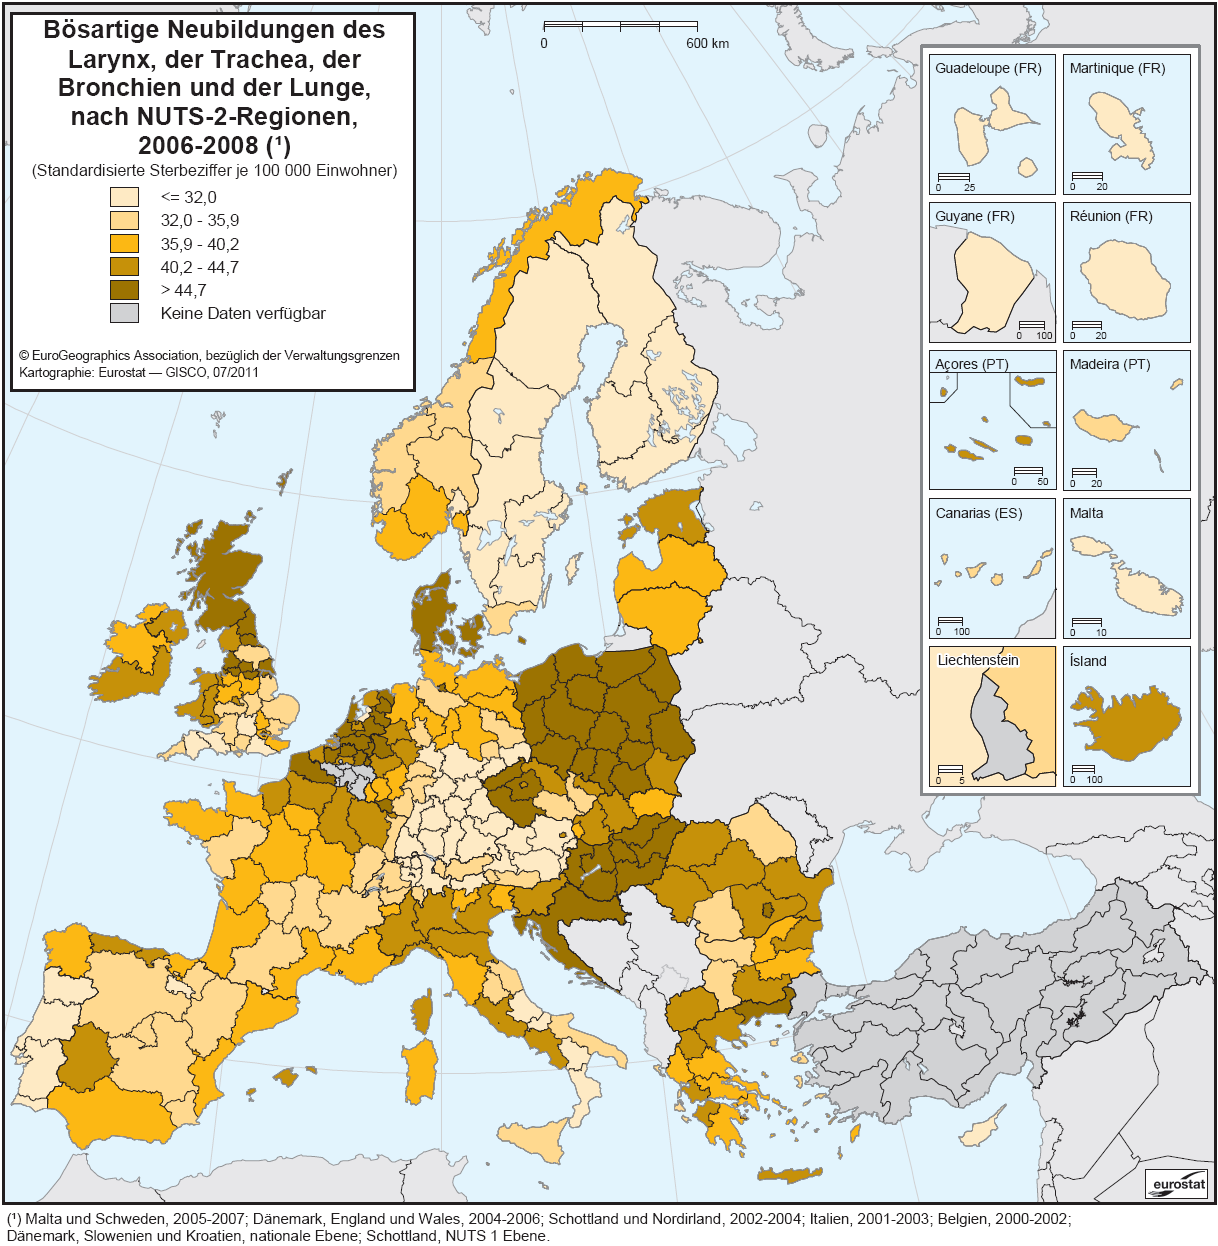
| 15:54, 13 February 2012 | Malignant neoplasms of the larynx, trachea, bronchus and lung, by NUTS 2 regions, 2006–08-de.PNG (file) |  |
351 KB | Karte 2: Bösartige Neubildungen des Larynx, der Trachea, der Bronchien und der Lunge, nach NUTS-2-Regionen, 2006-2008 (Standardisierte Sterbeziffer je 100 000 Einwohner) - Quelle: Eurostat (online Datenkode: hlth_cd_ysdr1) | 1 |
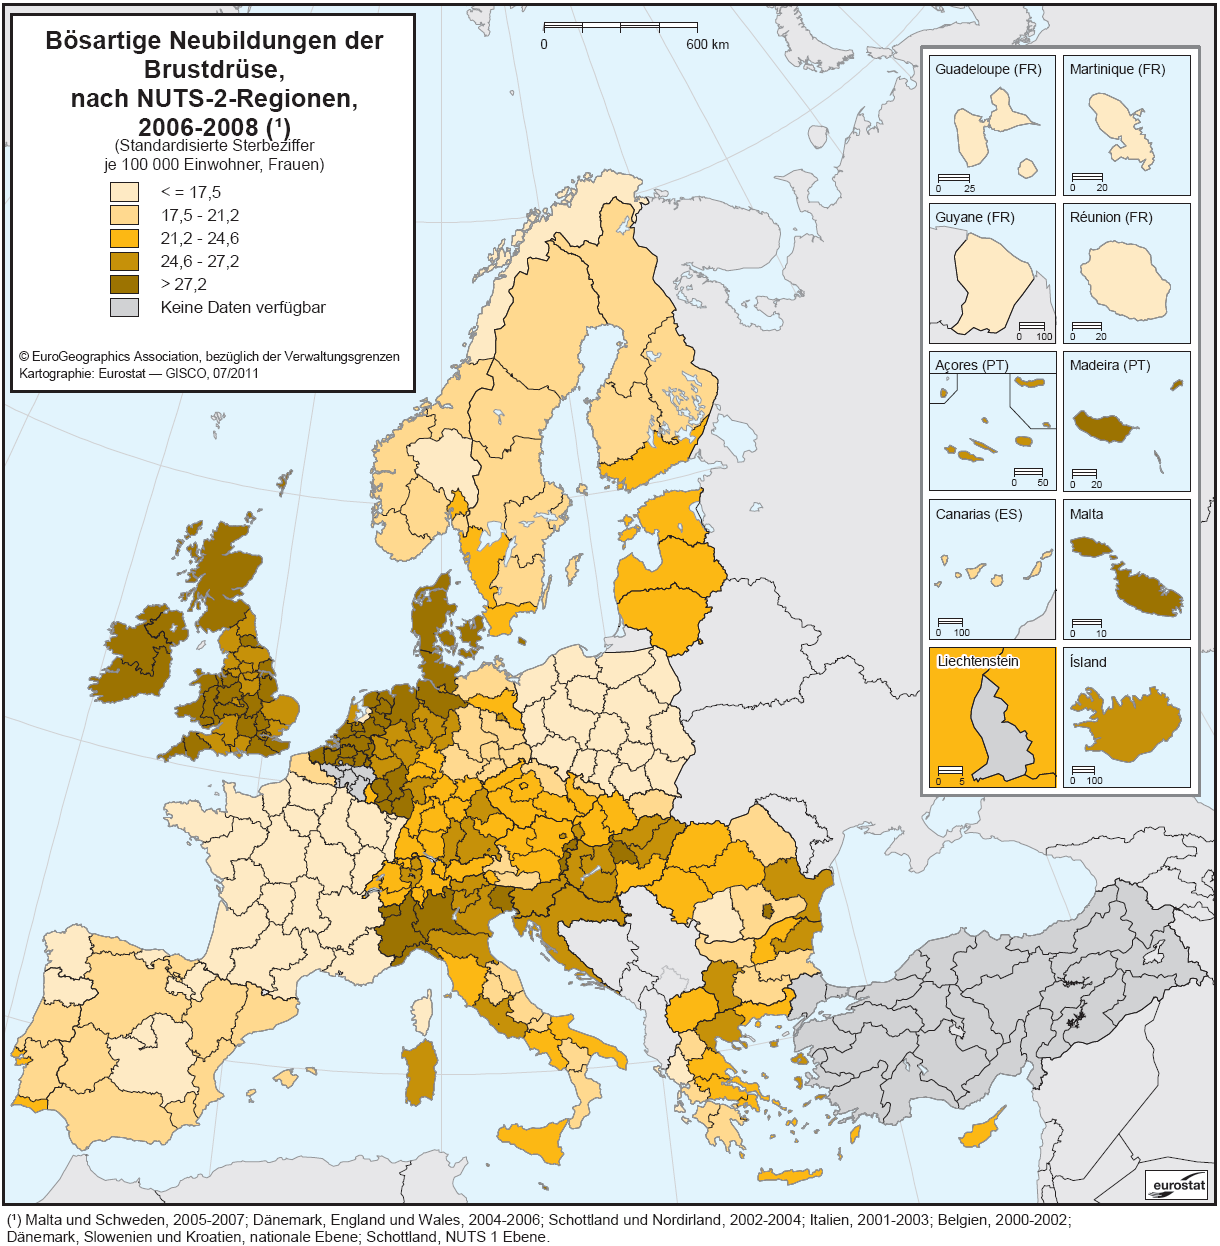
| 16:12, 13 February 2012 | Malignant neoplasm of the breast by NUTS 2 regions, 2006–08-de.PNG (file) |  |
347 KB | Karte 3: Bösartige Neubildungen der Brustdrüse, nach NUTS-2-Regionen, 2006-2008 (Standardisierte Sterbeziffer je 100 000 Einwohner, Frauen) - Quelle: Eurostat (online Datenkode: hlth_cd_ysdr1) | 1 |
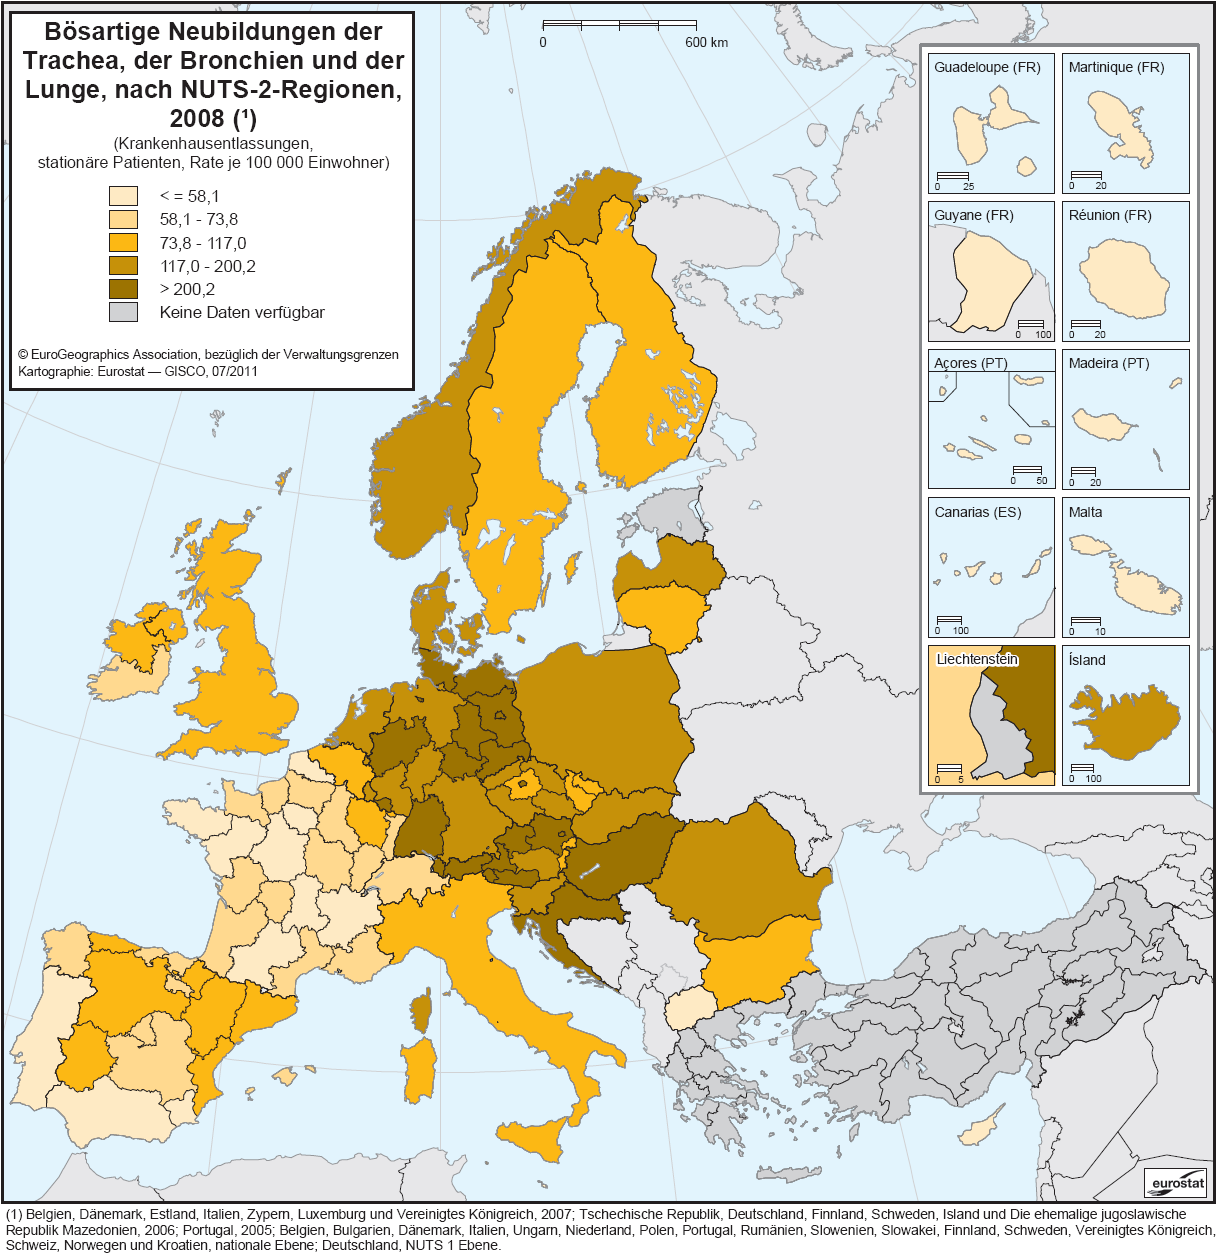
| 13:58, 20 February 2012 | Malignant neoplasm of the trachea, bronchus and lung, by NUTS 2 regions, 2008-de.PNG (file) |  |
313 KB | Karte 2: Bösartige Neubildungen, nach NUTS-2-Regionen, 2008 (Krankenhausentlassungen, stationäre Patienten, Rate je 100 000 Einwohner) - Quelle: Eurostat (online Datenkode: hlth_co_disch2t) | 1 |
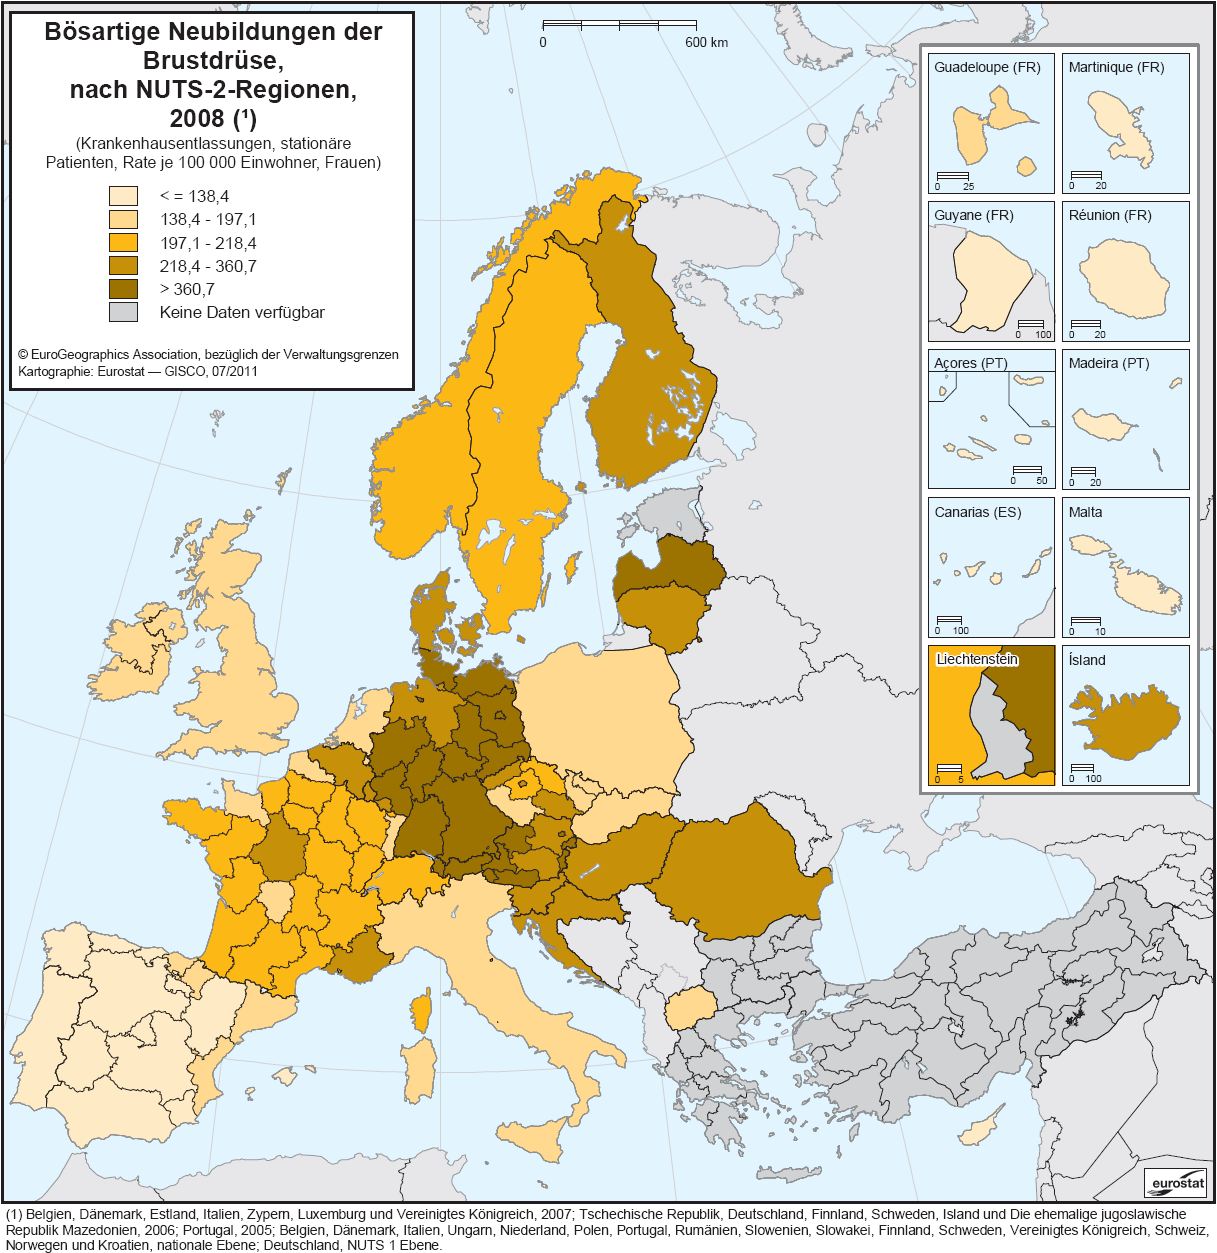
| 14:07, 20 February 2012 | Malignant neoplasm of the breast, by NUTS 2 regions, 2008-de.PNG (file) |  |
312 KB | Karte 3: Bösartige Neubildungen der Brustdrüse, nach NUTS-2-Regionen, 2008 (Krankenhausentlassungen, stationäre Patienten, Rate je 100 000 Einwohner, Frauen) - Quelle: Eurostat (online Datenkode: hlth_co_disch2t) | 1 |
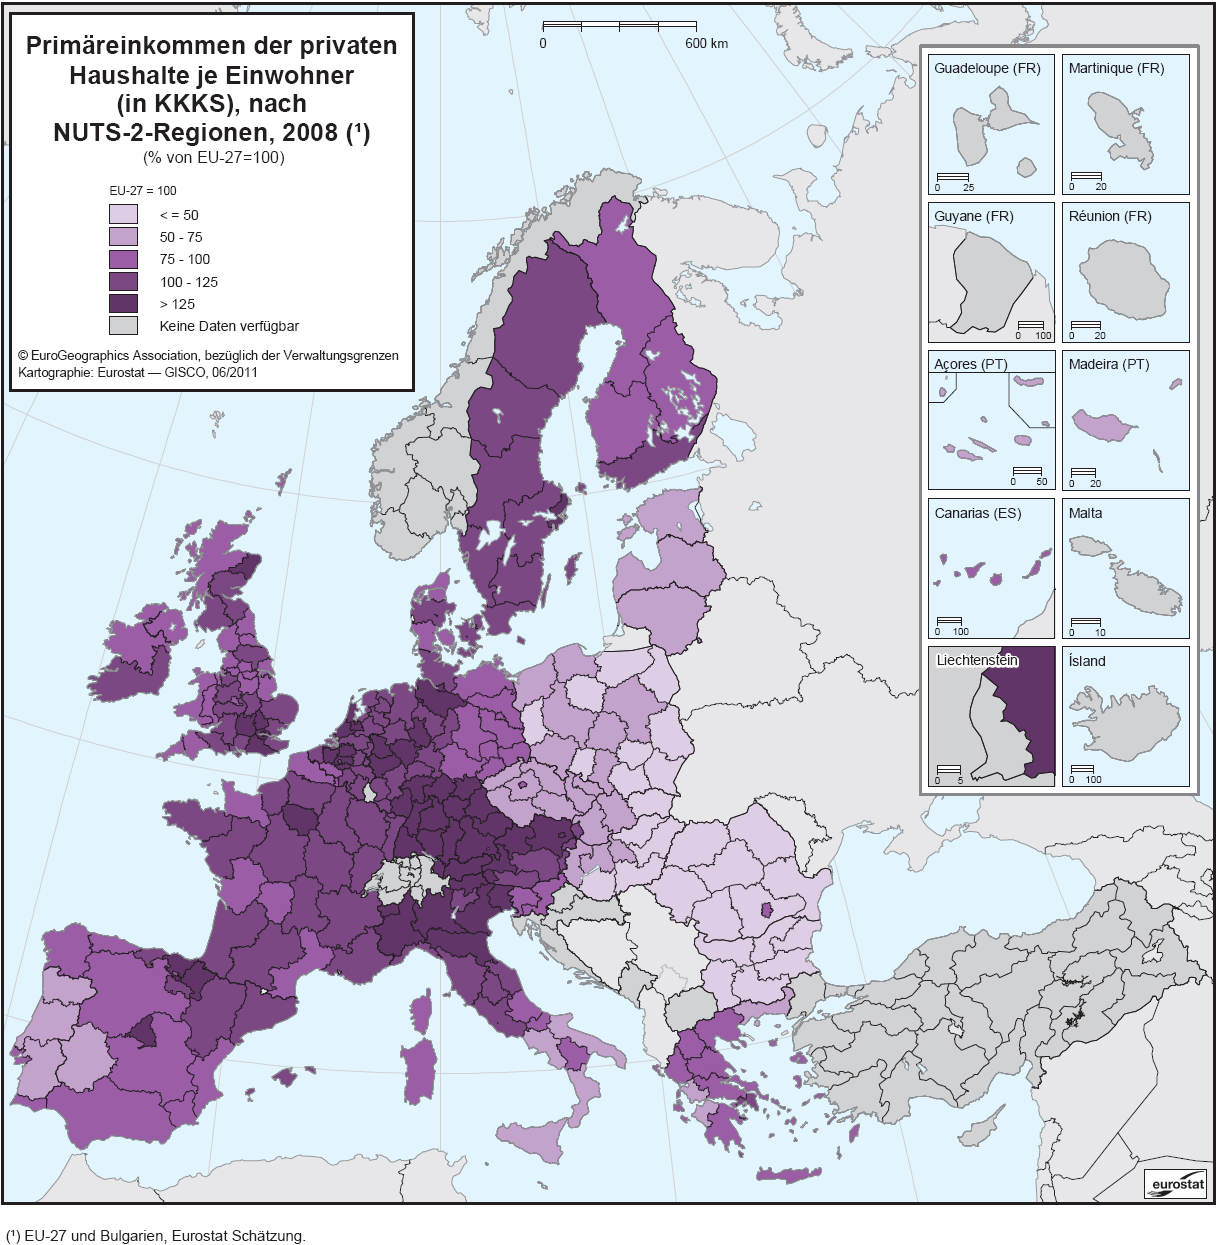
| 12:46, 24 February 2012 | Primary income of private households per inhabitant (in PPCS), by NUTS 2 regions, 2008-de.PNG (file) | ,_by_NUTS_2_regions,_2008-de.PNG) |
340 KB | Karte 1: Primäreinkommen der privaten Haushalte je Einwohner (in KKKS), nach NUTS-2-Regionen, 2008 (¹) (% von EU-27=100) - Quelle: Eurostat (online Datenkode: nama_r_ehh2inc) | 1 |
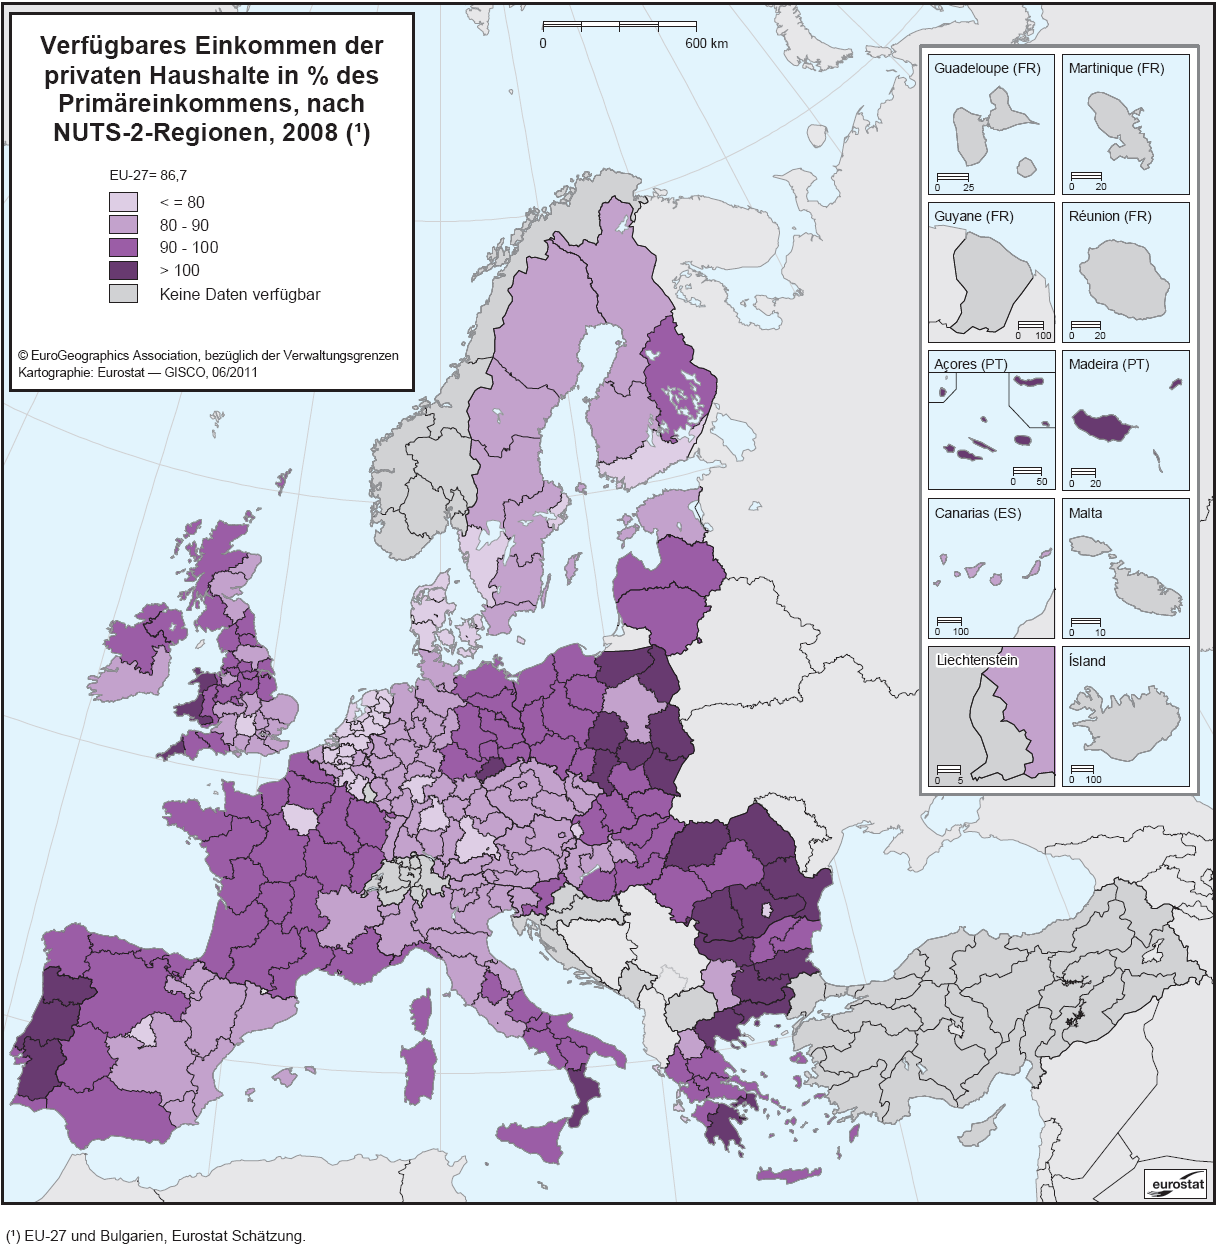
| 13:11, 24 February 2012 | Disposable income of private households as % of primary income, by NUTS 2 regions, 2008-de.PNG (file) |  |
339 KB | Karte 2: Verfügbares Einkommen der privaten Haushalte in % des Primäreinkommens, nach NUTS-2-Regionen, 2008 (¹) - Quelle: Eurostat (online Datenkode: nama_r_ehh2inc) | 1 |
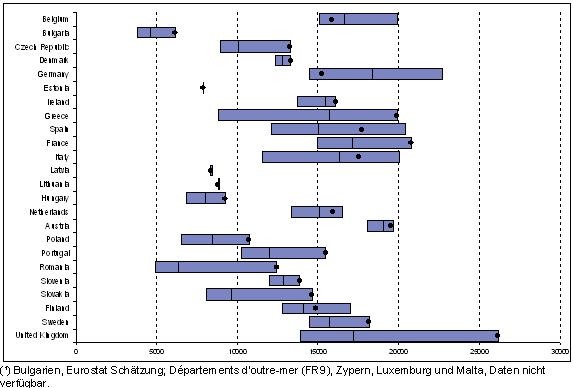
| 12:06, 6 March 2012 | Disposable income of private households per inhabitant (in PPCS), highest and lowest NUTS 2-de.PNG (file) | ,_highest_and_lowest_NUTS_2-de.PNG) |
14 KB | Abbildung 1: Verfügbares Einkommen der privaten Haushalte je Einwohner (in KKKS), höchste und niedrigste Werte für NUTS-2-Regionen in jedem Land, 2008 (¹) - Quelle: Eurostat (online Datenkode: nama_r_ehh2inc) | 1 |
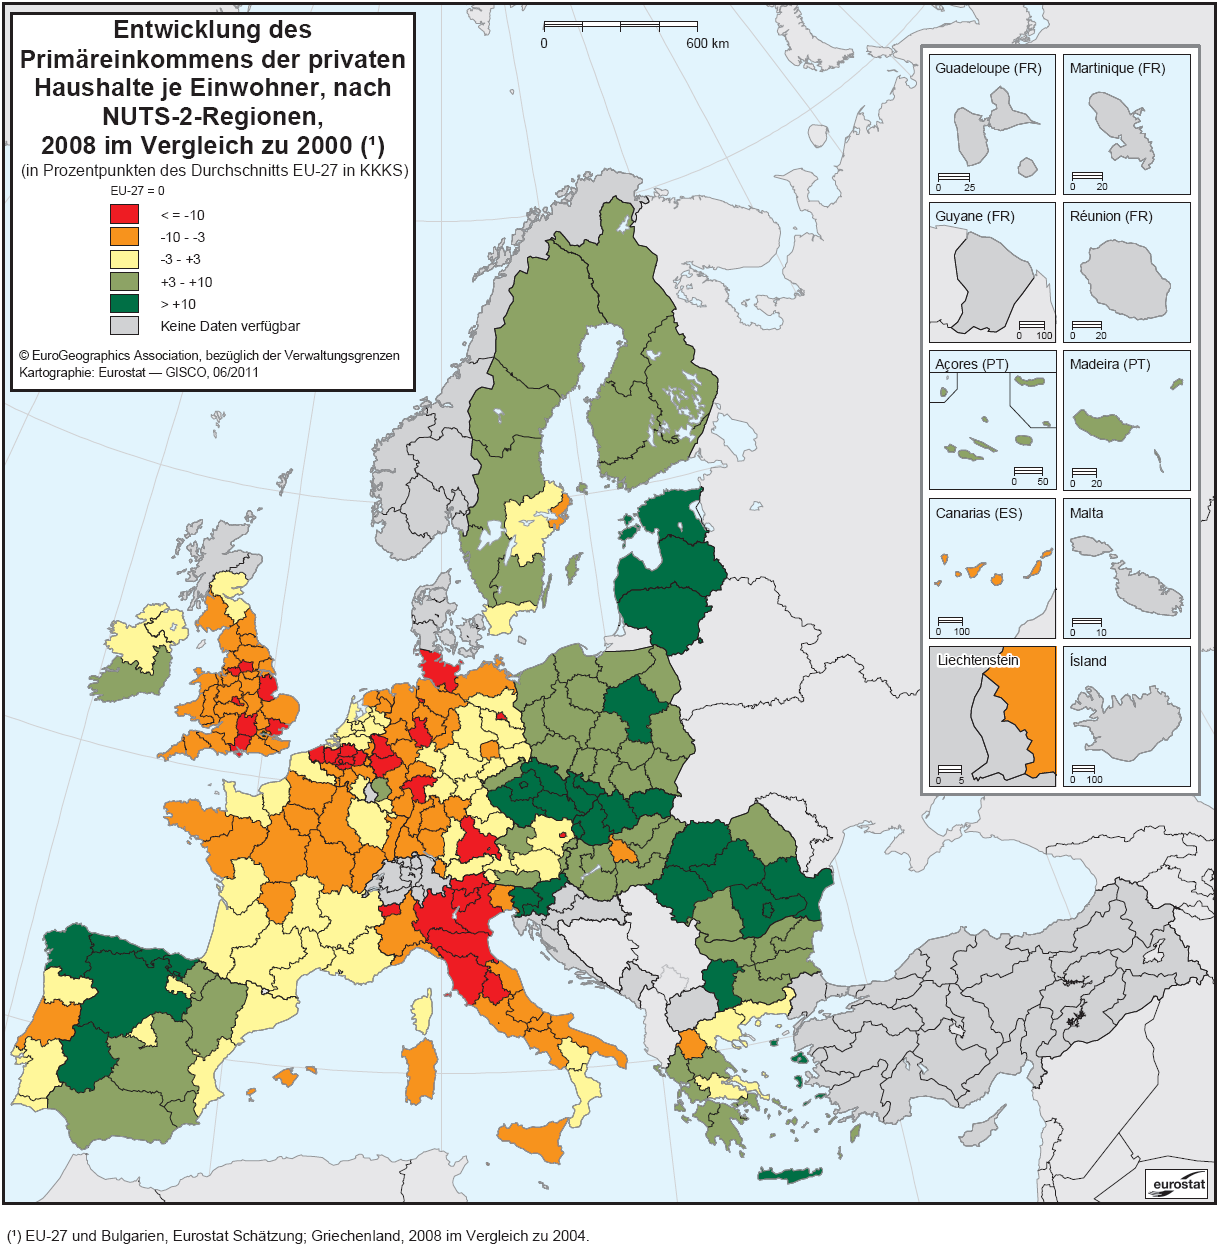
| 13:49, 6 March 2012 | Development of primary income of private households per inhabitant, by NUTS 2 regions, 2008 as compared with 2000-de.PNG (file) |  |
346 KB | Karte 3: Entwicklung des Primäreinkommens der privaten Haushalte je Einwohner, nach NUTS-2-Regionen, 2008 im Vergleich zu 2000 (¹) (in Prozentpunkten des Durchschnitts EU-27 in KKKS) - Quelle: Eurostat (online Datenkode: nama_r_ehh2inc) | 1 |
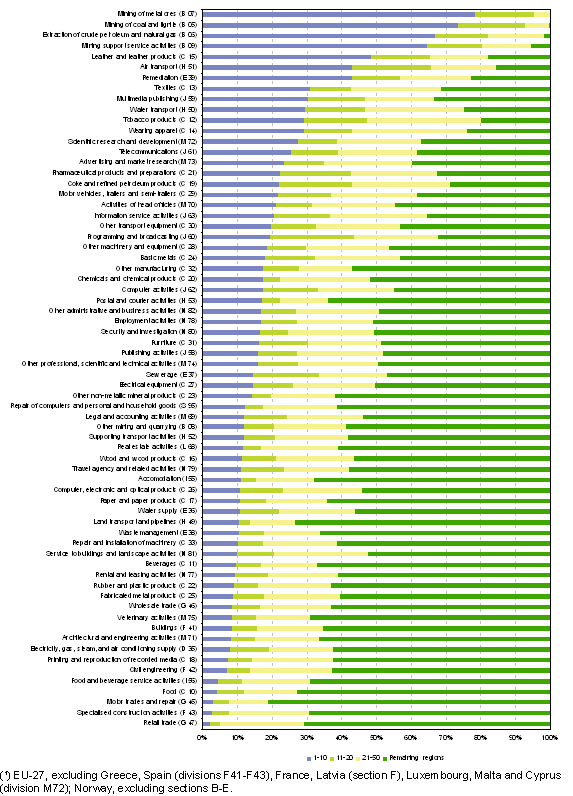
| 18:20, 6 March 2012 | Most concentrated activities (NACE divisions), EU-27 and Norway, by NUTS 2 regions, 2008-de.PNG (file) | ,_EU-27_and_Norway,_by_NUTS_2_regions,_2008-de.PNG) |
41 KB | Abbildung 2: Konzentration der Wirtschaftszweige (NACE-Abteilungen), EU-27 und Norwegen, nach NUTS-2-Regionen, 2008 (¹) (%, anteil der Regionen an der Gesamtbeschäftigung) - Quelle: Eurostat (online Datenkode: sbs_r_nuts06_r2) | 2 |
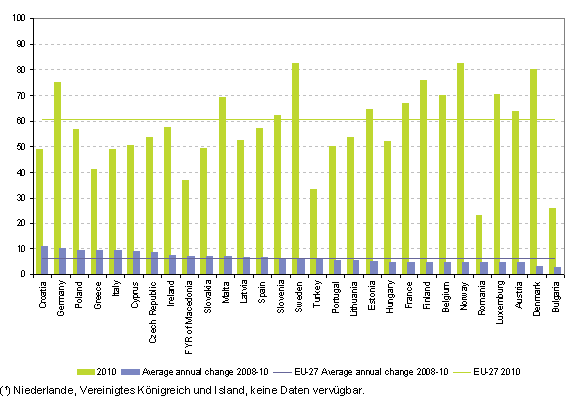
| 12:15, 7 March 2012 | Broadband connections in households, 2008–10-de.PNG (file) |  |
14 KB | Abbildung 1: Breitbandanschlüsse in Haushalten 2008 – 2010 (Anteil der Haushalte mit Breitbandanschlüssen in 2010 und durchschnittliche jährliche Veränderung, in Prozentpunkten) - Quelle: Eurostat (online Datenkode: isoc_si_broad) | 1 |
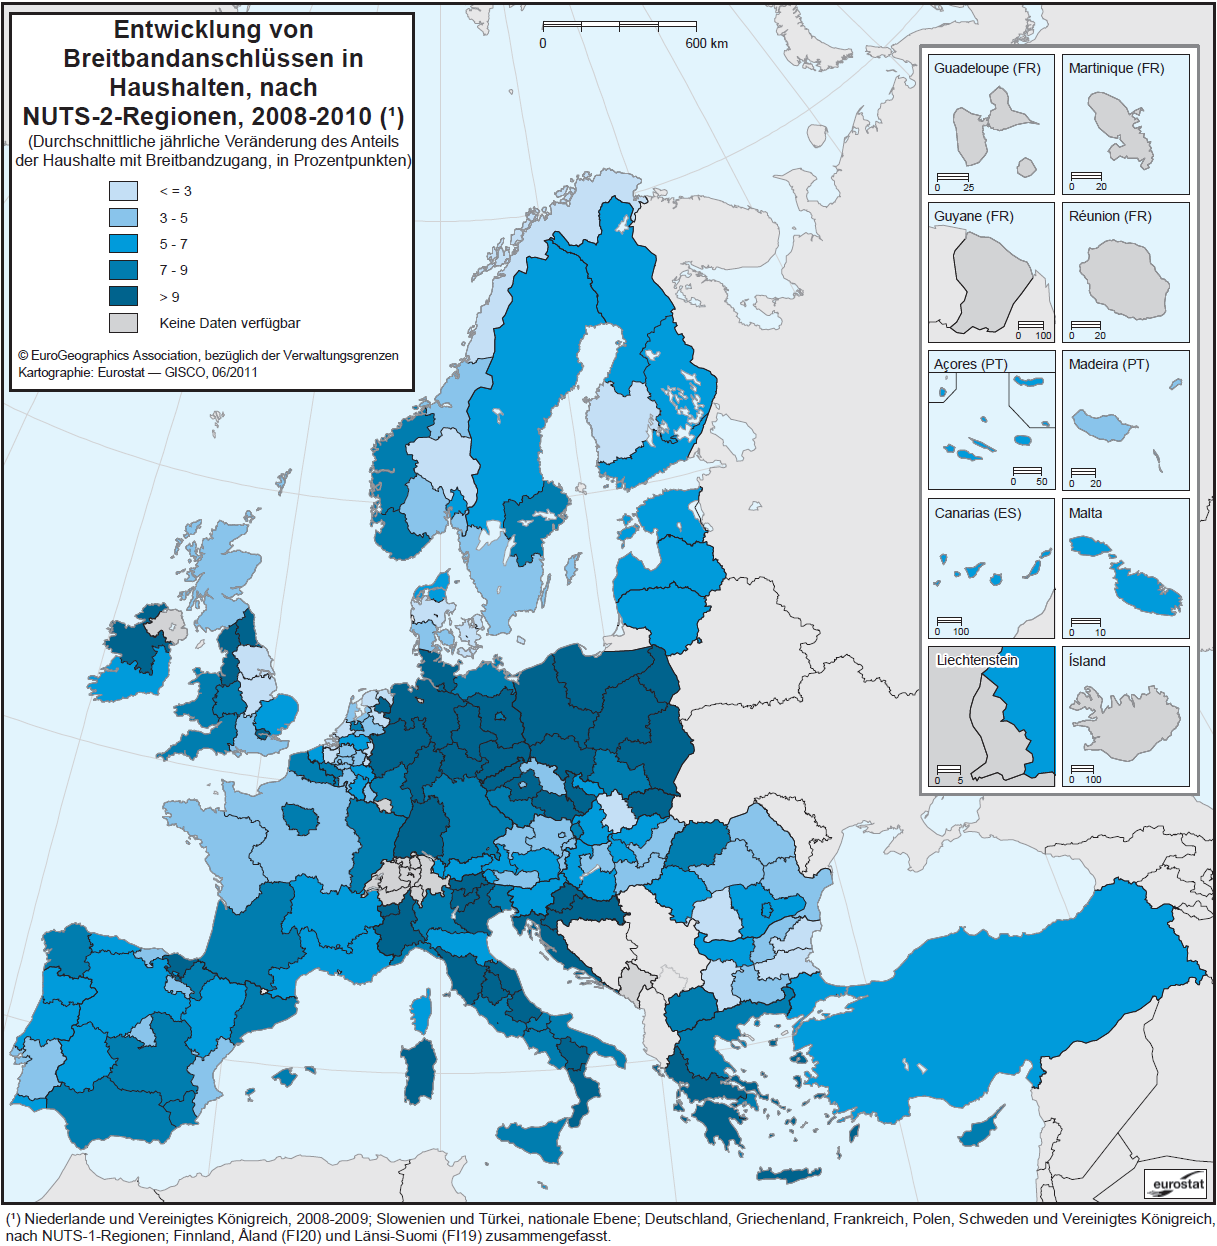
| 13:23, 7 March 2012 | Development of broadband connections in households, by NUTS 2 regions, 2008–10-de.PNG (file) |  |
333 KB | Karte 1: Entwicklung von Breitbandanschlüssen in Haushalten, nach NUTS-2-Regionen, 2008-2010 (¹) (Durchschnittliche jährliche Veränderung des Anteils der Haushalte mit Breitbandzugang, in Prozentpunkten) - Quelle: Eurostat (online Datenkode: isoc_r_br | 1 |
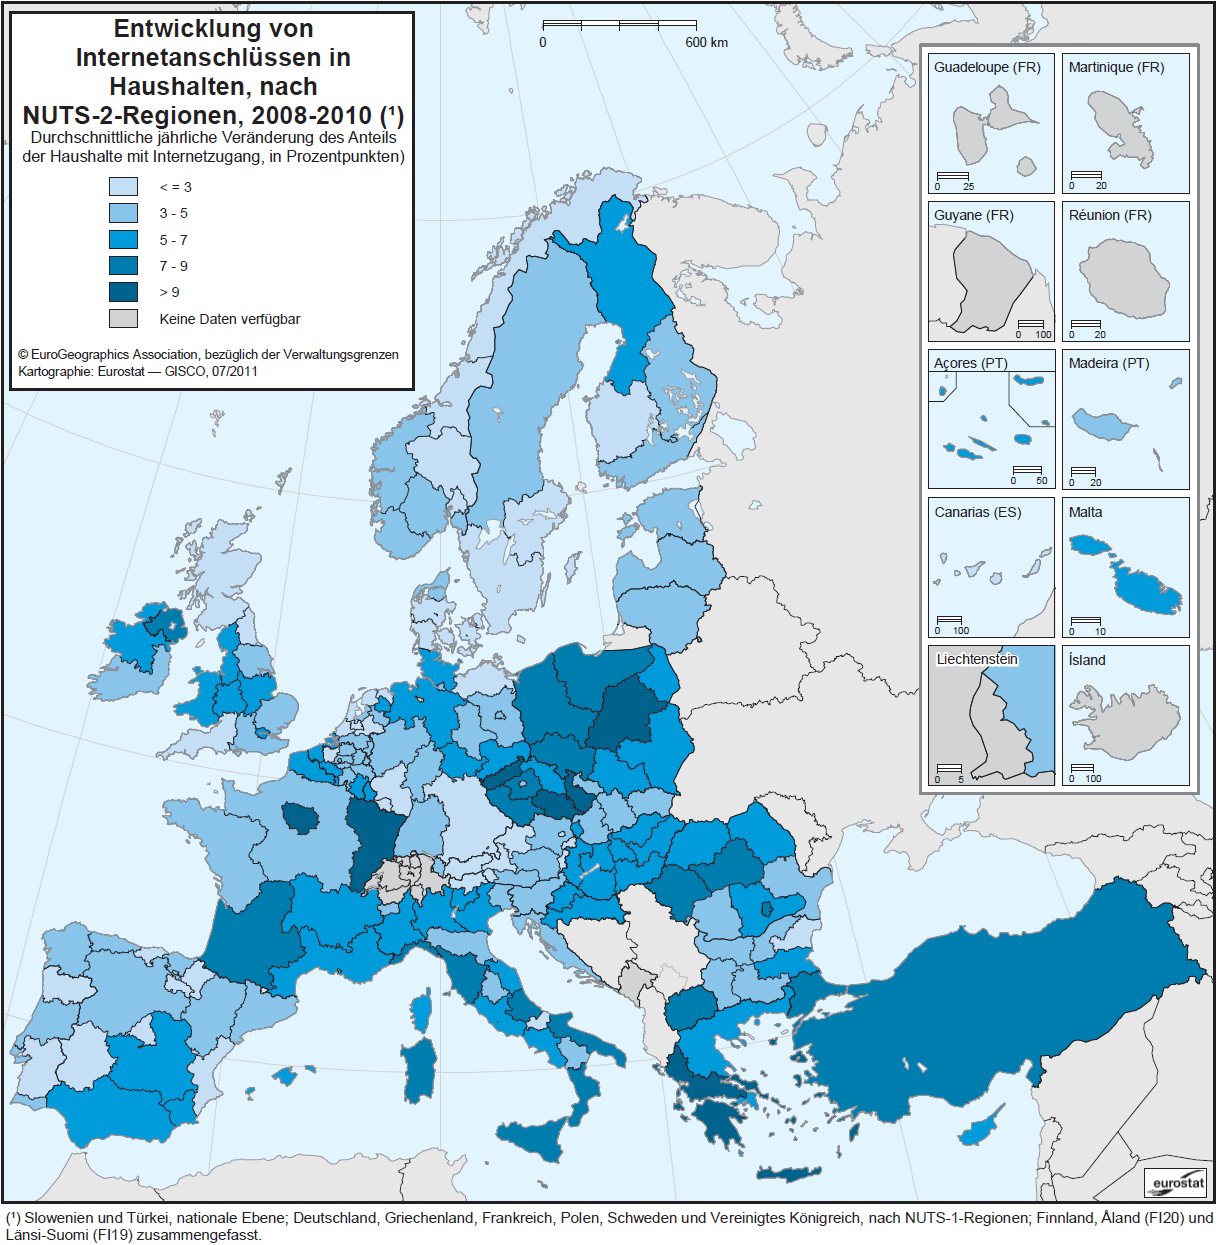
| 14:01, 7 March 2012 | Development of Internet access in households, by NUTS 2 regions, 2008–10-de.PNG (file) |  |
330 KB | Karte 2: Entwicklung von Internetanschlüssen in Haushalten, nach NUTS-2-Regionen, 2008-2010 (¹) (Durchschnittliche jährliche Veränderung des Anteils der Haushalte mit Internetzugang, in Prozentpunkten) - Quelle: Eurostat (online Datenkode: isoc_r_iacc | 1 |