Tutorials
Log in
Statistics Explained
menu
search
search
Navigation
Main page
Statistical themes
Glossary
Categories
Statistics 4 beginners
Tutorials
Help
Eurostat home
Education corner
Online publications
Regional yearbook
Sustainable development
Full list
Tools
User contributions
Logs
View user groups
Special pages
search
Navigation
Main page
Statistical themes
Glossary
Categories
Statistics 4 beginners
Tutorials
Help
Eurostat home
Education corner
Online publications
Regional yearbook
Sustainable development
Full list
Tools
User contributions
Logs
View user groups
Special pages
Navigation
Main page
Statistical themes
Glossary
Categories
Statistics 4 beginners
Tutorials
Help
Eurostat home
Education corner
Online publications
Regional yearbook
Sustainable development
Full list
Tools
User contributions
Logs
View user groups
Special pages
Uploads by EXT-M-Erzar
This special page shows all uploaded files.
File list
Items per page:
20
50
100
250
500
Search for media name:
Username:
Include old versions of files
Go
First page
Previous page
Next page
Last page
Date
Name
Thumbnail
Size
Description
Versions
14:09, 20 April 2011
Graph2-2009-2010 monthly growth of EU-27 passengers carried in the first six months of 2010.JPG
(
file
)
15 KB
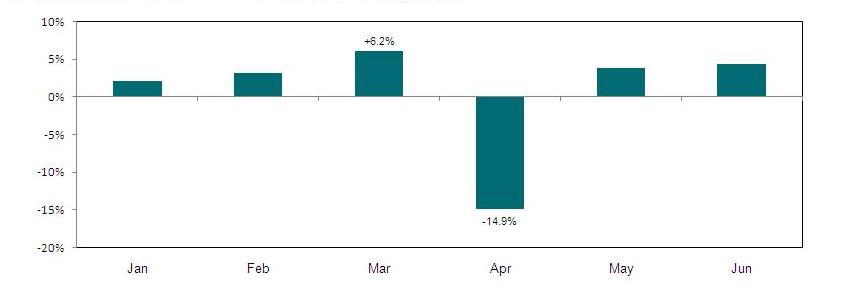
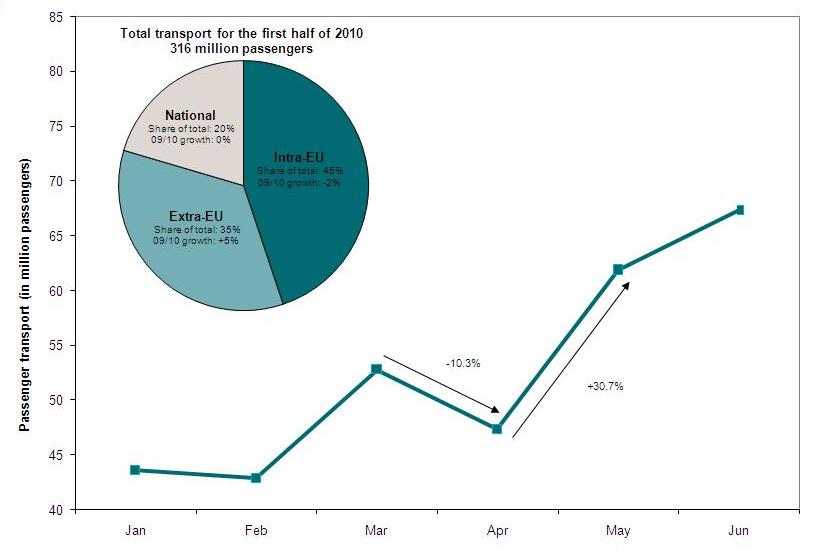
Graph 2: 2009/2010 monthly growth of EU-27 passengers carried in the first six months of 2010
1
14:10, 20 April 2011
Table1-Passengers carried (in 1000) per country-monthly data for 2010.JPG
(
file
)
180 KB
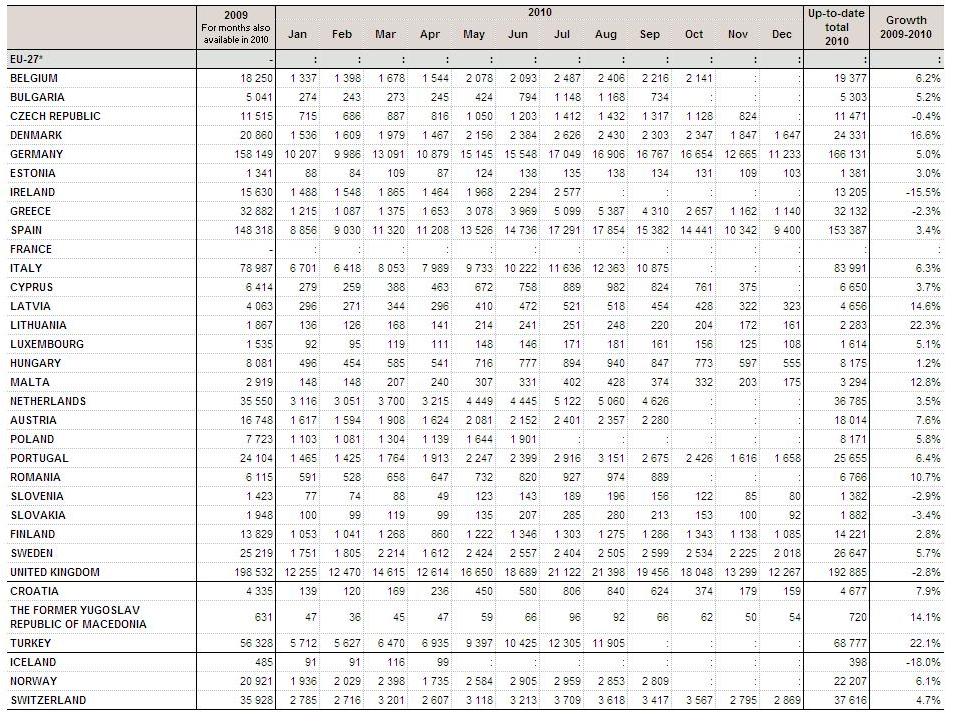
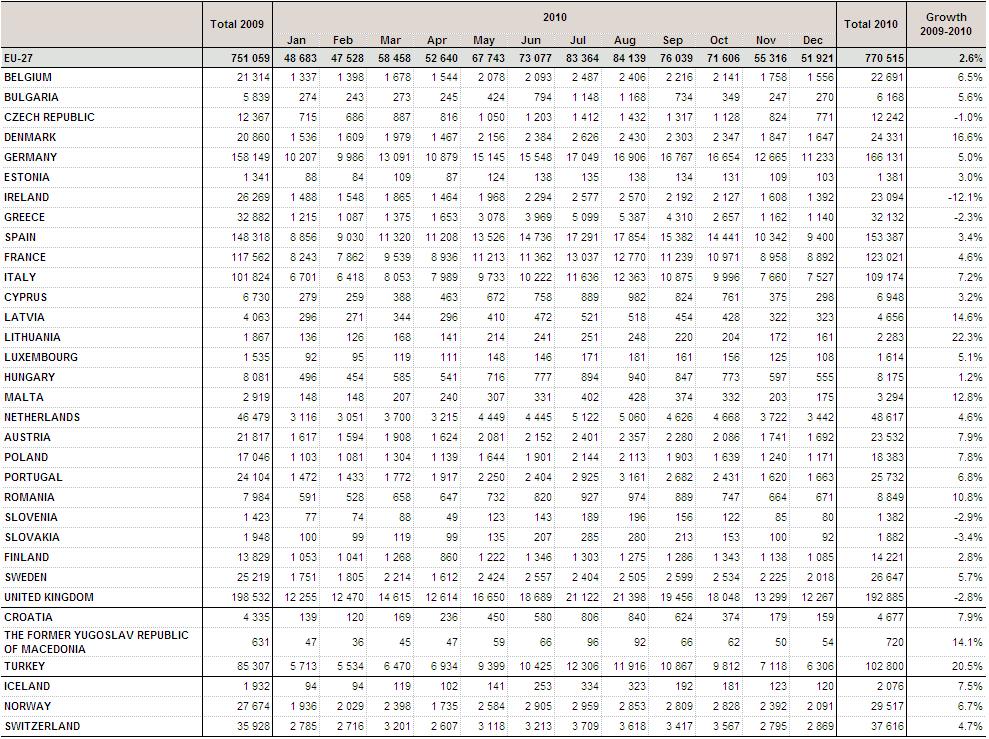
Table 1: Passengers carried (in 1000) per country - monthly data for 2010
1
14:11, 20 April 2011
Table2-Passengers handled in top airports (in 1000)-monthly data for 2010.JPG
(
file
)
200 KB
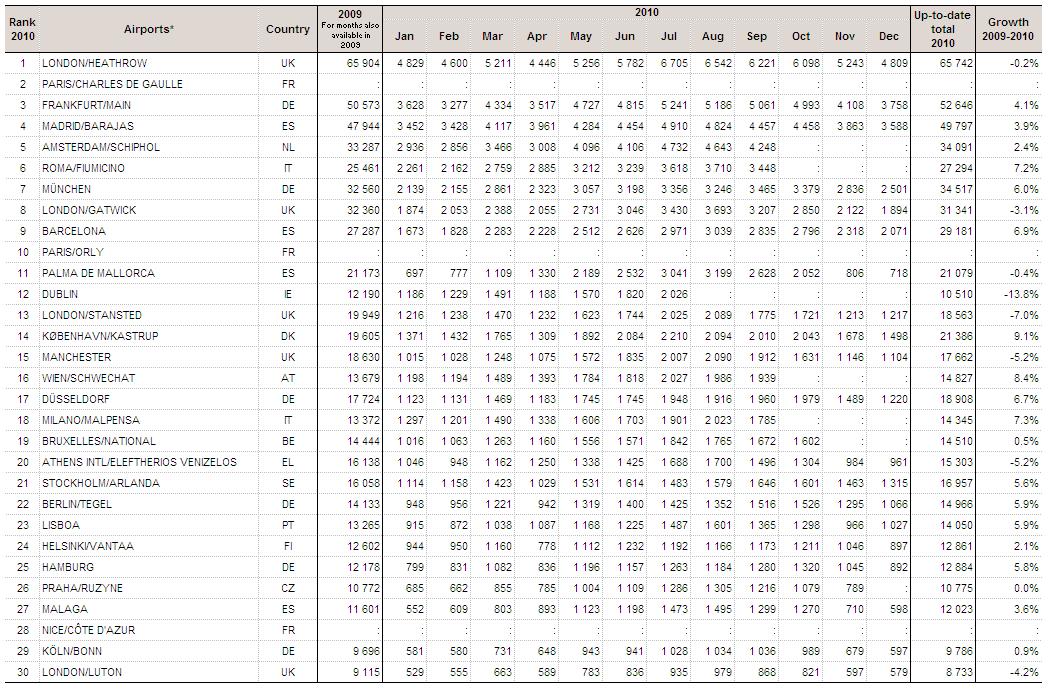
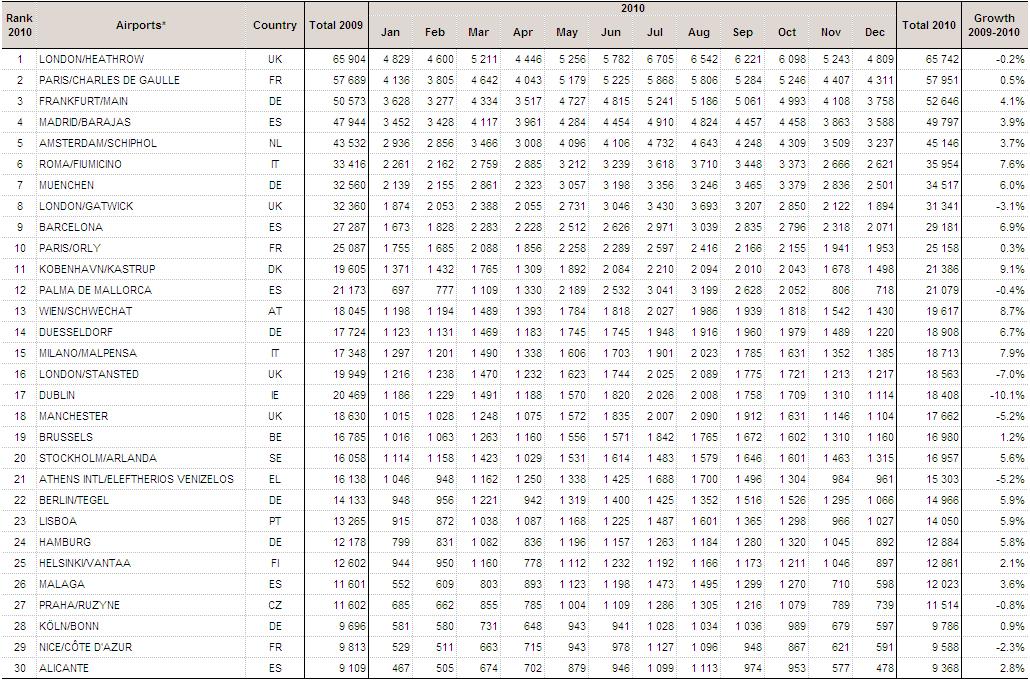
Table 2: Passengers handled in top airports (in 1000): monthly data for 2010
1
13:52, 11 July 2011
Graph2-2009-2010 monthly growth of EU-27 passengers carried in 2010 (07 11).JPG
(
file
)
18 KB
1
13:53, 11 July 2011
Table1-Passengers carried (in 1000) per country (07-11).JPG
(
file
)
210 KB
2
13:53, 11 July 2011
Table2-Passengers handled in top airports (in 1000) (07-11).JPG
(
file
)
210 KB
1
13:55, 11 July 2011
Graph1-2009-2010 monthly growth and share of EU-27 monthly passengers carried in 2010 (07 11).JPG
(
file
)
39 KB
1
12:17, 13 July 2011
Graph1-2009-2010 monthly growth and share of EU-27 monthly passengers carried in the first six months of 2010.JPG
(
file
)
36 KB
2
11:13, 19 October 2011
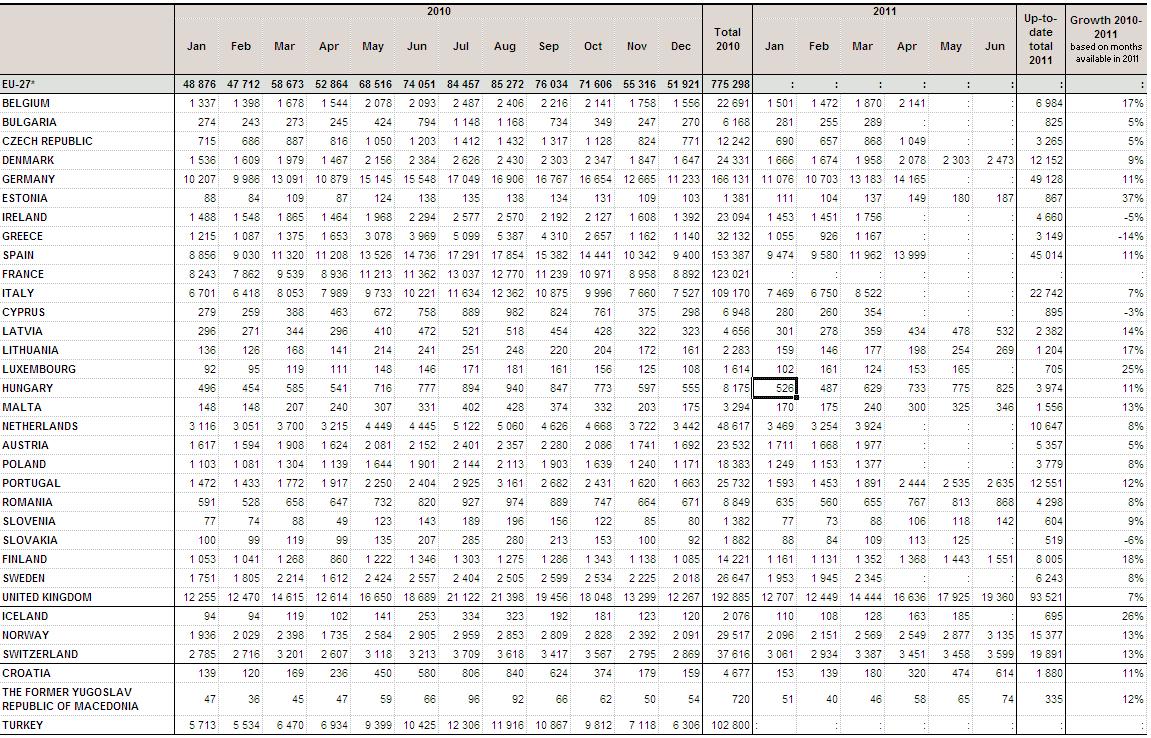
Air passengers carried (in 1000) per country (2010 and 1st quarter 2011).JPG
(
file
)
249 KB
1
11:14, 19 October 2011
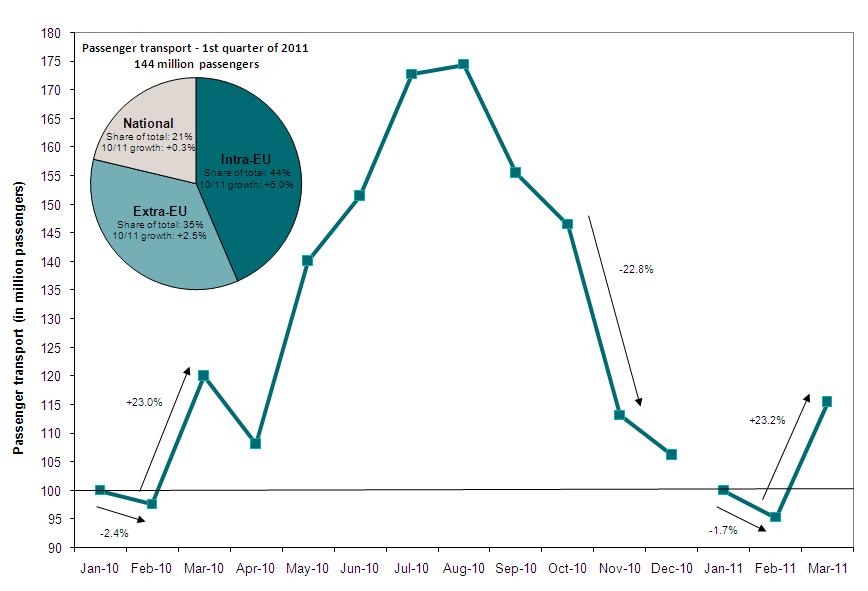
Monthly growth and share of EU-27 air passengers carried (2010 and 1st quarter 2011).JPG
(
file
)
50 KB
1
11:14, 19 October 2011
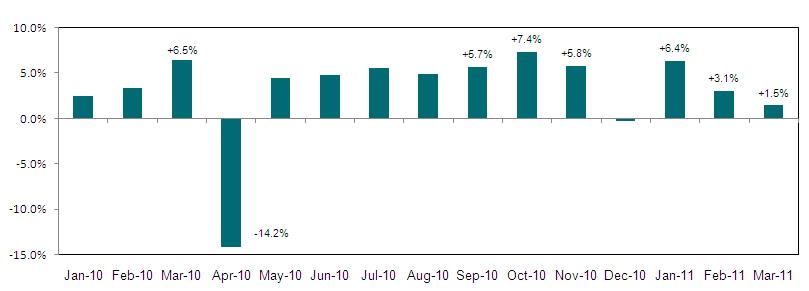
Monthly growth of EU-27 air passengers carried (2010 and 1st quarter 2011).JPG
(
file
)
23 KB
1
11:14, 19 October 2011
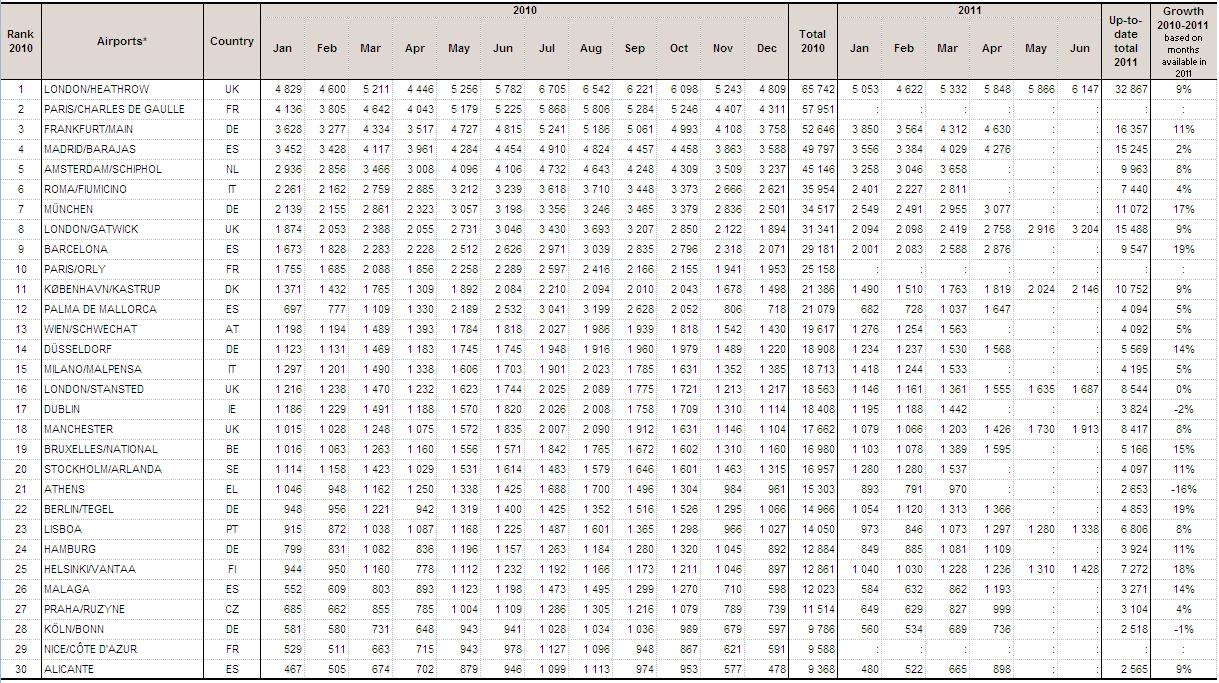
Passengers handled in top airports (in 1000) (2010 and 1st quarter 2011).JPG
(
file
)
253 KB
1
10:58, 30 November 2011
Trade by entreprise charact 2009 data.xls
(
file
)
1.88 MB
1
13:22, 29 May 2012
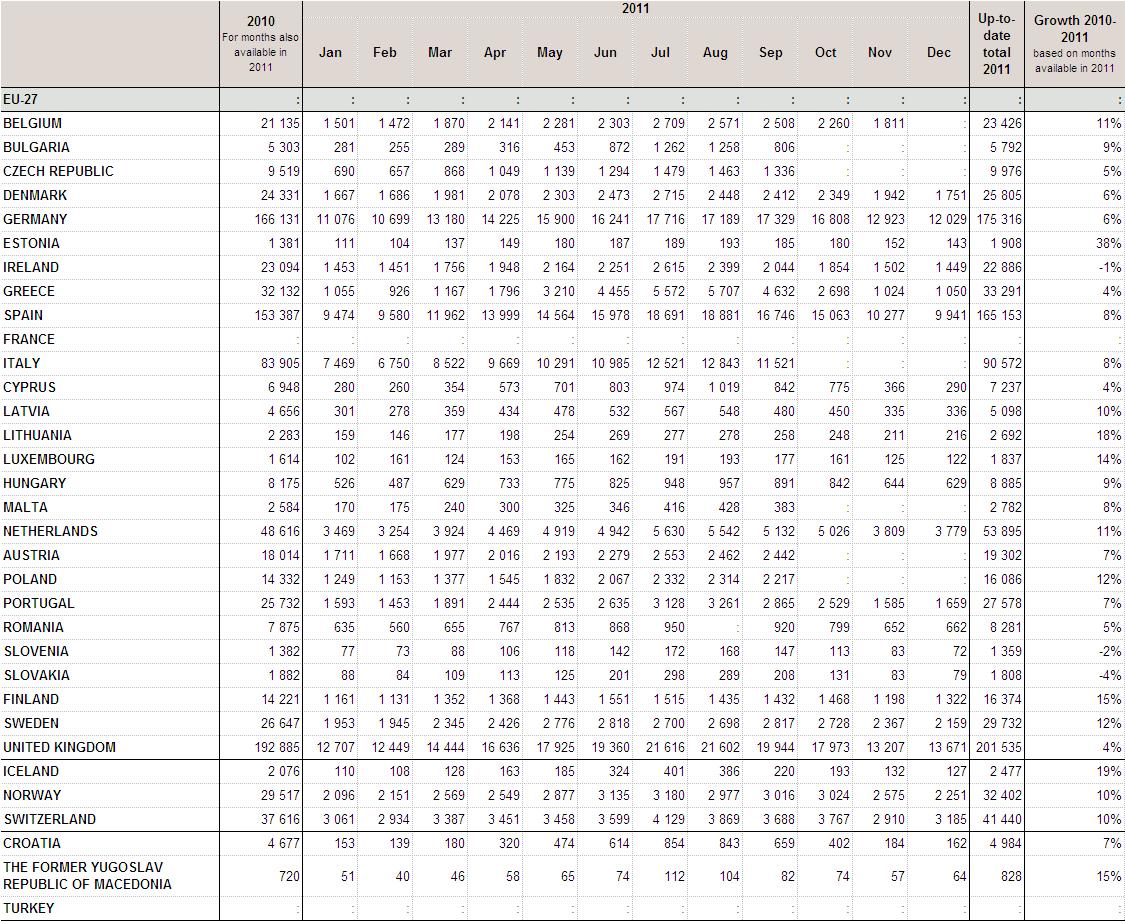
Air passengers carried (in 1000) per country (Three first quarters 2011).JPG
(
file
)
255 KB
1
13:23, 29 May 2012
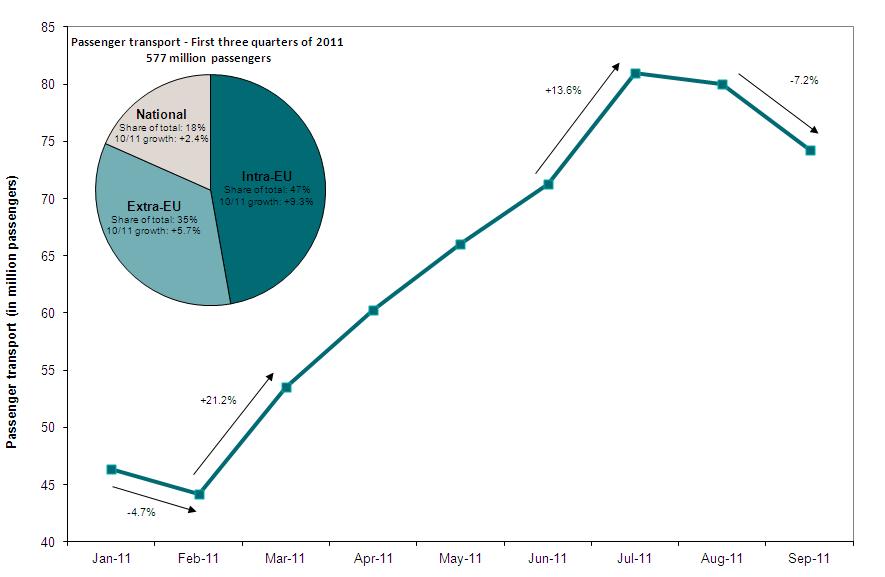
Graph1-monthly growth and share of EU-27 monthly passengers carried in the first three quarters of 2011.JPG
(
file
)
40 KB
1
13:24, 29 May 2012
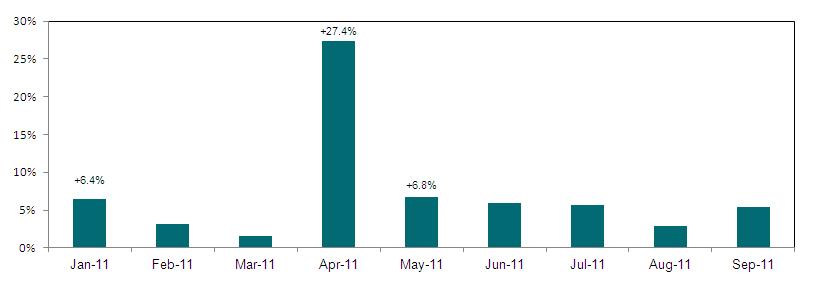
Monthly growth of EU-27 air passengers carried (Three first quarters 2011).JPG
(
file
)
17 KB
1
13:24, 29 May 2012
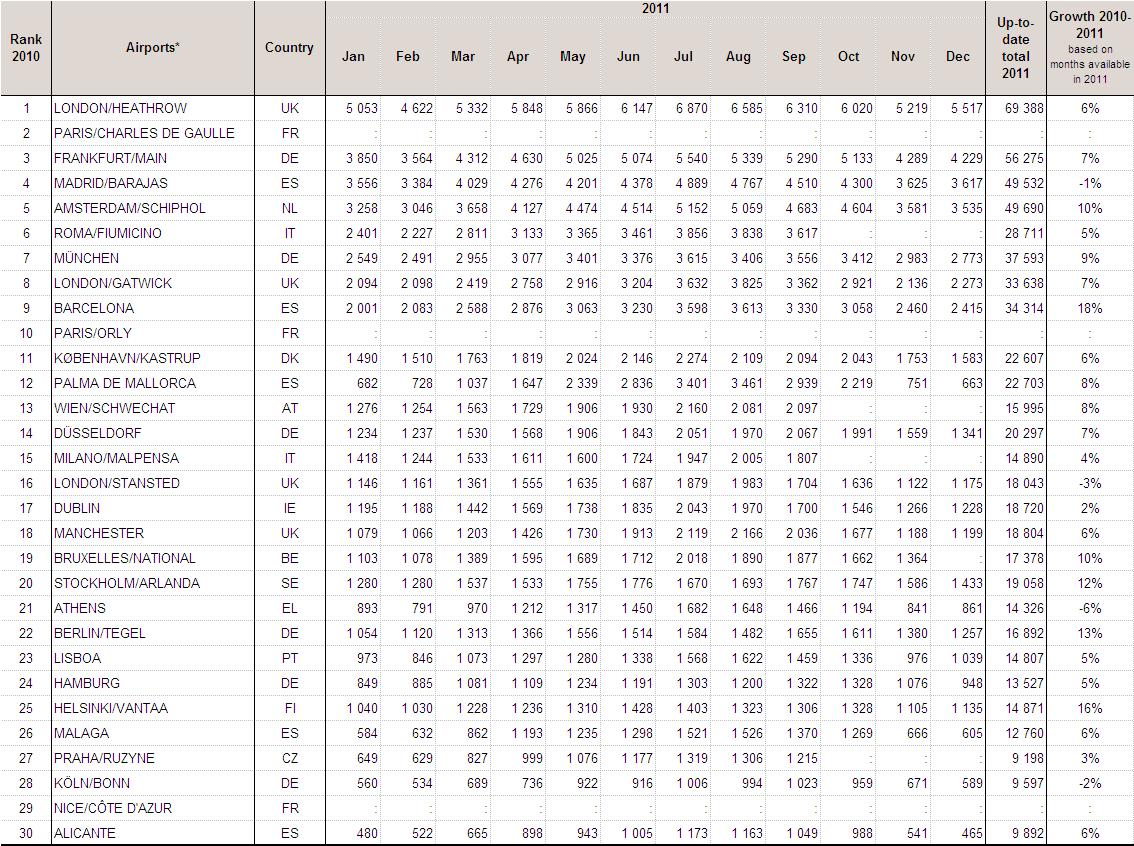
Passengers handled in top airports (in 1000) (Three first quarters 2011).JPG
(
file
)
255 KB
1
10:55, 25 July 2012
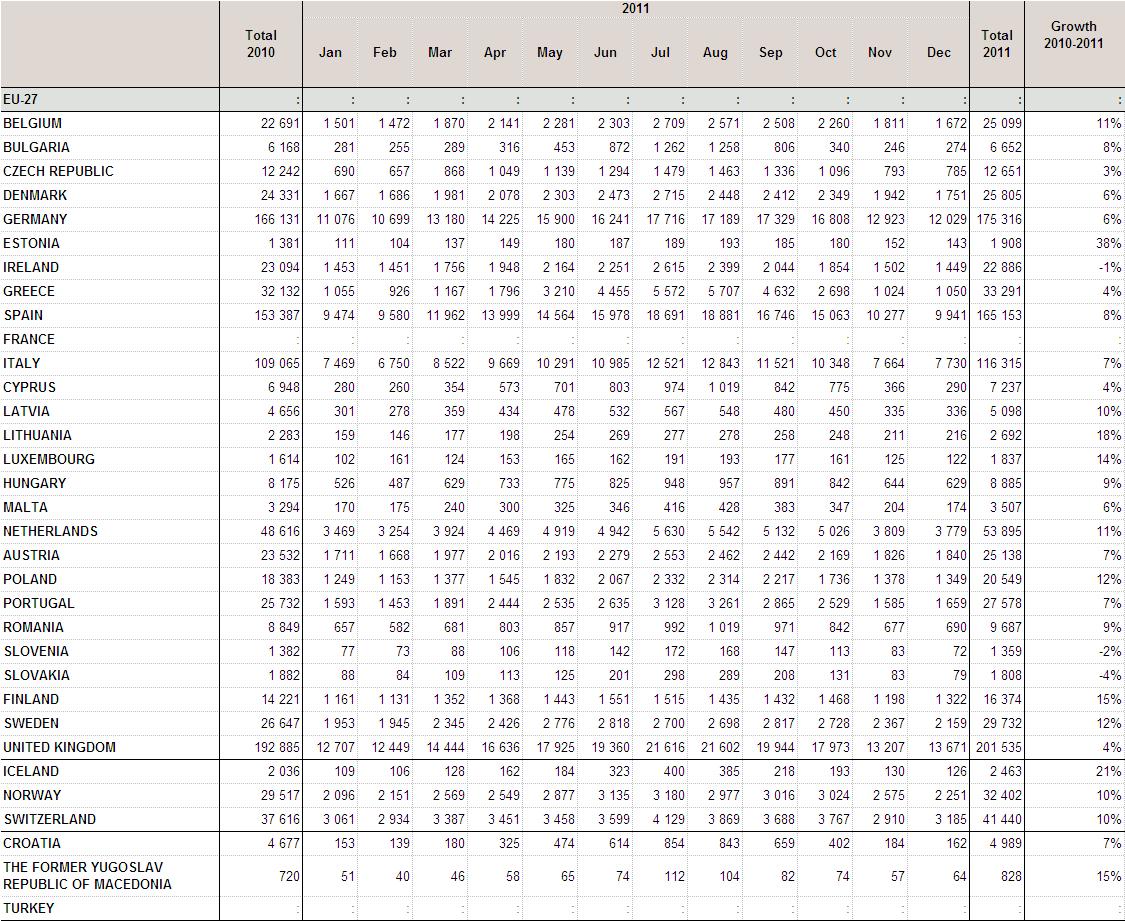
Air passengers carried (in 1000) per country in 2011.JPG
(
file
)
258 KB
1
10:56, 25 July 2012
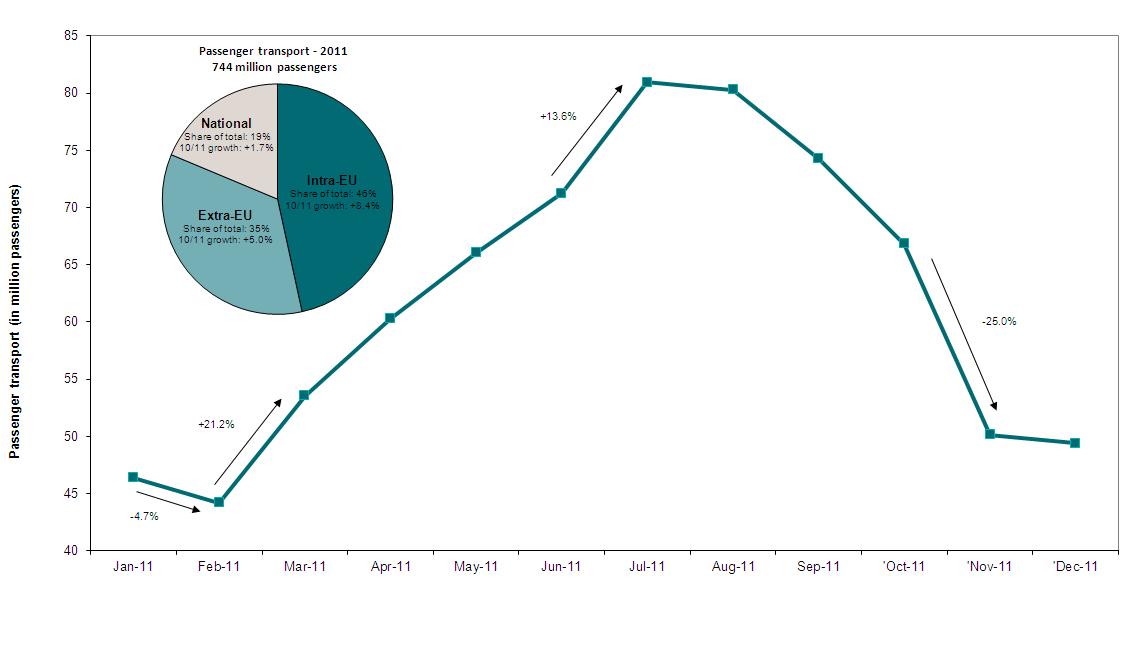
Graph1-monthly growth and share of EU-27 monthly passengers carried in 2011.JPG
(
file
)
48 KB
1
10:57, 25 July 2012
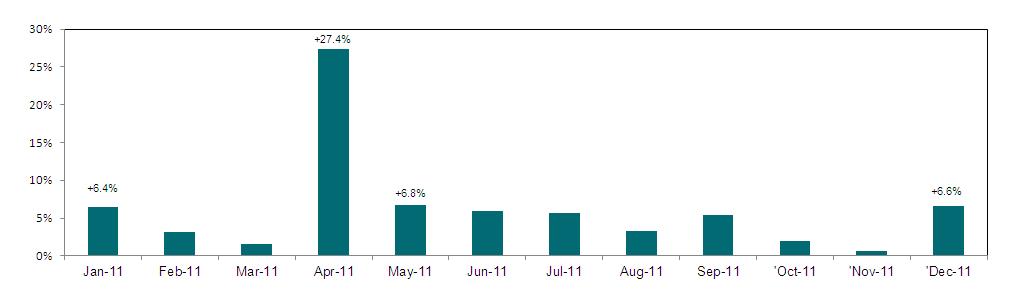
Monthly growth of EU-27 air passengers carried in 2011.JPG
(
file
)
21 KB
1
10:57, 25 July 2012
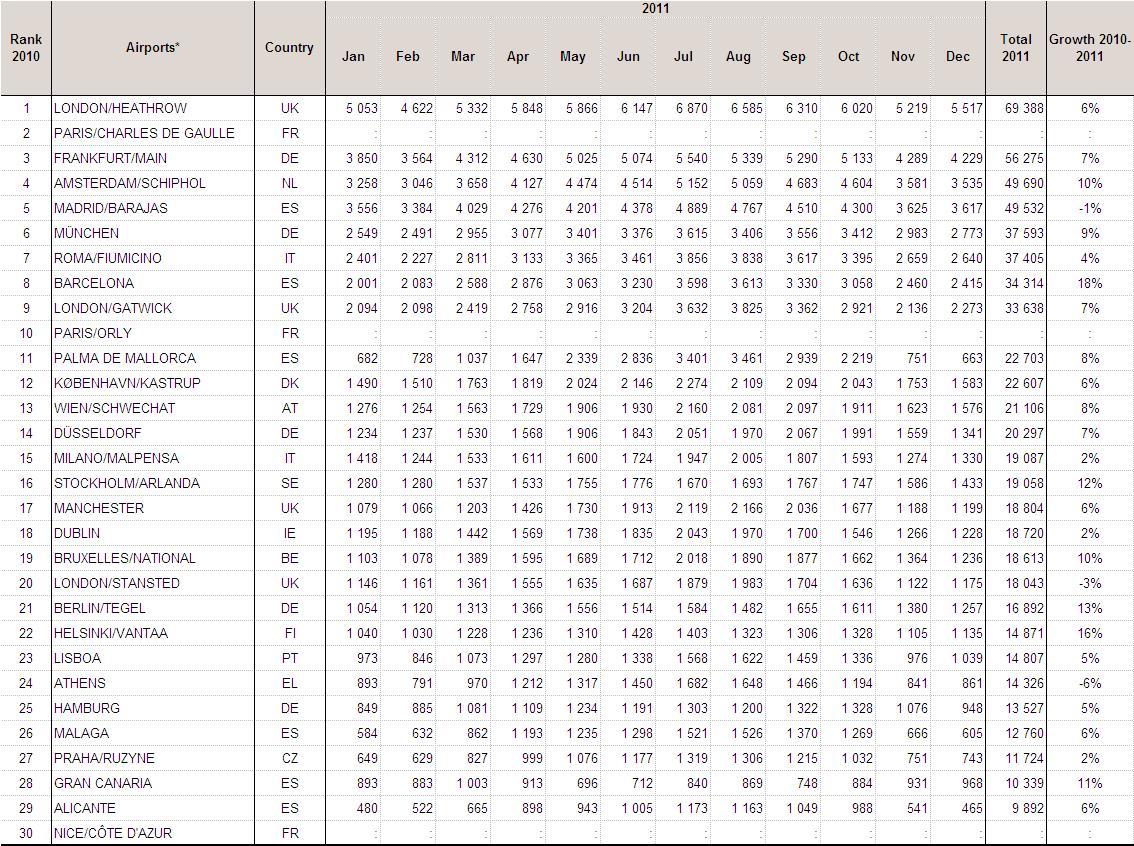
Passengers handled in top airports in 2011 (in 1000).JPG
(
file
)
257 KB
1
10:04, 19 June 2013
Thousand passengers carried monthly data 2012s1.PNG
(
file
)
75 KB
1
10:05, 19 June 2013
Thousand passengers handled in top airports monthly data 2012s1.PNG
(
file
)
71 KB
1
10:09, 16 July 2013
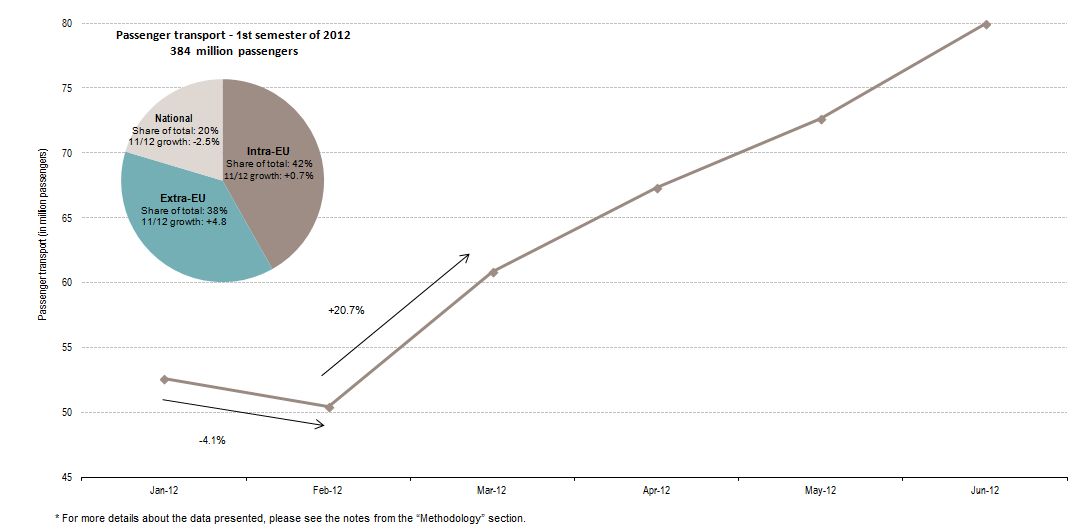
Monthly growth and share EU-27 monthly passengers carried 2012s1.PNG
(
file
)
26 KB
1
11:56, 16 July 2013
Evolution of EU-27 passengers carried 2012s1.PNG
(
file
)
10 KB
1
13:15, 24 July 2013
CO2 emissions for total air transport at EU-27 level between 2007 and 2010 (2007=100).PNG
(
file
)
21 KB
1
13:16, 24 July 2013
CO2 emissions in EU-27 by main country pairs (in million kilogrammes), 2010.jpg
(
file
)
839 KB
1
13:16, 24 July 2013
Top EU-27 airports in terms of CO2 emissions (by unit), 2010.PNG
(
file
)
35 KB
1
08:33, 26 July 2013
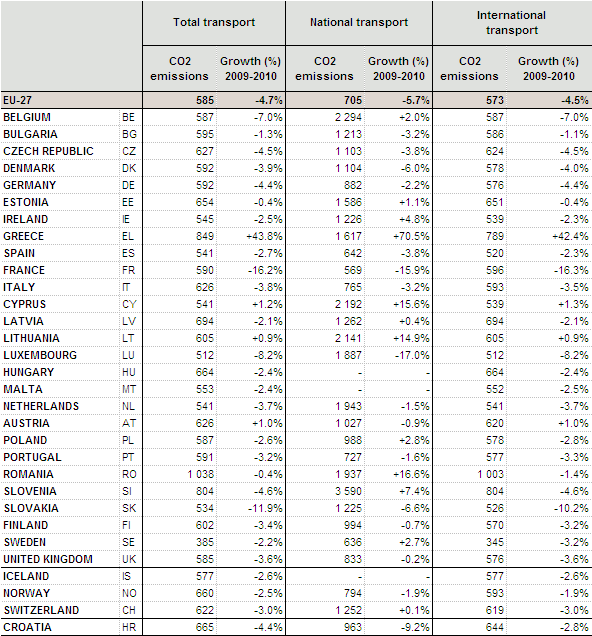
CO2 emissions by reporting country and destination (in grams per total payload tonne-kilometres), 2010 and 2009-2010 growth.PNG
(
file
)
42 KB
2
14:40, 26 August 2013
SE Types of Goods 2012.xls
(
file
)
118 KB
3
14:26, 8 October 2013
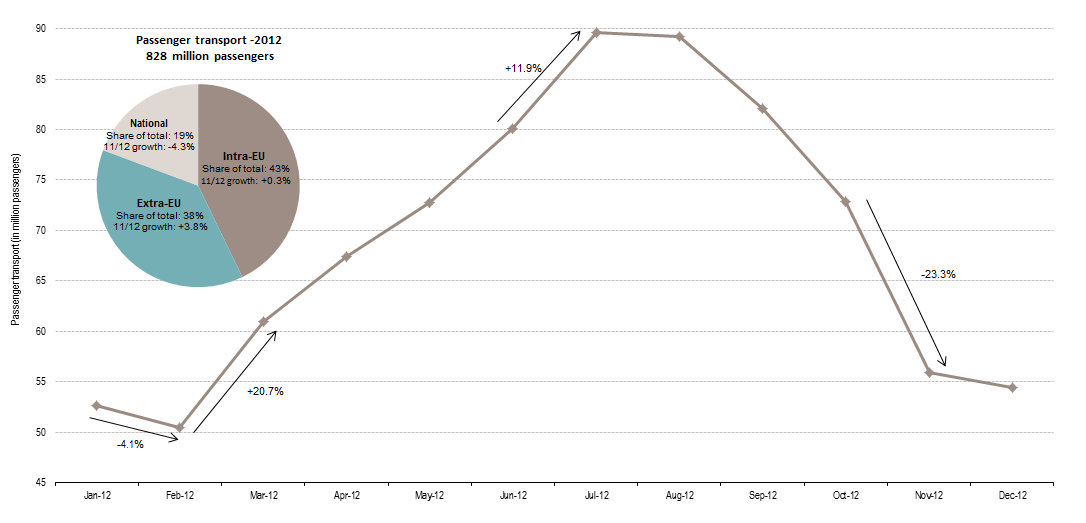
Monthly growth and share EU-27 monthly passengers carried 2012.PNG
(
file
)
30 KB
1
14:26, 8 October 2013
Evolution of EU-27 passengers carried 2012.PNG
(
file
)
8 KB
1
14:49, 8 October 2013
Monthly growth and share EU-28 monthly passengers carried 2012.PNG
(
file
)
30 KB
1
14:49, 8 October 2013
Evolution of EU-28 passengers carried 2012.PNG
(
file
)
8 KB
1
16:31, 14 October 2013
Thousand passengers carried monthly data 2012.PNG
(
file
)
51 KB
3
16:32, 14 October 2013
Thousand passengers handled in top airports monthly data 2012.PNG
(
file
)
50 KB
2
15:52, 15 November 2013
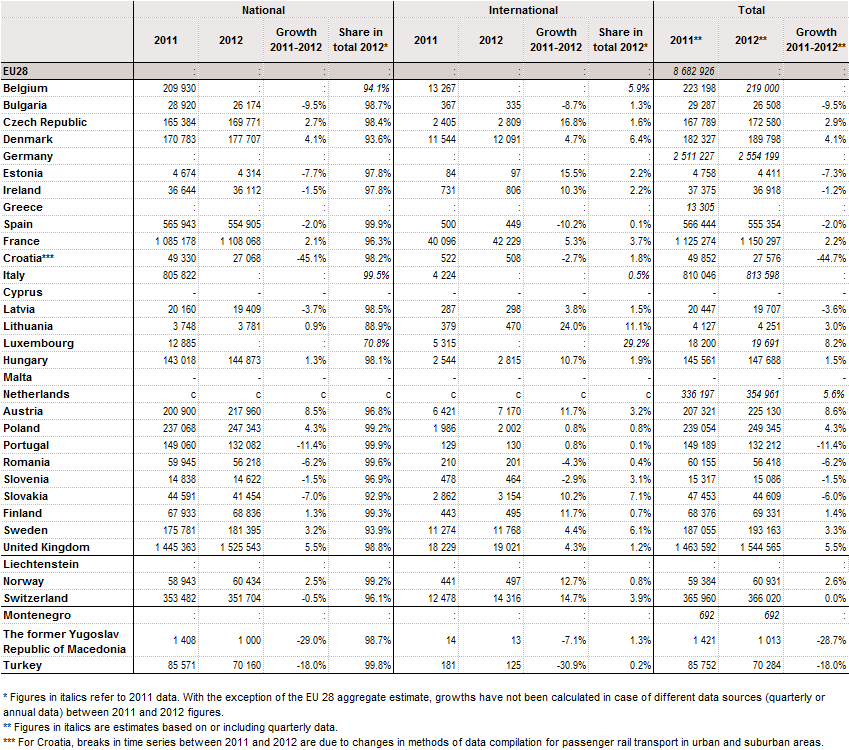
Evolution rail passenger transport 2011-2012 (1000 passengers).png
(
file
)
61 KB
1
15:54, 15 November 2013
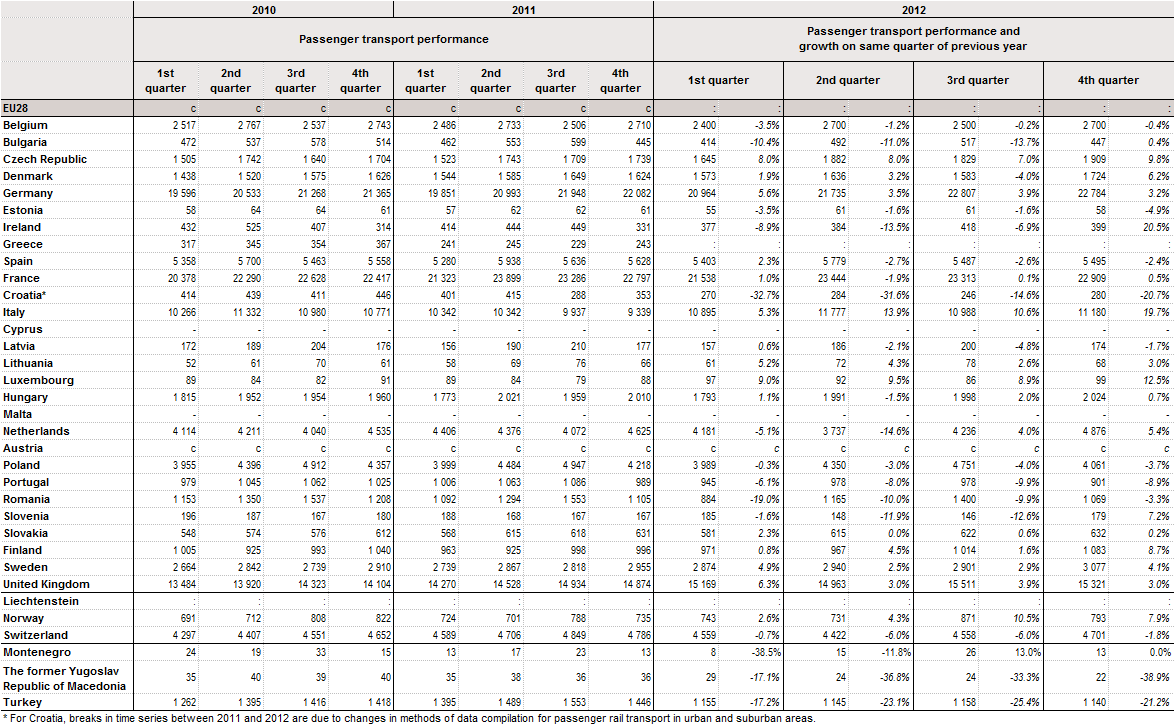
Quarterly evolution rail passenger transport (mio pkm).png
(
file
)
69 KB
2
15:54, 15 November 2013
Quarterly evolution rail passenger transport EU28 (mio pkm).png
(
file
)
40 KB
1
12:00, 4 December 2013
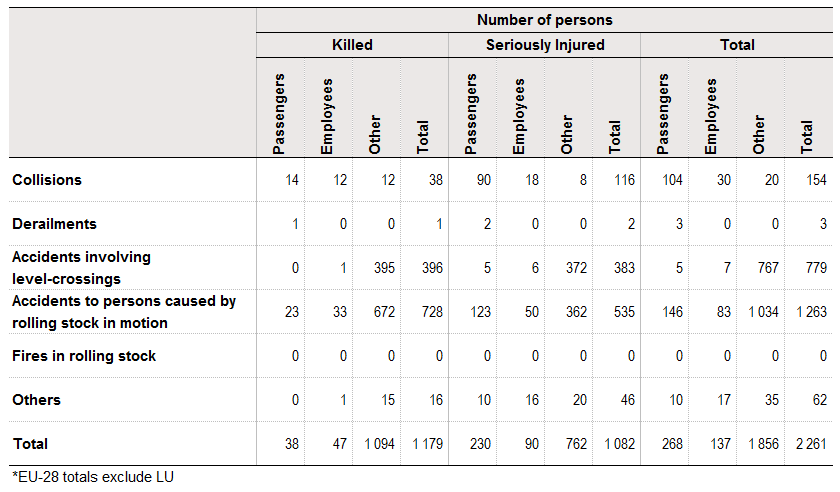
No of persons killed and injured by type of rail accident and category of persons EU-28, 2012.png
(
file
)
22 KB
1
12:01, 4 December 2013
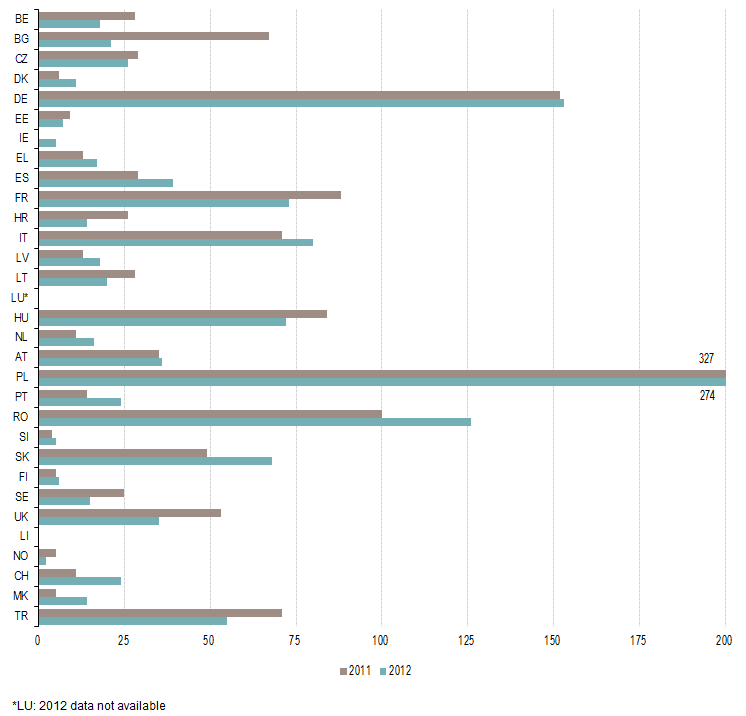
No of persons killed in railway accidents, 2011-2012.png
(
file
)
16 KB
1
12:01, 4 December 2013
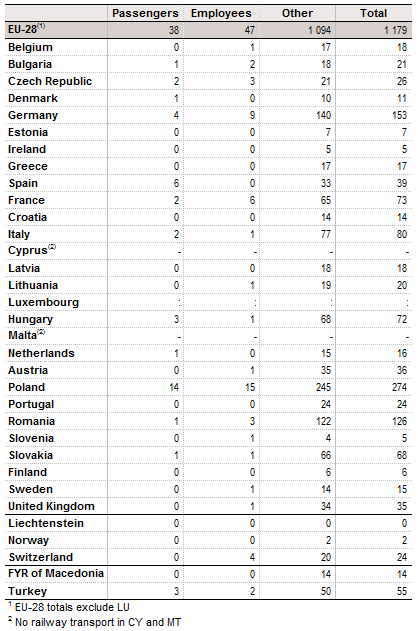
Rail fatalities by category of persons, 2012.png
(
file
)
20 KB
1
12:01, 4 December 2013
Rail fatalities by type of accident, 2012.png
(
file
)
27 KB
1
12:01, 4 December 2013
Rail traffic performance and no of significant accidents EU-28, 2012.png
(
file
)
32 KB
1
12:02, 4 December 2013
Train passengers killed per billion passenger-km, 2011-2012.png
(
file
)
18 KB
1
16:45, 11 December 2013
Quarterly evolution of total freight transport by railways 2011-2013 - in million tkm.png
(
file
)
51 KB
1
16:46, 11 December 2013
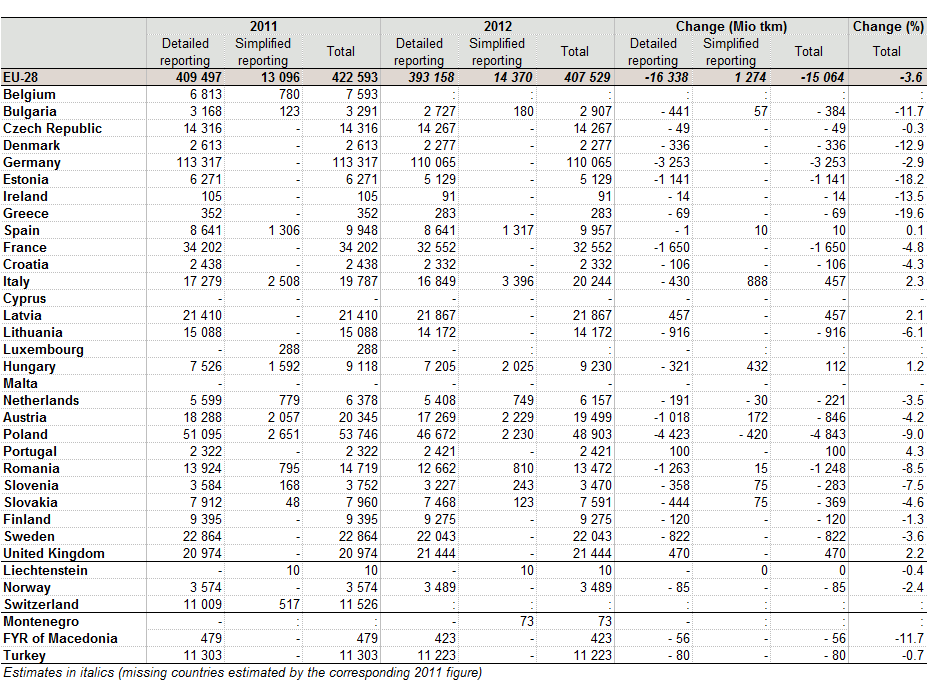
Evolution of total freight transport by rail - change between 2011 - 2012 - in million tkm and in %.png
(
file
)
49 KB
1
16:46, 11 December 2013
The development of rail transport - change between 2011 and 2012 - in million tkm.png
(
file
)
22 KB
1
16:46, 11 December 2013
Rail transport of goods by country in 2012 - in billion tkm.png
(
file
)
21 KB
1
10:37, 14 January 2014
Monthly growth and share EU-28 monthly passengers carried 2012-Q12013.PNG
(
file
)
38 KB
1
First page
Previous page
Next page
Last page
Special page
ISSN 2443-8219

_per_country-monthly_data_for_2010.JPG)
-monthly_data_for_2010.JPG)
.JPG)
_per_country_(07-11).JPG)
_(07-11).JPG)
.JPG)

_per_country_(2010_and_1st_quarter_2011).JPG)
.JPG)
.JPG)
_(2010_and_1st_quarter_2011).JPG)
_per_country_(Three_first_quarters_2011).JPG)

.JPG)
_(Three_first_quarters_2011).JPG)
_per_country_in_2011.JPG)


.JPG)


.PNG)
,_2010.jpg)
,_2010.PNG)
,_2010_and_2009-2010_growth.PNG)


.png)
.png)
.png)


