Tutorials
Log in
Statistics Explained
menu
search
search
Navigation
Main page
Statistical themes
Glossary
Categories
Statistics 4 beginners
Tutorials
Help
Eurostat home
Education corner
Online publications
Regional yearbook
Sustainable development
Full list
Tools
User contributions
Logs
View user groups
Special pages
search
Navigation
Main page
Statistical themes
Glossary
Categories
Statistics 4 beginners
Tutorials
Help
Eurostat home
Education corner
Online publications
Regional yearbook
Sustainable development
Full list
Tools
User contributions
Logs
View user groups
Special pages
Navigation
Main page
Statistical themes
Glossary
Categories
Statistics 4 beginners
Tutorials
Help
Eurostat home
Education corner
Online publications
Regional yearbook
Sustainable development
Full list
Tools
User contributions
Logs
View user groups
Special pages
Uploads by Dimitch
This special page shows all uploaded files.
File list
Items per page:
20
50
100
250
500
Search for media name:
Username:
Include old versions of files
Go
First page
Previous page
Next page
Last page
Date
Name
Thumbnail
Size
Description
Versions
15:15, 18 September 2009
Evolution of the number of tourism nights in EU27, 2008.PNG
(
file
)
27 KB
1
15:47, 18 September 2009
Evolution (percentage change) of the number of tourism nights EU27, 2008.PNG
(
file
)
32 KB
1
15:48, 18 September 2009
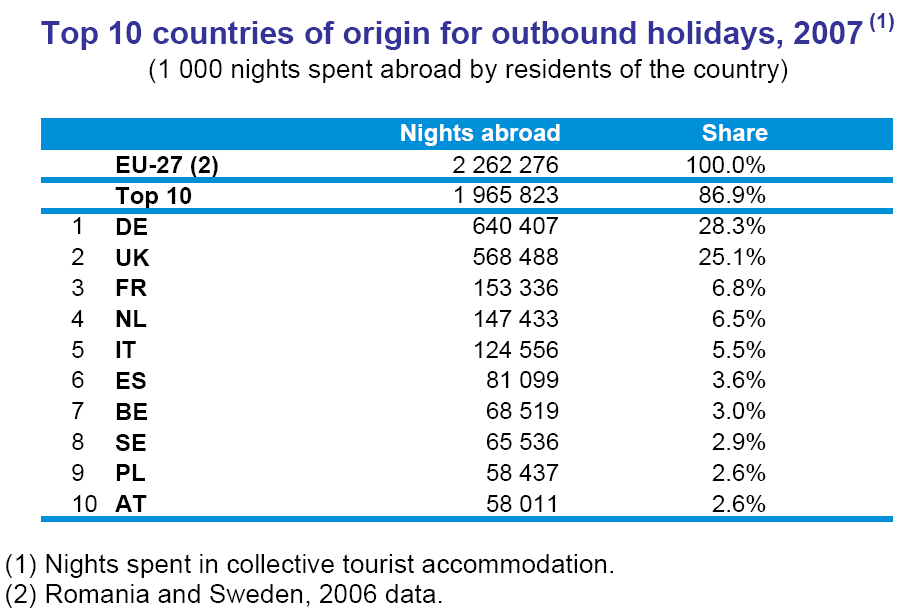
Top 10 countries of origin for outbound holidays, 2007.PNG
(
file
)
44 KB
1
15:02, 22 September 2009
Holiday trips of EU residents (aged 15 or more), 2007.PNG
(
file
)
27 KB
2
12:55, 2 October 2009
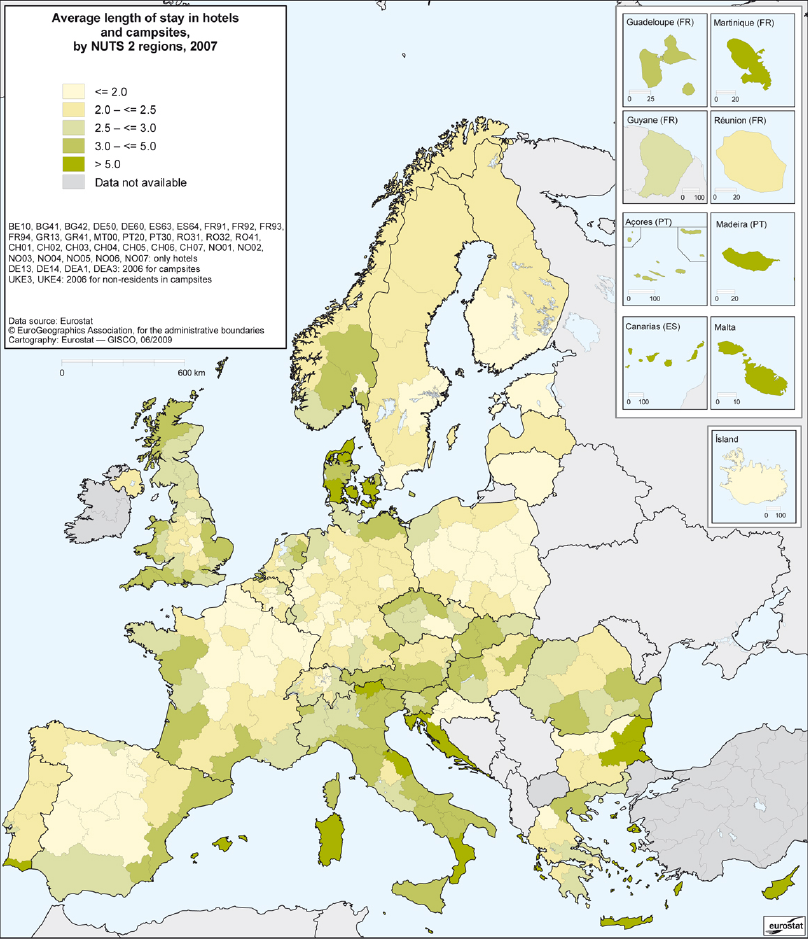
Average length of stay (days) in hotels and campsites, by NUTS 2 regions, 2007.PNG
(
file
)
553 KB
1
12:56, 2 October 2009
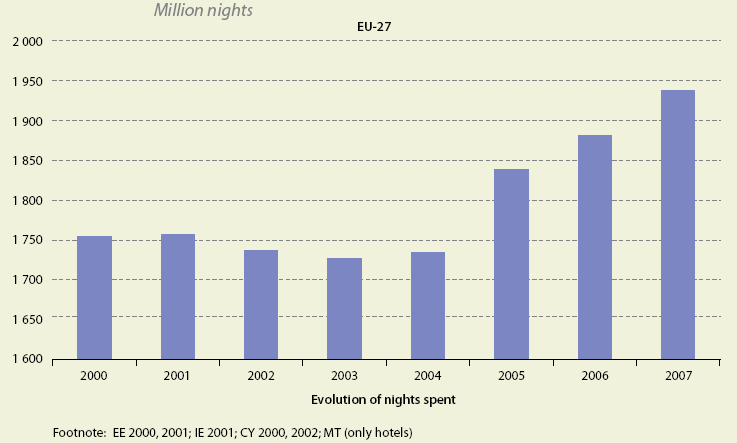
Evolution of nights spent in hotels and campsites 2000–07 in the EU-27.PNG
(
file
)
17 KB
1
12:57, 2 October 2009
Nights spent in hotels and campsites per 1 000 inhabitants, by NUTS 2 regions, 2007.PNG
(
file
)
551 KB
1
12:58, 2 October 2009
Nights spent in hotels and campsites, by NUTS 2 regions, 2007.PNG
(
file
)
550 KB
1
12:59, 2 October 2009
Nights spent in hotels and campsites, by NUTS 2 regions, average annual change rate 2003–07.PNG
(
file
)
544 KB
1
12:59, 2 October 2009
Nights spent in hotels and campsites, EU-27, average annual change rate 2003–07.PNG
(
file
)
23 KB
1
13:00, 2 October 2009
Number of bedplaces in hotels and campsites per 1 000 inhabitants, by NUTS 2 regions, 2007.PNG
(
file
)
531 KB
2
13:01, 2 October 2009
Share of non-resident nights spent in hotels and campsites, by NUTS 2 regions, 2007.PNG
(
file
)
546 KB
1
13:01, 2 October 2009
Top 20 EU-27 tourist regions, number of bedplaces by type of accommodation, by NUTS 2 regions, 2007.PNG
(
file
)
29 KB
2
13:02, 2 October 2009
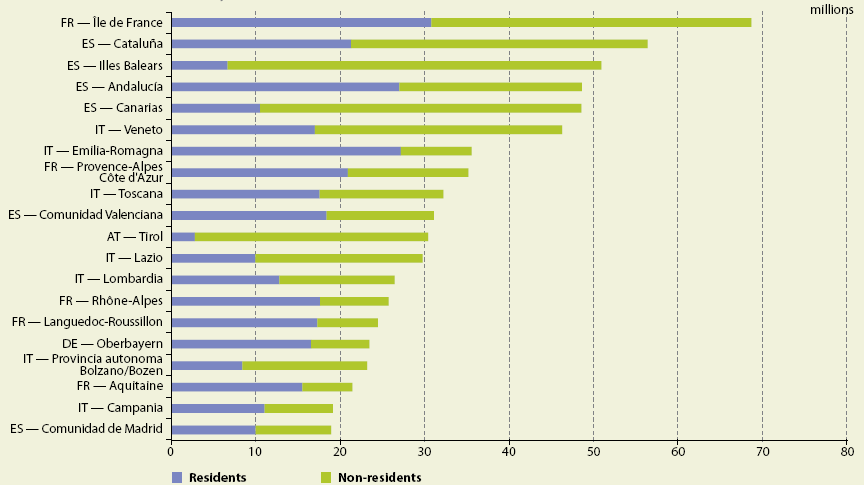
Top 20 EU-27 tourist regions, number of nights spent in hotels and campsites, by NUTS 2 regions, 2007.PNG
(
file
)
28 KB
1
16:12, 7 October 2010
Evolution of the number of tourism nights in EU-27, 1995-2009.png
(
file
)
3 KB
1
16:16, 7 October 2010
Evolution (percentage change) of the number of tourism nights spent by residents and non-residents in collective tourist accommodation, EU-27, 1996-2009.png
(
file
)
3 KB
1
16:24, 7 October 2010
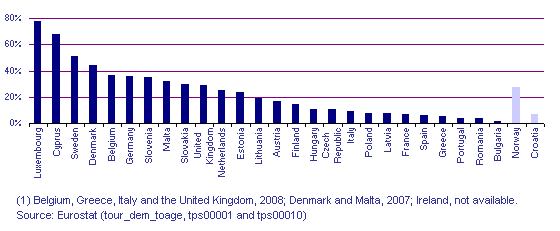
Proportion of the population aged 15+ going on holiday abroad for at least four nights, 2009 (1).png
(
file
)
4 KB
1
16:28, 7 October 2010
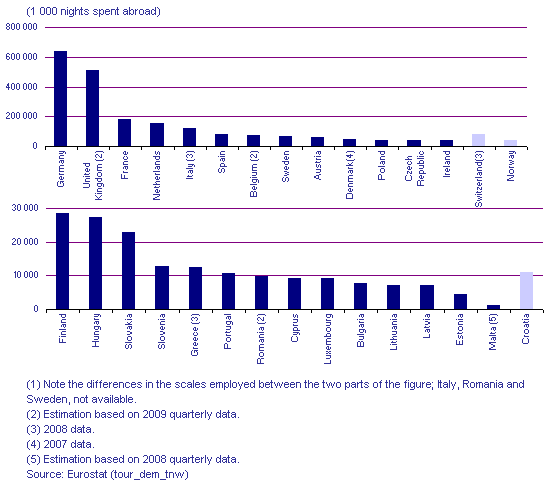
Country of origin for outbound holidays, 2009 (1).png
(
file
)
7 KB
1
16:31, 7 October 2010
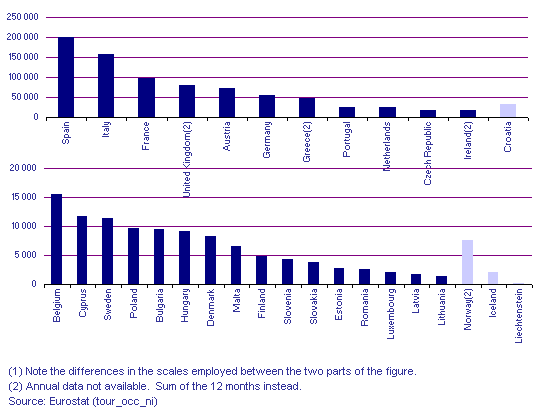
Tourism destinations, 2009 (1).png
(
file
)
6 KB
1
16:39, 7 October 2010
Tourism receipts and expenditure from travel, 2009.png
(
file
)
18 KB
1
16:59, 7 October 2010
Holiday trips of EU residents (aged 15 years or more), 2009.png
(
file
)
16 KB
Reverted to version as of 14:57, 7 October 2010
4
11:57, 13 October 2010
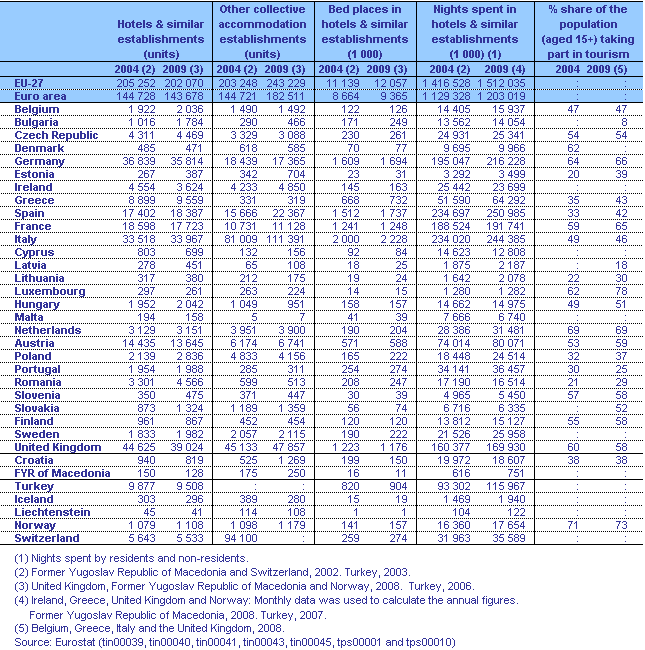
Leading tourism indicators, 2004 and 2009.png
(
file
)
24 KB
2
11:58, 13 October 2010
Country of origin for outbound holidays, 2009 - (average number of nights spent abroad per inhabitant).png
(
file
)
7 KB
1
15:26, 13 October 2010
Top 10 countries of origin for outbound holidays, 2009 (1).png
(
file
)
5 KB
3
10:49, 14 October 2010
Top 10 tourism destinations, 2009.png
(
file
)
5 KB
4
11:45, 14 October 2010
Tourism intensity, 2009.png
(
file
)
3 KB
3
15:46, 25 October 2010
Average length of stay in hotels and campsites, by NUTS 2 regions, 2008(1), (nights).png
(
file
)
188 KB
1
15:48, 25 October 2010
Evolution of nights spent in hotels and campsites, 2000-2008, in the EU-27(1).png
(
file
)
14 KB
1
15:48, 25 October 2010
Most popular tourist region per country, number of nights spent by residents in hotels and campsites, by NUTS 2 regions, 2008(1).png
(
file
)
63 KB
1
15:49, 25 October 2010
Nights spent by residents and non-residents in hotels and campsites, by NUTS 2 regions, 2008(1).png
(
file
)
196 KB
1
15:49, 25 October 2010
Nights spent by residents and non-residents in hotels and campsites, per 1 000 inhabitants, by NUTS 2 regions, 2008(1).png
(
file
)
197 KB
1
15:50, 25 October 2010
Nights spent by residents and non-residents in hotels and campsites, per km², by NUTS 2 regions, 2008(1).png
(
file
)
198 KB
1
15:50, 25 October 2010
Nights spent in hotels and campsites, by NUTS 2 regions, average annual change rate, 2004–2008(1), (%).png
(
file
)
196 KB
1
15:51, 25 October 2010
Nights spent in hotels and campsites, EU-27, average annual change rate, 2004–2008(1), (%).png
(
file
)
18 KB
1
15:51, 25 October 2010
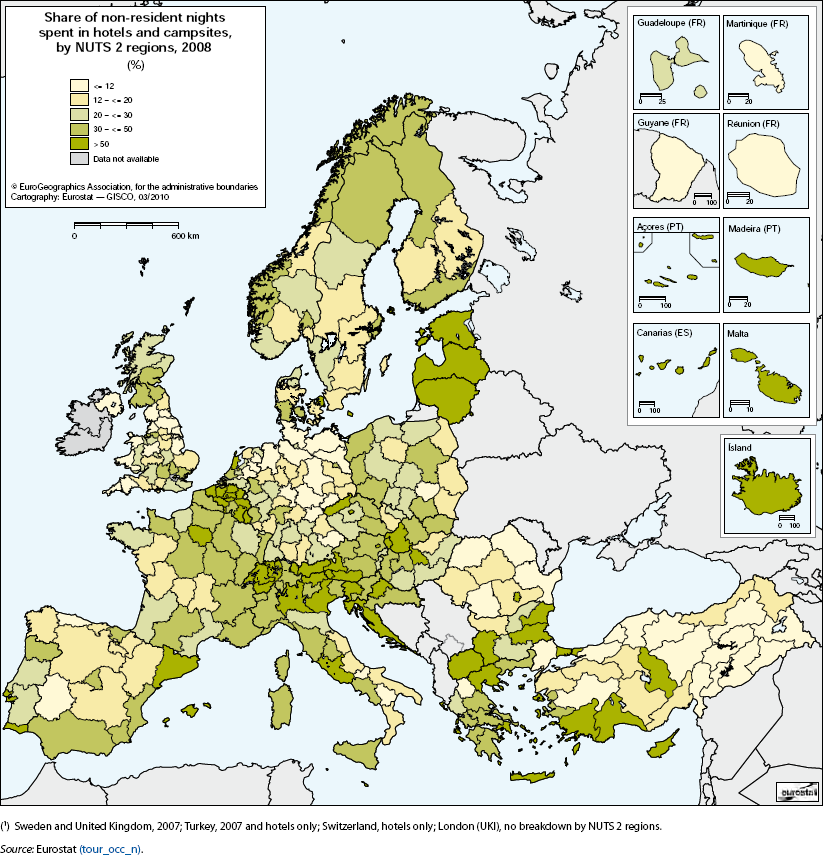
Share of non-resident nights spent in hotels and campsites, by NUTS 2 regions, 2008(1), (%).png
(
file
)
196 KB
1
15:51, 25 October 2010
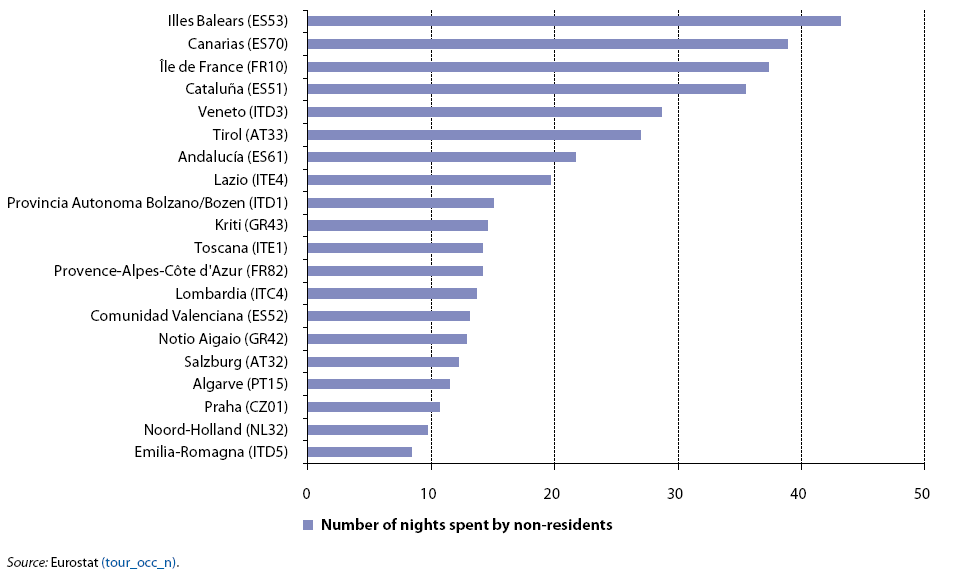
Top 20 EU-27 tourist regions, number of nights spent by non-residents in hotels and campsites, by NUTS 2 regions, 2008.png
(
file
)
25 KB
1
15:52, 25 October 2010
Top 20 EU-27 tourist regions, number of nights spent by residents and non-residents in hotels and campsites, by NUTS 2 regions, 2008.png
(
file
)
25 KB
1
11:36, 23 November 2010
Holiday trips made by the resident population in 2009, broken down by destination and distribution per quarter.png
(
file
)
50 KB
1
11:37, 23 November 2010
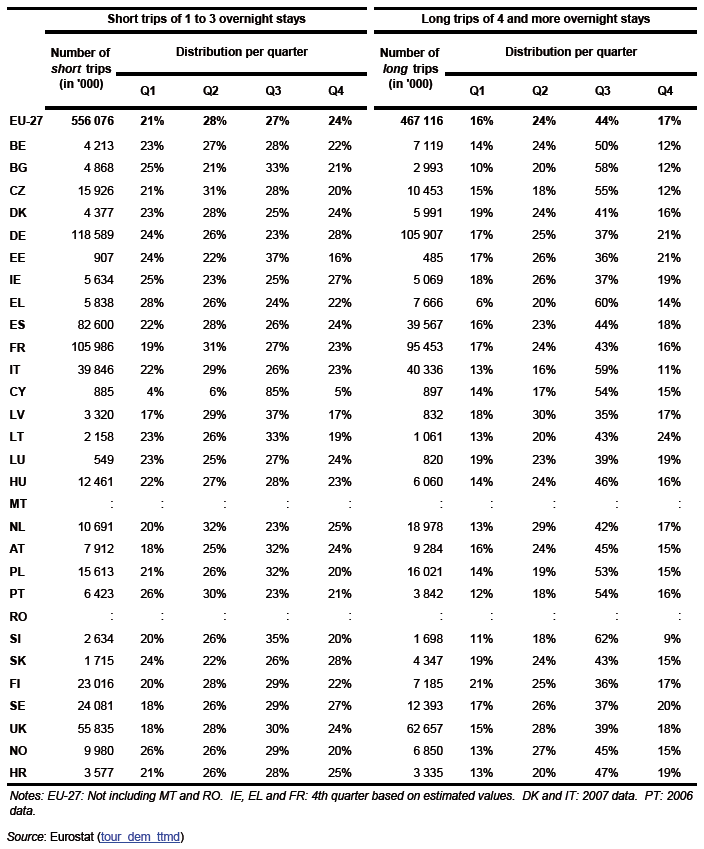
Holiday trips made by the resident population in 2009, broken down by length of stay and distribution per quarter.png
(
file
)
50 KB
1
15:16, 23 November 2010
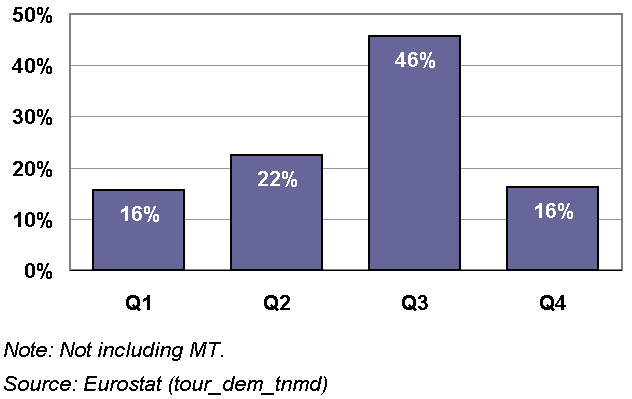
Distribution of holiday trips in the four quarters of 2009.png
(
file
)
5 KB
2
15:19, 23 November 2010
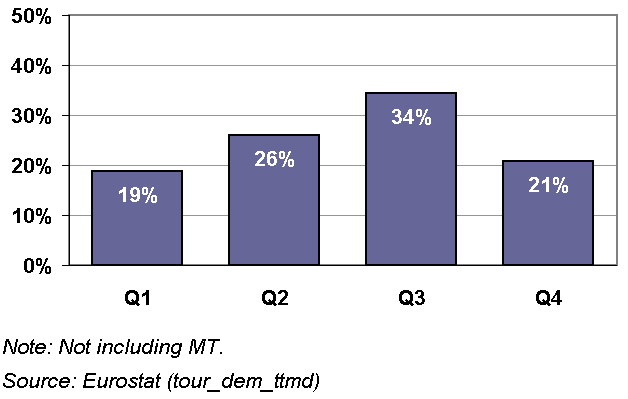
Distribution of nights spent in the four quarters of 2009.png
(
file
)
5 KB
2
15:56, 23 November 2010
Share of the resident population (aged 15 or over) who went on holiday at least once during the reference quarter of 2009, broken down by duration of trip.png
(
file
)
15 KB
2
16:19, 23 November 2010
Number of trips and nights spent away by EU residents in 2009, broken down by quarter.png
(
file
)
20 KB
2
16:46, 23 November 2010
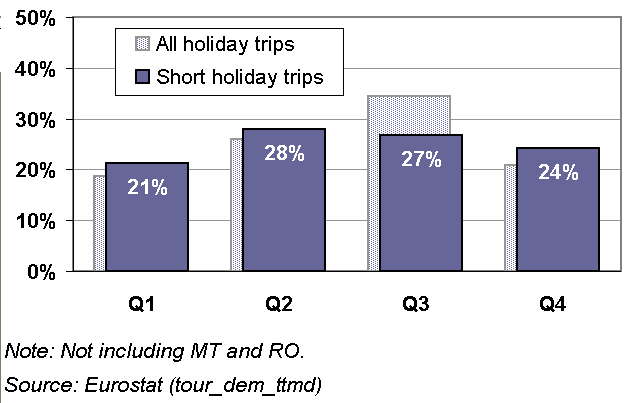
Distribution of short holiday trips in the four quarters of 2009.png
(
file
)
7 KB
2
16:49, 23 November 2010
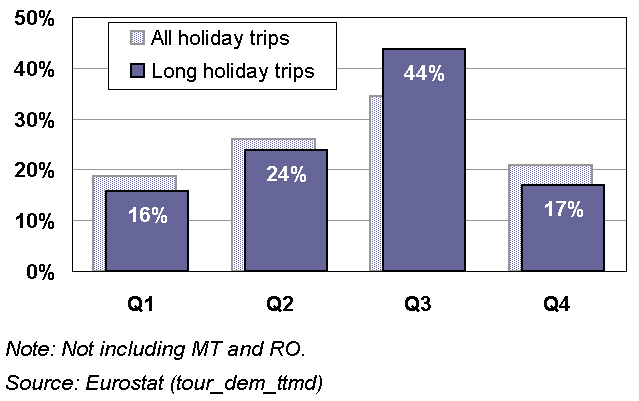
Distribution of long holiday trips in the four quarters of 2009.png
(
file
)
7 KB
2
16:17, 26 November 2010
Monthly distribution of nights spent in collective accommodation, 2009 (bimodal pattern with summer and winter peak).png
(
file
)
7 KB
1
16:19, 26 November 2010
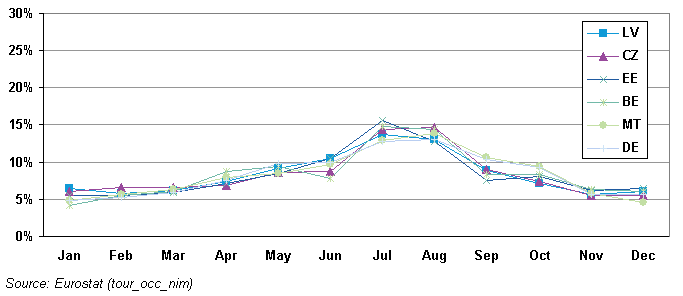
Monthly distribution of nights spent in collective accommodation, 2009 (countries having low seasonality, summer peak only).png
(
file
)
6 KB
1
16:19, 26 November 2010
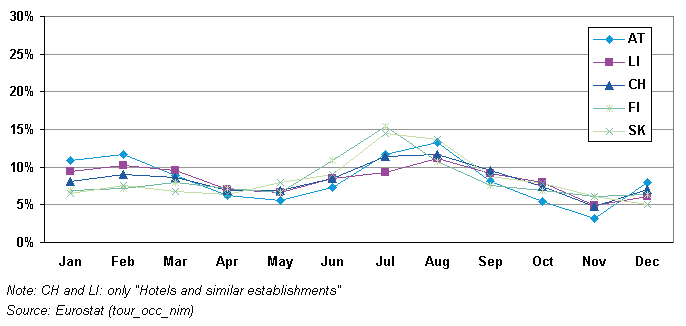
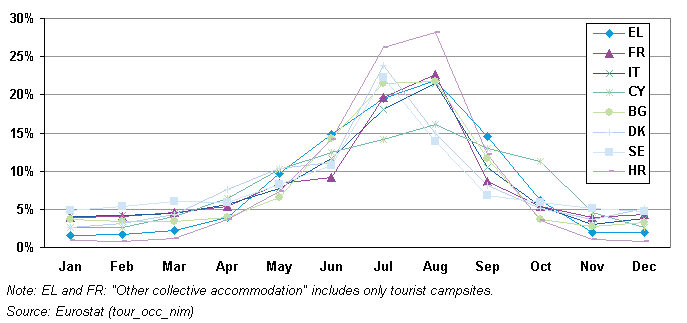
Monthly distribution of nights spent in collective accommodation, 2009 (countries with high seasonality).png
(
file
)
10 KB
1
16:20, 26 November 2010
Monthly distribution of the total nights spent in collective tourist accommodation, by country of origin of the guest (resident non-resident), 2009, EU-27.png
(
file
)
6 KB
1
16:21, 26 November 2010
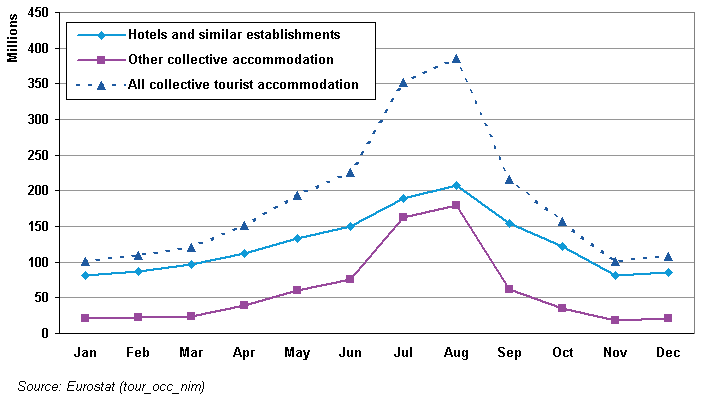
Monthly distribution of the total nights spent in collective tourist accommodation, by type of accommodation, 2009, EU-27.png
(
file
)
7 KB
1
First page
Previous page
Next page
Last page
Special page
ISSN 2443-8219

_of_the_number_of_tourism_nights_EU27,_2008.PNG)

,_2007.PNG)
_in_hotels_and_campsites,_by_NUTS_2_regions,_2007.PNG)


_of_the_number_of_tourism_nights_spent_by_residents_and_non-residents_in_collective_tourist_accommodation,_EU-27,_1996-2009.png)
.png)
.png)
.png)

,_2009.png)

.png)
.png)


,_(nights).png)
.png)
.png)
.png)
.png)
.png)
,_(%25).png)
,_(%25).png)
,_(%25).png)


_who_went_on_holiday_at_least_once_during_the_reference_quarter_of_2009,_broken_down_by_duration_of_trip.png)


.png)
.png)
.png)
,_2009,_EU-27.png)
