Tutorials
Log in
Statistics Explained
menu
search
search
Navigation
Main page
Statistical themes
Glossary
Categories
Statistics 4 beginners
Tutorials
Help
Eurostat home
Education corner
Online publications
Regional yearbook
Sustainable development
Full list
Tools
User contributions
Logs
View user groups
Special pages
search
Navigation
Main page
Statistical themes
Glossary
Categories
Statistics 4 beginners
Tutorials
Help
Eurostat home
Education corner
Online publications
Regional yearbook
Sustainable development
Full list
Tools
User contributions
Logs
View user groups
Special pages
Navigation
Main page
Statistical themes
Glossary
Categories
Statistics 4 beginners
Tutorials
Help
Eurostat home
Education corner
Online publications
Regional yearbook
Sustainable development
Full list
Tools
User contributions
Logs
View user groups
Special pages
Uploads by Difalem
This special page shows all uploaded files.
File list
Items per page:
20
50
100
250
500
Search for media name:
Username:
Include old versions of files
Go
Date
Name
Thumbnail
Size
Description
Versions
15:59, 22 May 2014
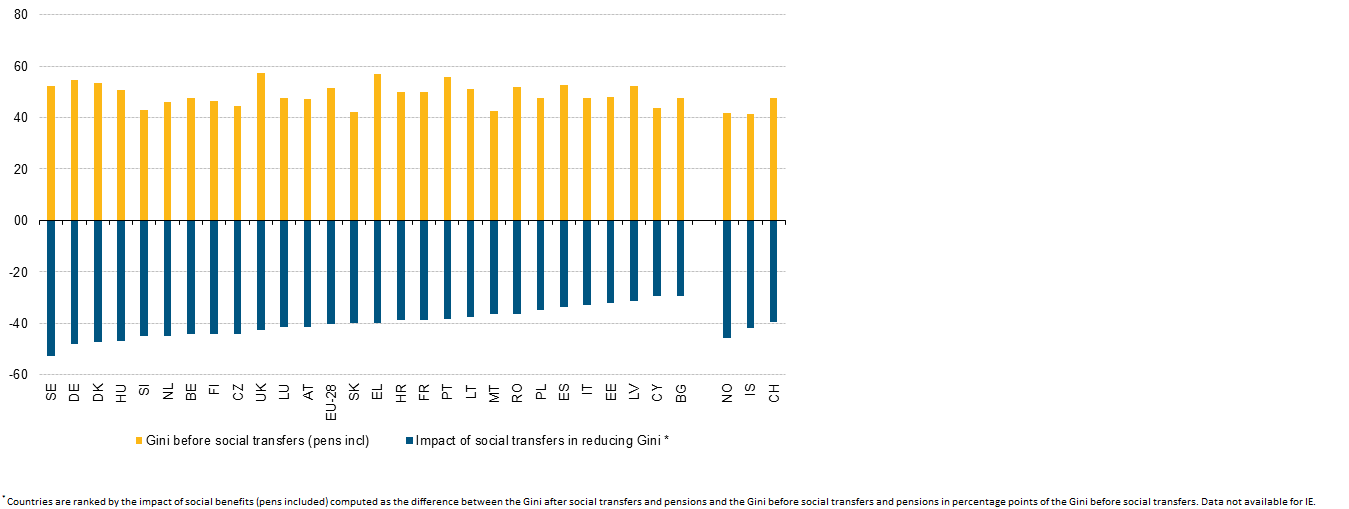
Gini coefficient before social transfers (pens incl), 2012.png
(
file
)
32 KB
1
16:08, 22 May 2014
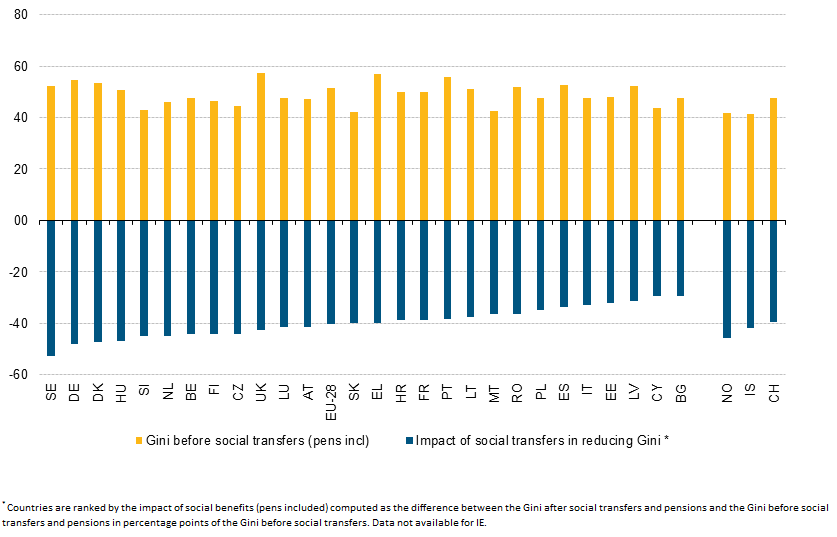
Gini coefficient before social transfers (pens incl), 2012 New.png
(
file
)
28 KB
1
16:13, 22 May 2014
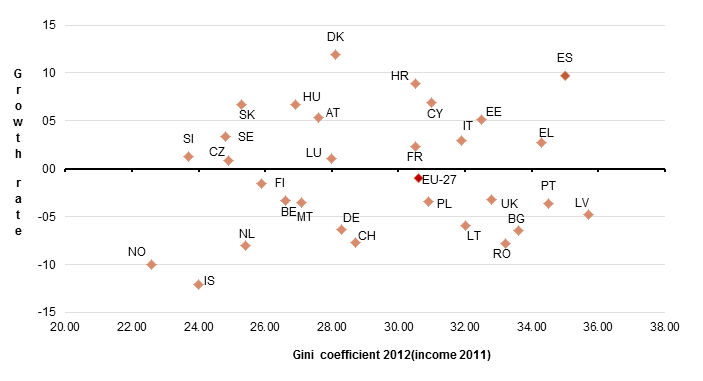
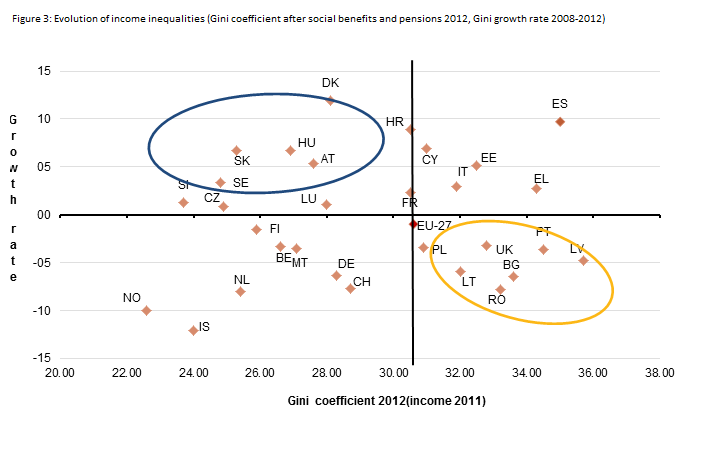
Evolution of income inequalities (Gini coefficient after social benefits and pensions 2012, Gini growth rate 2008-2012).png
(
file
)
16 KB
1
10:14, 4 June 2014
Evolution of income inequalities (Gini coefficient after social benefits and pensions 2012, Gini growth rate 2008-2012)2.png
(
file
)
27 KB
1
10:22, 4 June 2014
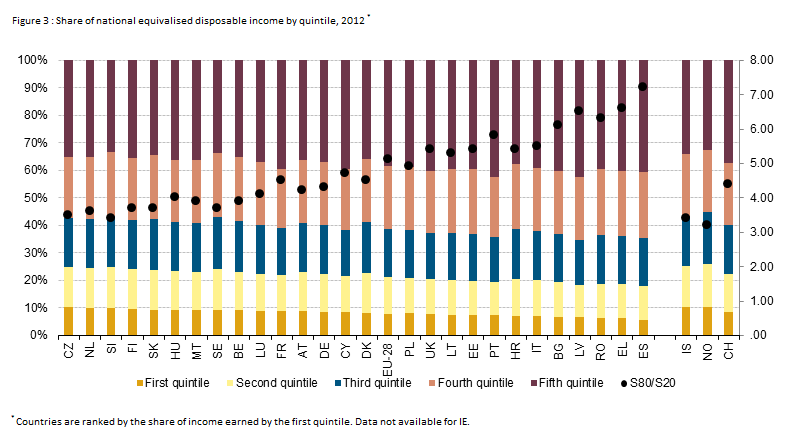
Share of national equivalised disposable income by quintile, 2012 .png
(
file
)
35 KB
1
10:56, 4 June 2014
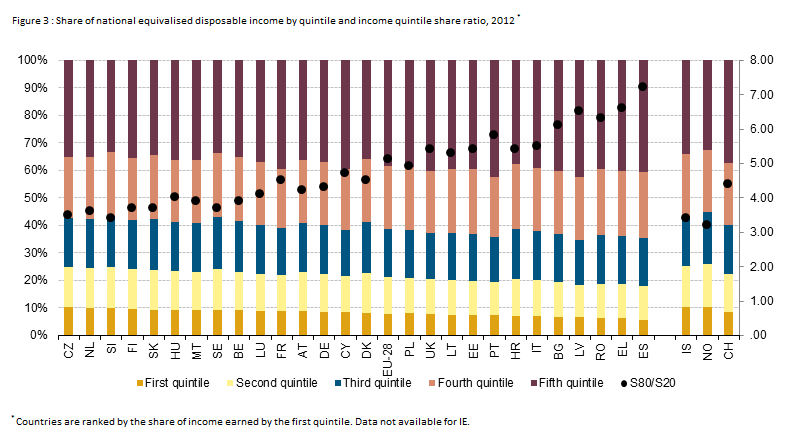
Share of national equivalised disposable income by quintile and income quintile share ratio, 2012 .png
(
file
)
35 KB
1
12:01, 4 June 2014
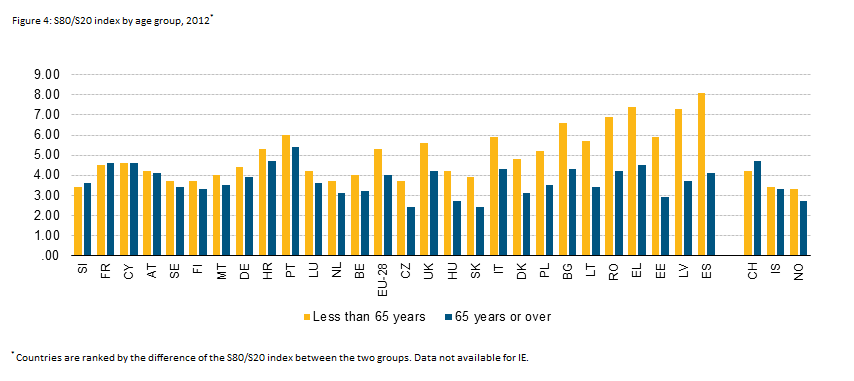
S80 S20 index by age group, 2012 .png
(
file
)
22 KB
1
12:03, 4 June 2014
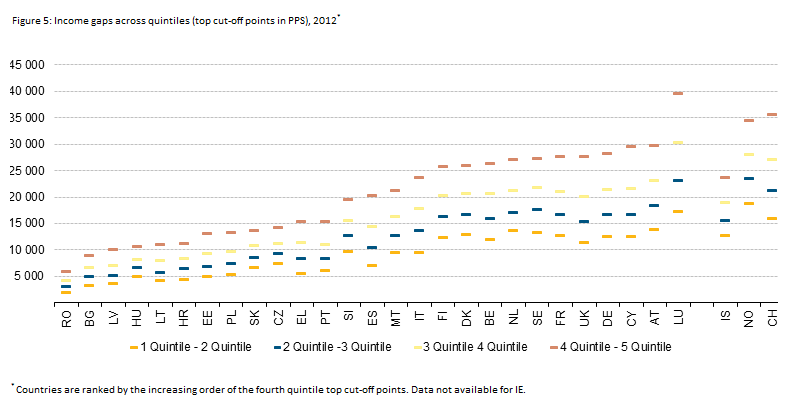
Income gaps across quintiles (top cut-off points in PPS), 2012 .png
(
file
)
18 KB
1
12:16, 4 June 2014
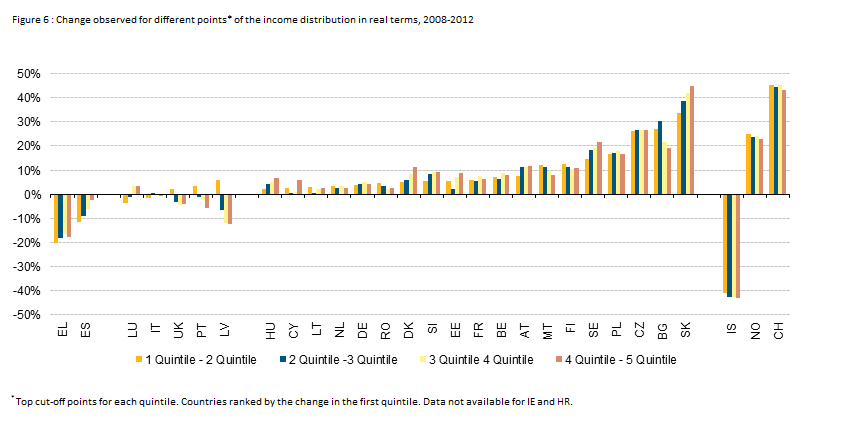
Change observed for different points of the income distribution in real terms, 2008-2012.png
(
file
)
22 KB
1
13:30, 4 June 2014
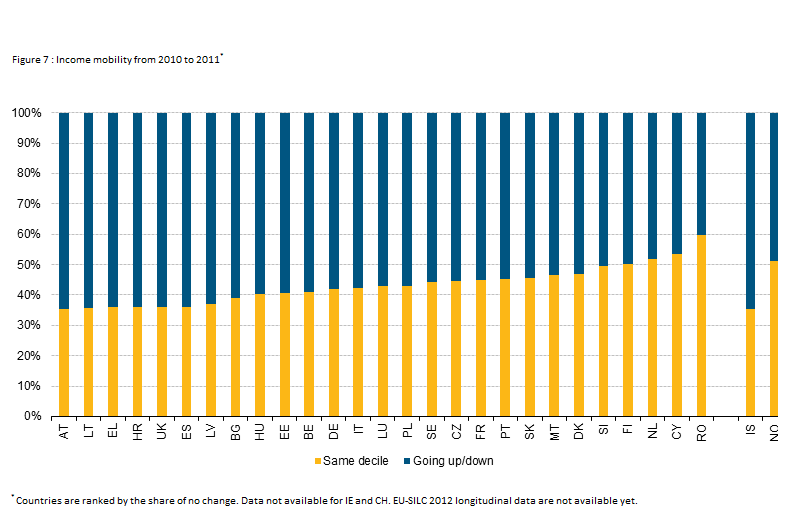
Income mobility from 2010 to 2011 .png
(
file
)
32 KB
1
13:34, 4 June 2014
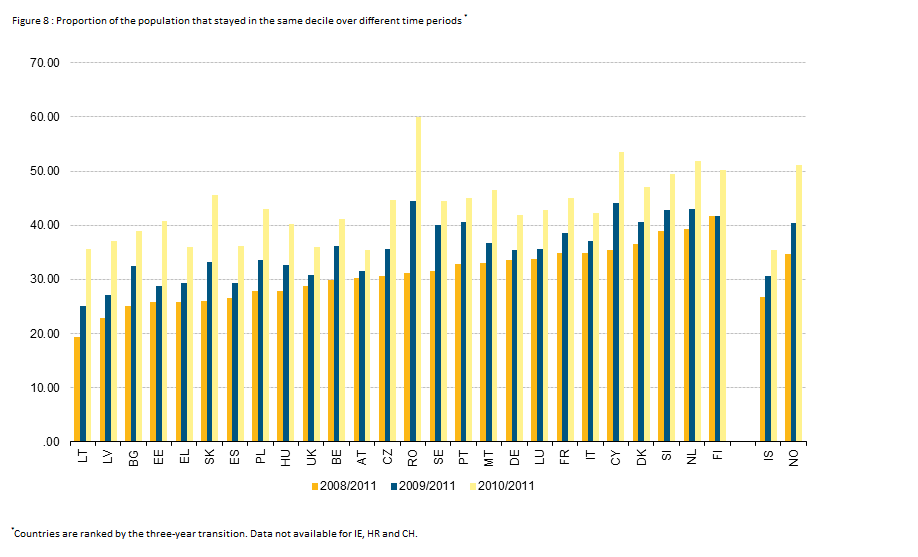
Proportion of the population that stayed in the same decile over different time periods.png
(
file
)
31 KB
1
15:31, 4 June 2014
Gini coefficient 2012.jpeg
(
file
)
1.2 MB
1
15:24, 13 June 2014
Gini coefficient before social transfers (pens excl), 2012.png
(
file
)
30 KB
1
18:23, 27 June 2014
Gini coefficient before social transfers (excluding pensions), 2012.png
(
file
)
34 KB
1
18:25, 27 June 2014
Evolution of income inequalities (Gini coefficient after social transfers and pensions 2012, Gini growth rate 2008-12).png
(
file
)
26 KB
1
18:27, 27 June 2014
Share of national equivalised disposable income by quintile and income quintile share ratio, 2012.png
(
file
)
37 KB
1
18:28, 27 June 2014
Income gaps across quintiles (top cut-off points in PPS), 2012.png
(
file
)
20 KB
1
18:29, 27 June 2014
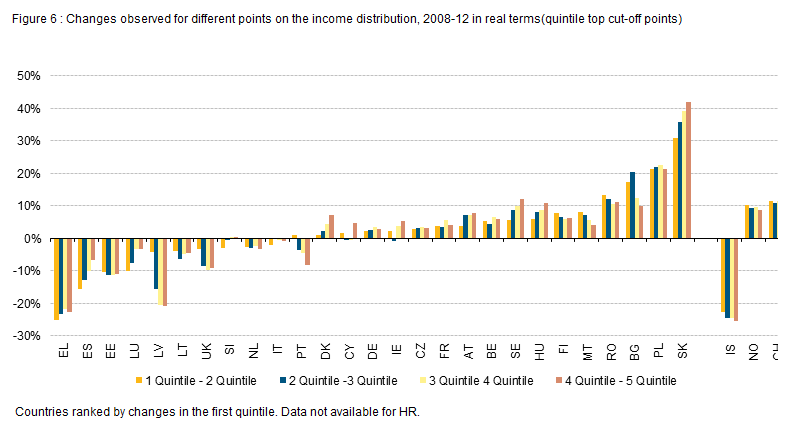
Changes observed for different points on the income distribution, 2008-12 in real terms(quintile top cut-off points).png
(
file
)
21 KB
1
18:30, 27 June 2014
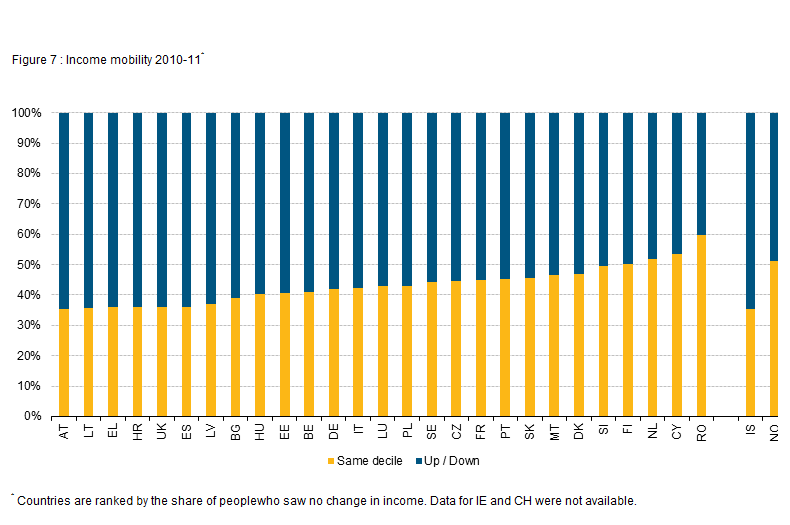
Income mobility 2010-11.png
(
file
)
33 KB
1
18:48, 27 June 2014
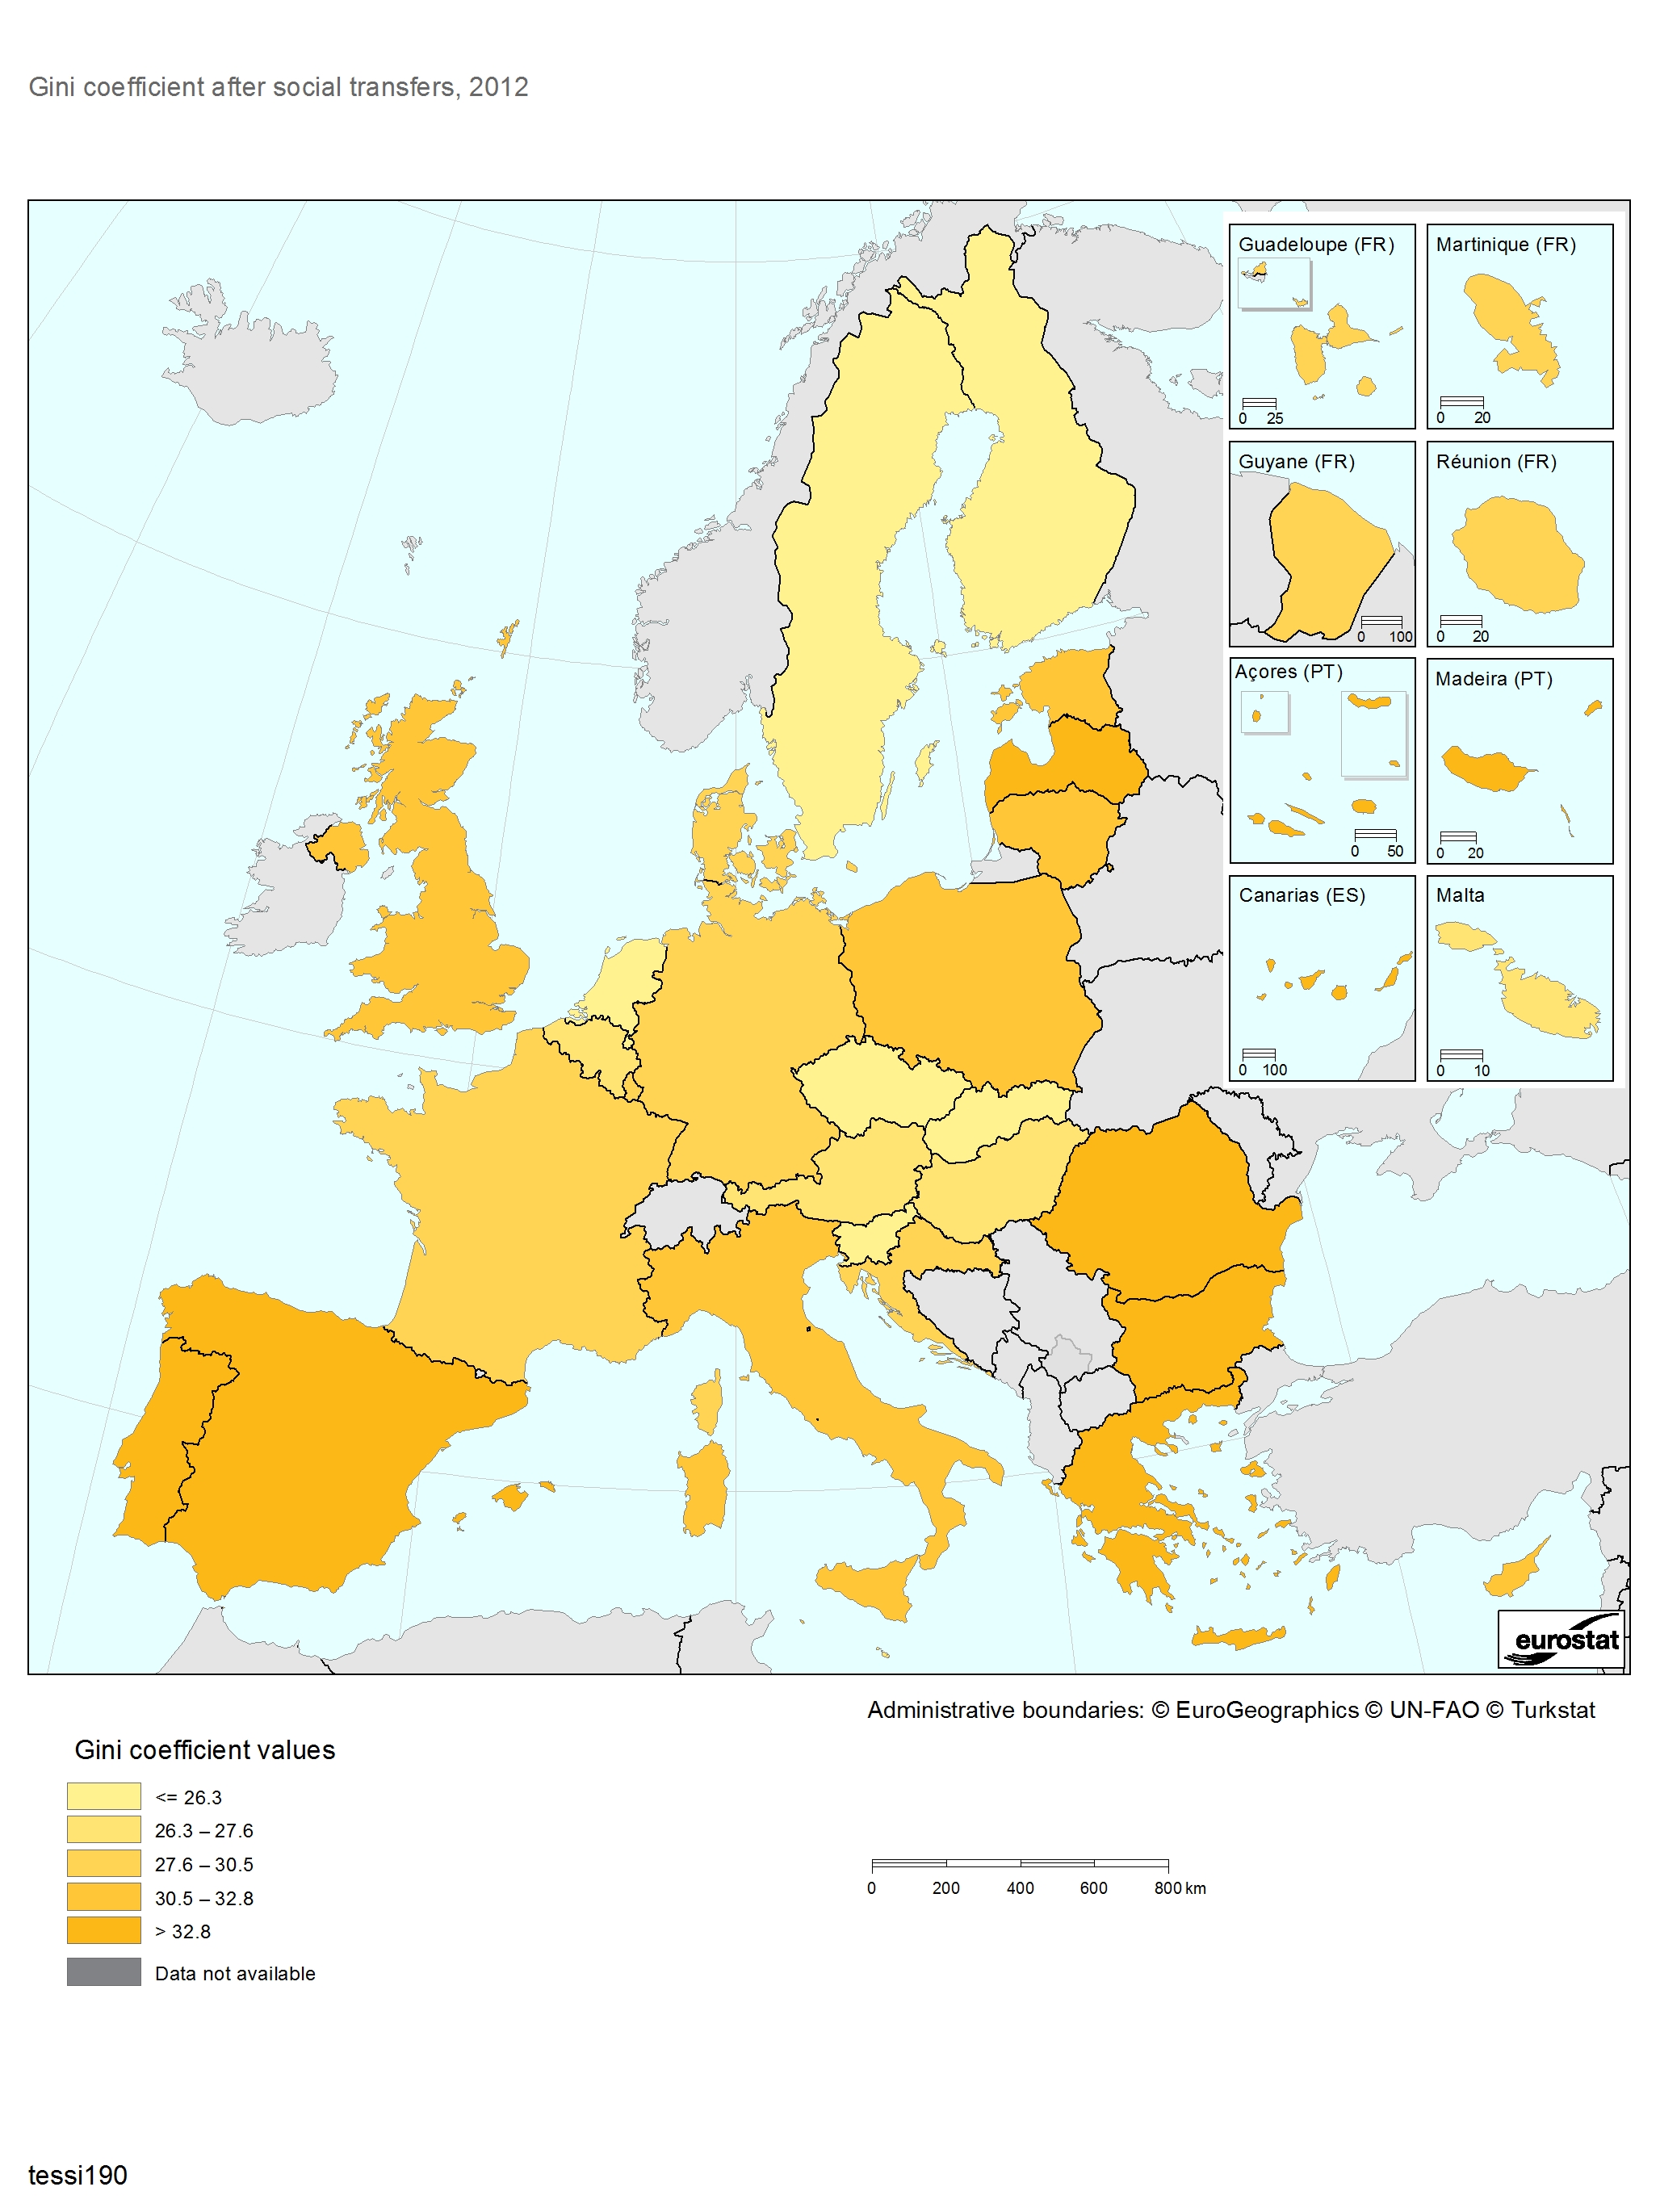
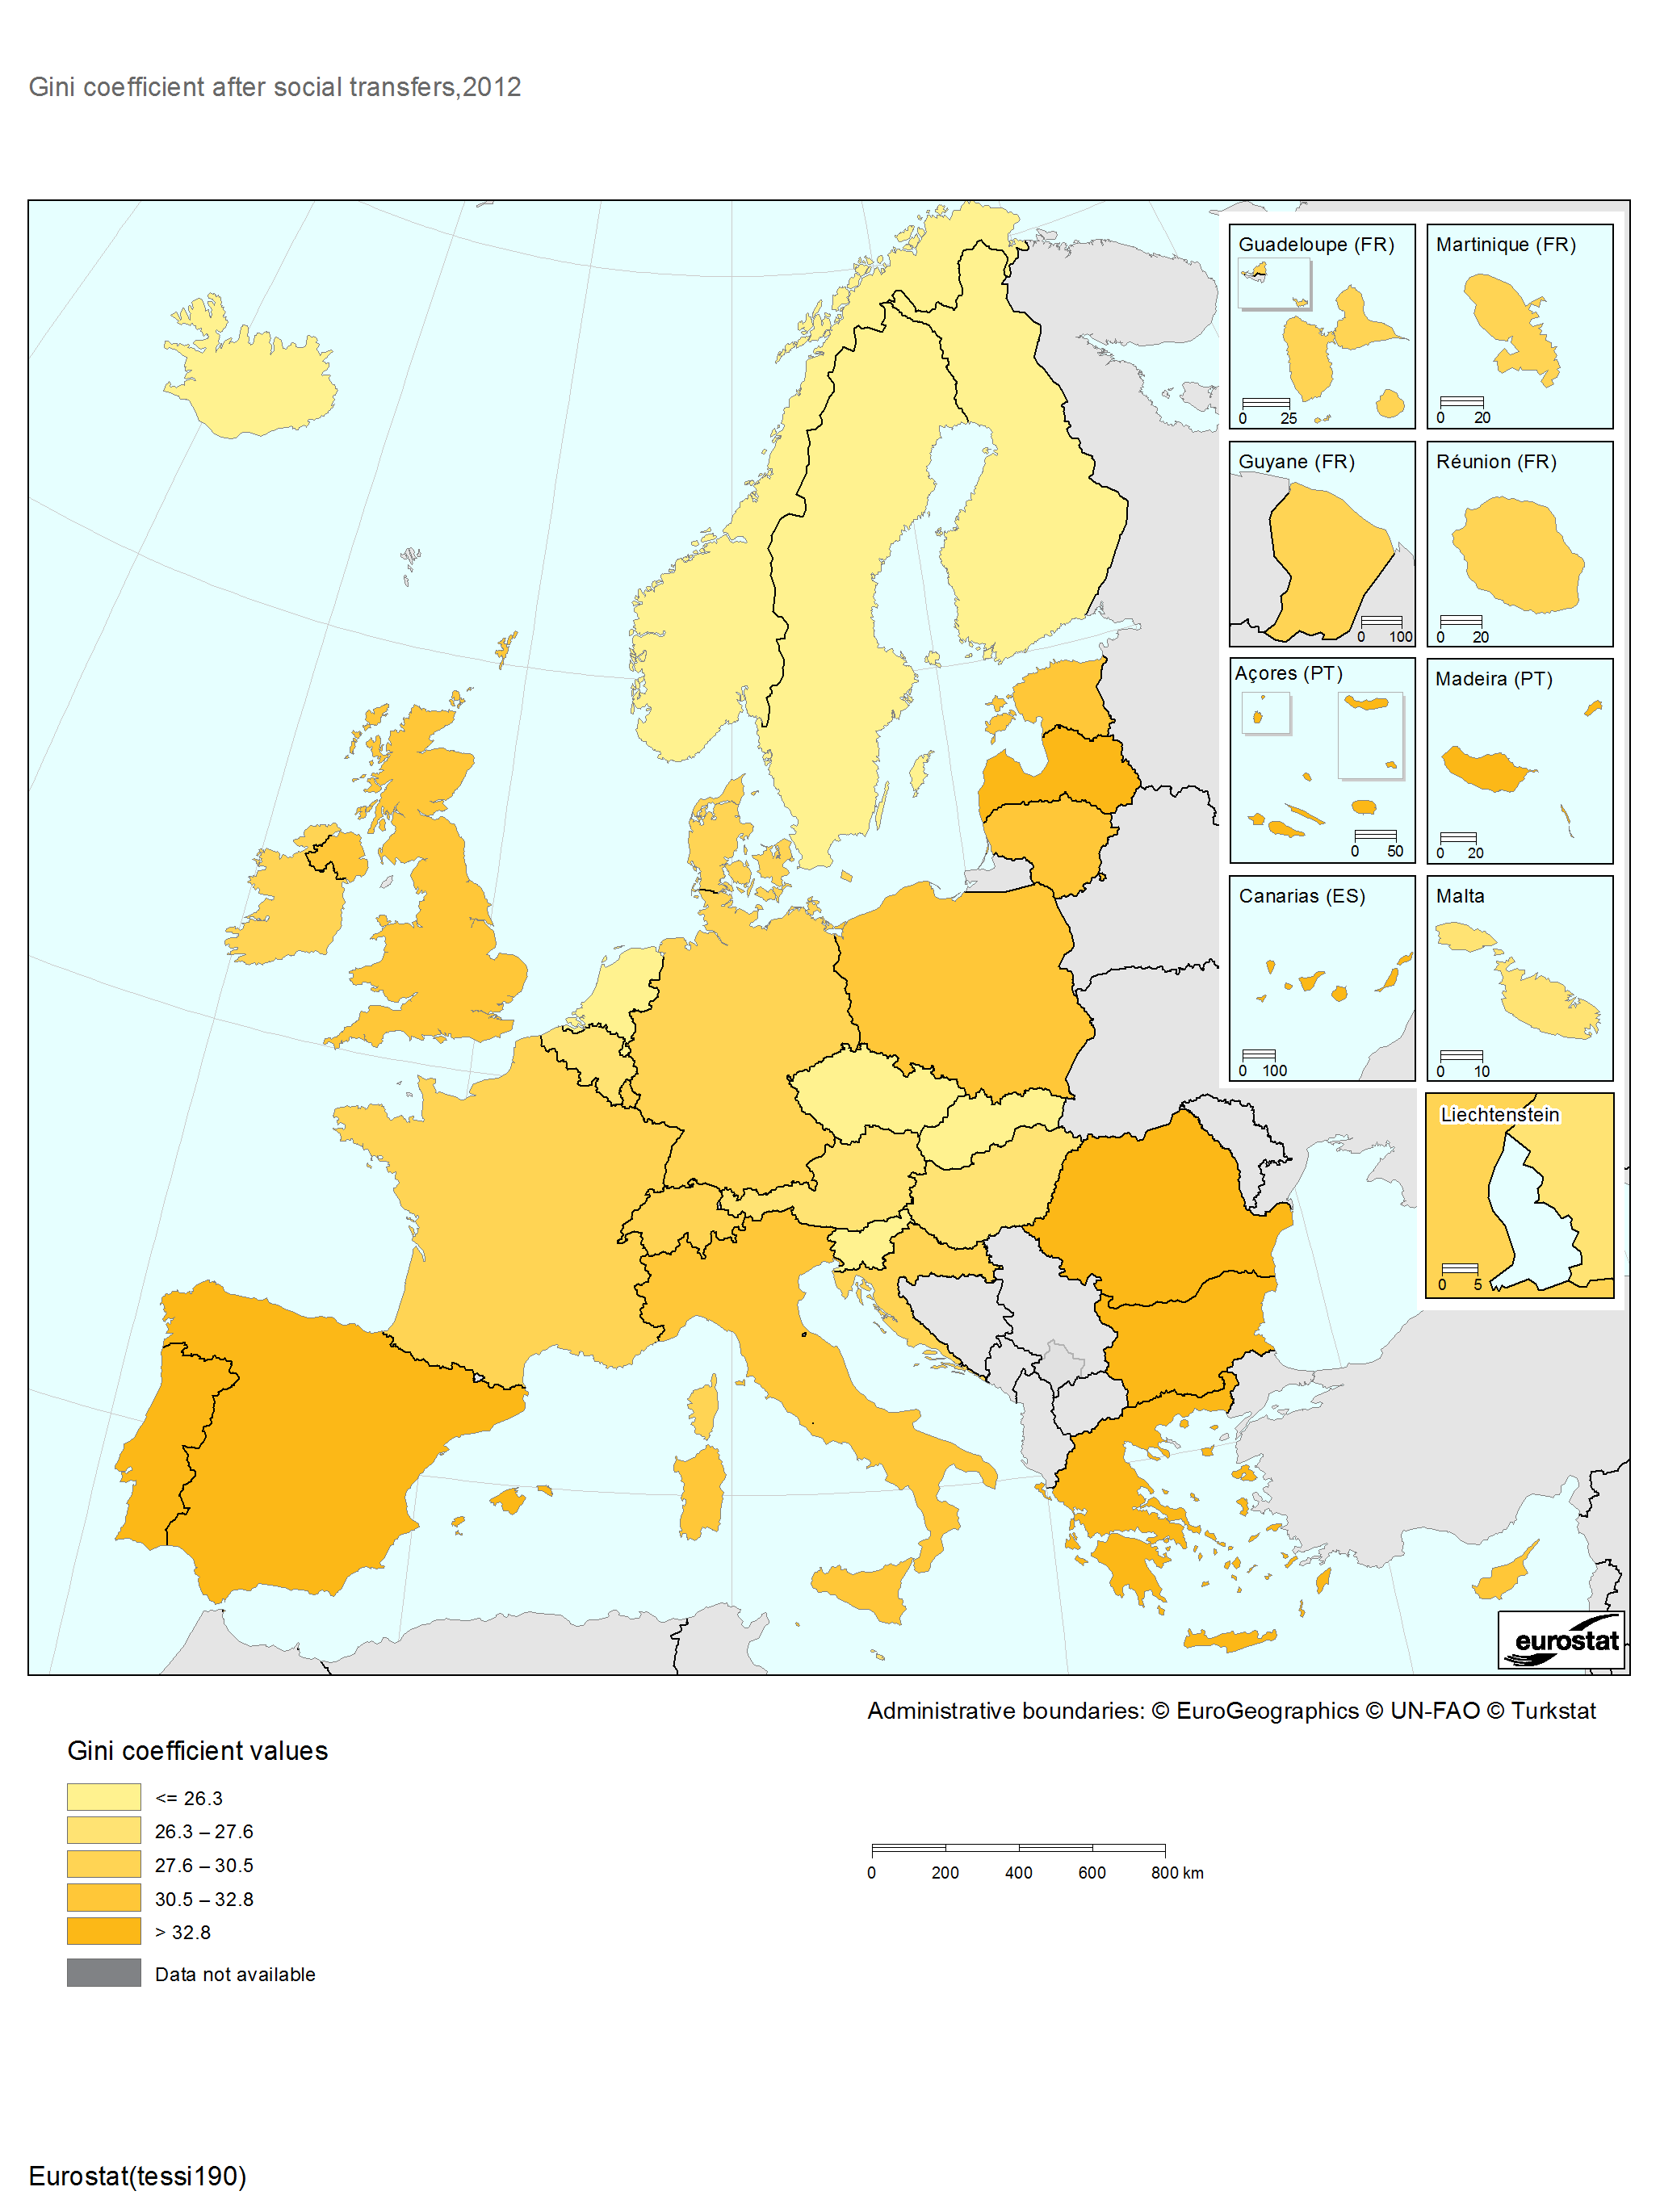
Gini coefficient after social transfers,2012.png
(
file
)
171 KB
1
Special page
ISSN 2443-8219
,_2012.png)
,_2012_New.png)
.png)
2.png)


,_2012_.png)


,_2012.png)
,_2012.png)
.png)

,_2012.png)
.png)

