Tutorials
Log in
Statistics Explained
menu
search
search
Navigation
Main page
Statistical themes
Glossary
Categories
Statistics 4 beginners
Tutorials
Help
Eurostat home
Education corner
Online publications
Regional yearbook
Sustainable development
Full list
Tools
User contributions
Logs
View user groups
Special pages
search
Navigation
Main page
Statistical themes
Glossary
Categories
Statistics 4 beginners
Tutorials
Help
Eurostat home
Education corner
Online publications
Regional yearbook
Sustainable development
Full list
Tools
User contributions
Logs
View user groups
Special pages
Navigation
Main page
Statistical themes
Glossary
Categories
Statistics 4 beginners
Tutorials
Help
Eurostat home
Education corner
Online publications
Regional yearbook
Sustainable development
Full list
Tools
User contributions
Logs
View user groups
Special pages
Uploads by Diamari
This special page shows all uploaded files.
File list
Items per page:
20
50
100
250
500
Search for media name:
Username:
Include old versions of files
Go
Date
Name
Thumbnail
Size
Description
Versions
16:40, 21 April 2015
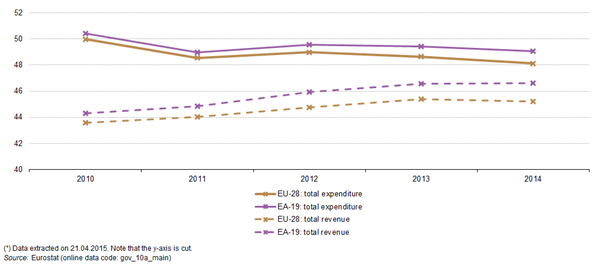
Development of total expenditure and total revenue, 2010-13 (¹) (% of GDP) YB15.png
(
file
)
34 KB
2
16:57, 21 April 2015
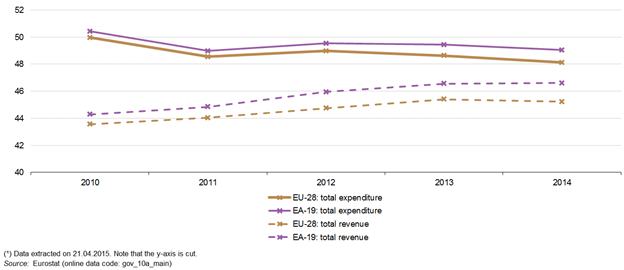
Development of total expenditure and total revenue, 2010-14 (¹) (% of GDP) YB15.png
(
file
)
34 KB
1
16:59, 21 April 2015
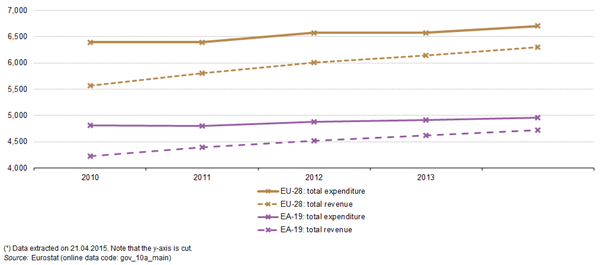
Development of total expenditure and total revenue, 2010-14 (¹) (Billion EUR) YB15.png
(
file
)
35 KB
1
17:32, 21 April 2015
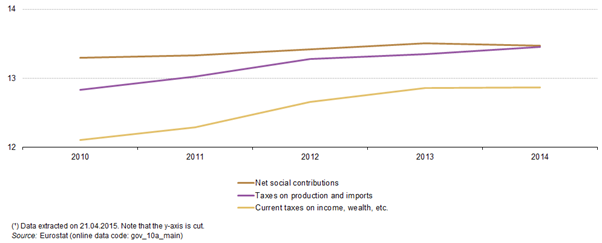
Main categories of taxes and social contributions, EU-28, 2010-14 (¹) (% of GDP) YB15.png
(
file
)
26 KB
1
15:51, 11 December 2015
Development of total expenditure and total revenue, 1995–2014 (¹) (% of GDP) YB15 II.png
(
file
)
17 KB
2
18:25, 24 April 2017
EA-19 and EU-28 quarterly net lending - net borrowing, total expenditure and total revenue as a percentage of GDP, seasonally adjusted data 2016Q4.png
(
file
)
18 KB
1
18:29, 24 April 2017
Quarterly net lending - net borrowing as a percentage of GDP, seasonally adjusted data 2016Q4.png
(
file
)
43 KB
1
18:36, 24 April 2017
Quarterly net lending - net borrowing by country, non-seasonally adjusted data 2016Q4.png
(
file
)
54 KB
1
11:34, 24 October 2017
EA-19 and EU-28 quarterly net lending - net borrowing, total expenditure and total revenue as a percentage of GDP, seasonally adjusted data 2017Q2.png
(
file
)
10 KB
1
11:37, 24 October 2017
Quarterly net lending - net borrowing as a percentage of GDP, seasonally adjusted data 2017Q2.png
(
file
)
48 KB
1
11:38, 24 October 2017
Quarterly net lending - net borrowing by country, non-seasonally adjusted data 2017Q2.png
(
file
)
106 KB
1
11:39, 24 October 2017
EU-28 and EA-19 quarterly net lending, seasonally adjusted data 2017Q2.png
(
file
)
57 KB
1
11:40, 24 October 2017
EA-19 total revenue and total expenditure, seasonally and non-adjusted adjusted data, billion euro 2017Q2.png
(
file
)
193 KB
1
11:41, 24 October 2017
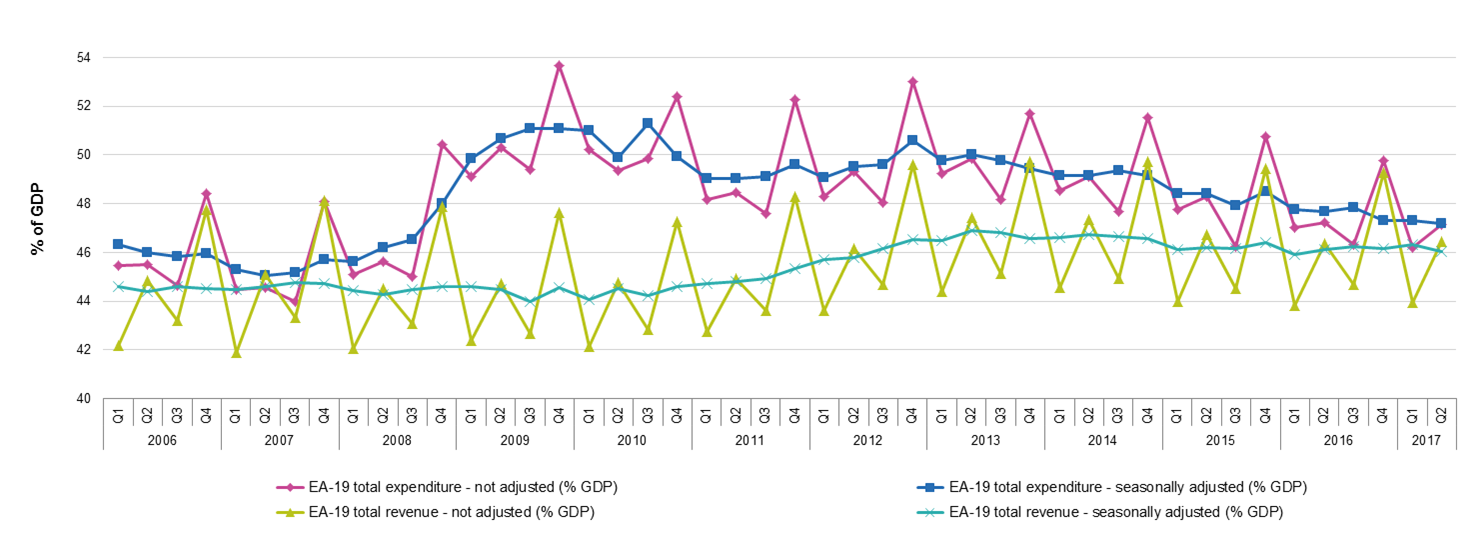
EA-19 total revenue and total expenditure, seasonally and non-adjusted adjusted data, % of GDP 2017Q2.png
(
file
)
203 KB
1
11:42, 24 October 2017
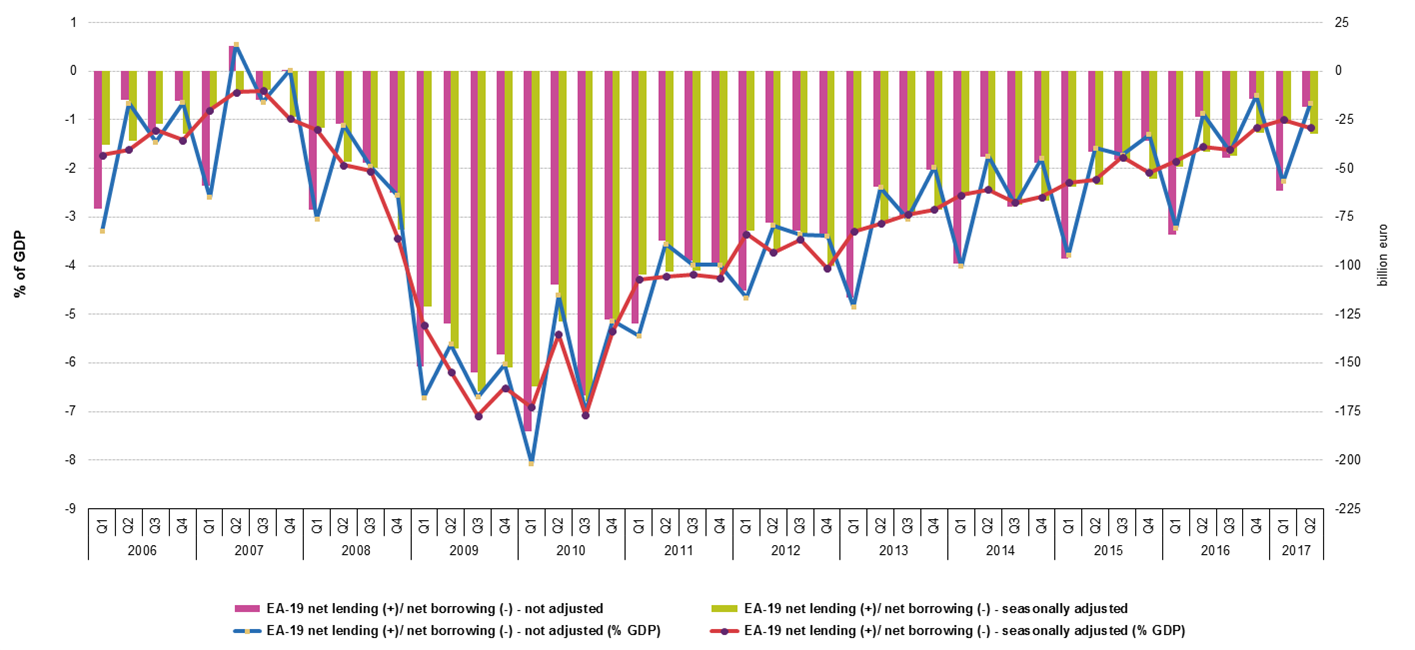
EA-19 net lending (+) net borrowing (-), seasonally and non-adjusted adjusted data, % of GDP and billion euro 2017Q2.png
(
file
)
195 KB
1
11:43, 24 October 2017
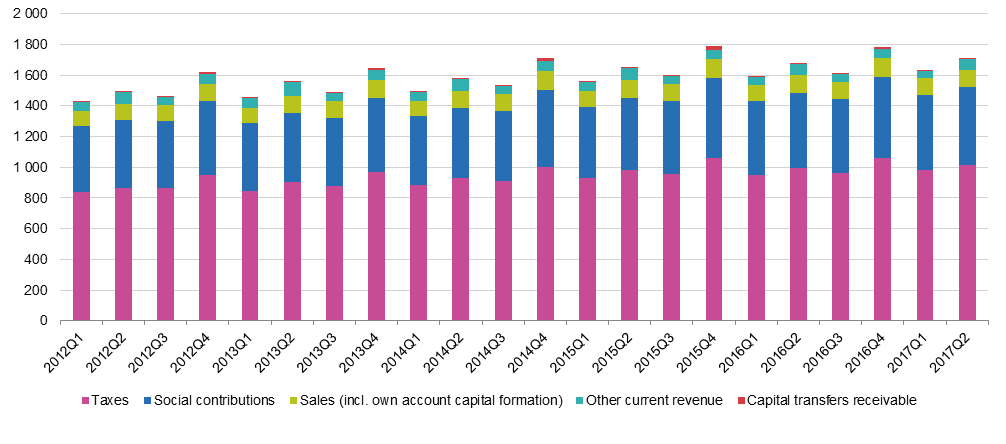
EU-28 components of general government total revenue, billion euro 2017Q2.png
(
file
)
41 KB
1
11:44, 24 October 2017
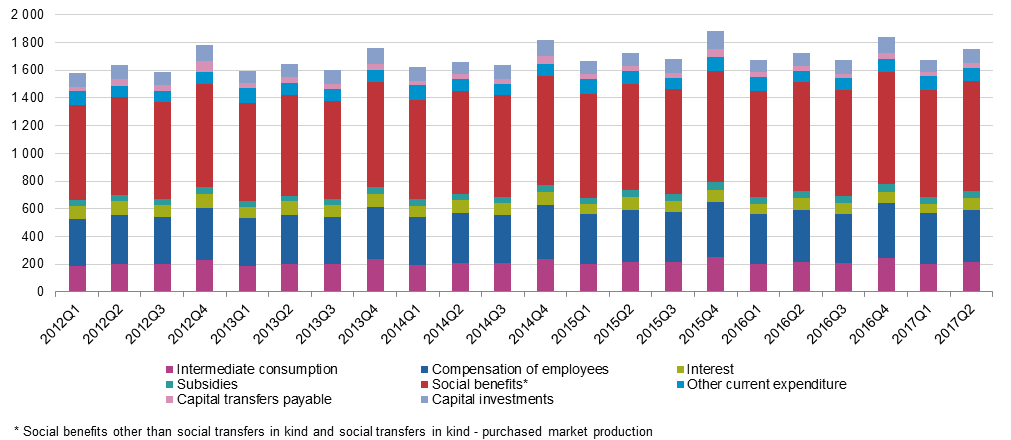
EU-28 components of general government total expenditure, billion euro 2017Q2.png
(
file
)
43 KB
1
11:45, 24 October 2017
EU-28 net financial transactions, transactions in assets and liabilities, billion euro 2017Q2.png
(
file
)
52 KB
1
11:45, 24 October 2017
EA-19 net financial transactions, transactions in assets and liabilities, billion euro 2017Q2.png
(
file
)
55 KB
1
11:46, 24 October 2017
EU-28 net financial worth, stock of assets and liabilities, billion euro and % of GDP 2017Q2.png
(
file
)
48 KB
1
11:47, 24 October 2017
EA-19 net financial worth, stock of assets and liabilities, billion euro and % of GDP 2017Q2.png
(
file
)
159 KB
1
11:48, 24 October 2017
EU-28 stock of assets by financial instrument, % of GDP 2017Q2.png
(
file
)
25 KB
1
11:49, 24 October 2017
EA-19 stock of assets by financial instrument, % of GDP 2017Q2.png
(
file
)
25 KB
1
11:50, 24 October 2017
EU-28 stock of liabilities by financial instrument, % of GDP 2017Q2.png
(
file
)
54 KB
1
11:50, 24 October 2017
EA-19 stock of liabilities by financial instrument, % of GDP 2017Q2.png
(
file
)
23 KB
1
11:51, 24 October 2017
Evolution of net financial worth by country, % of GDP 2017Q2.png
(
file
)
11 KB
1
11:52, 24 October 2017
General government gross debt, % of GDP, 2017Q2.png
(
file
)
19 KB
1
11:53, 24 October 2017
Change in general government gross debt, percentage points of GDP, 2017Q2 compared to 2017Q1.png
(
file
)
14 KB
1
11:53, 24 October 2017
Change in general government gross debt, percentage points of GDP, 2017Q2 compared to 2016Q2.png
(
file
)
9 KB
1
11:54, 24 October 2017
EA-19 evolution of general government deficit and debt, 2017Q2.png
(
file
)
50 KB
1
Special page
ISSN 2443-8219
_(%25_of_GDP)_YB15.png)
_(%25_of_GDP)_YB15.png)
_(Billion_EUR)_YB15.png)
_(%25_of_GDP)_YB15.png)
_(%25_of_GDP)_YB15_II.png)


_net_borrowing_(-),_seasonally_and_non-adjusted_adjusted_data,_%25_of_GDP_and_billion_euro_2017Q2.png)


