Tutorials
Log in
Statistics Explained
menu
search
search
Navigation
Main page
Statistical themes
Glossary
Categories
Statistics 4 beginners
Tutorials
Help
Eurostat home
Education corner
Online publications
Regional yearbook
Sustainable development
Full list
Tools
User contributions
Logs
View user groups
Special pages
search
Navigation
Main page
Statistical themes
Glossary
Categories
Statistics 4 beginners
Tutorials
Help
Eurostat home
Education corner
Online publications
Regional yearbook
Sustainable development
Full list
Tools
User contributions
Logs
View user groups
Special pages
Navigation
Main page
Statistical themes
Glossary
Categories
Statistics 4 beginners
Tutorials
Help
Eurostat home
Education corner
Online publications
Regional yearbook
Sustainable development
Full list
Tools
User contributions
Logs
View user groups
Special pages
Uploads by Debusmc
This special page shows all uploaded files.
File list
Items per page:
20
50
100
250
500
Search for media name:
Username:
Include old versions of files
Go
First page
Previous page
Next page
Last page
Date
Name
Thumbnail
Size
Description
Versions
09:52, 8 June 2009
Households’ stock of financial assets as a percentage of GDP, 2000-2007.PNG
(
file
)
18 KB
1
10:27, 8 June 2009
Households’ stock of financial assets as a percentage of GDP, 2000–2007 (table).PNG
(
file
)
78 KB
1
10:46, 8 June 2009
Households’ stock of financial assets by instrument (% of total financial assets), 2000 and 2007.PNG
(
file
)
96 KB
1
10:50, 8 June 2009
Households’ stock of financial assets by instrument (% of total financial assets) in 2007.PNG
(
file
)
15 KB
1
11:05, 8 June 2009
Households’ stock of liabilities as a percentage of Household Disposable Income, 2000 and 2007.PNG
(
file
)
12 KB
1
11:11, 8 June 2009
Households’ stock of financial liabilities by instrument (% of total financial assets), 2000 and 2007 (table).PNG
(
file
)
87 KB
1
11:14, 8 June 2009
Households’ stock of liabilities by instrument (% of total financial liabilities) in 2007.PNG
(
file
)
12 KB
1
11:30, 8 June 2009
Net Financial Wealth of Households as a percentage of GDP, 2000 and 2007.PNG
(
file
)
16 KB
1
16:07, 18 June 2009
Projected 1st January population for selected years, EU27 - 2008=100.PNG
(
file
)
12 KB
1
16:14, 18 June 2009
Projected age dependency ratios for selected years, EU27, 2008-2060.PNG
(
file
)
15 KB
1
16:19, 18 June 2009
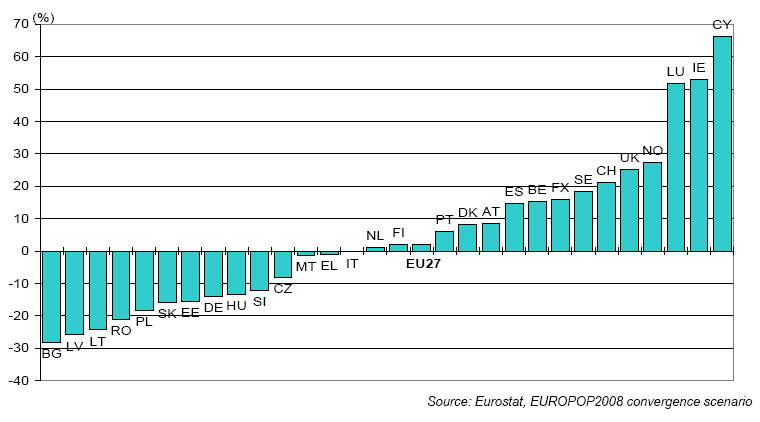
Projected total population change over the projection period 2008-2060 (2008=100) for the EU Member States, Norway and Switzerland.PNG
(
file
)
15 KB
1
16:23, 18 June 2009
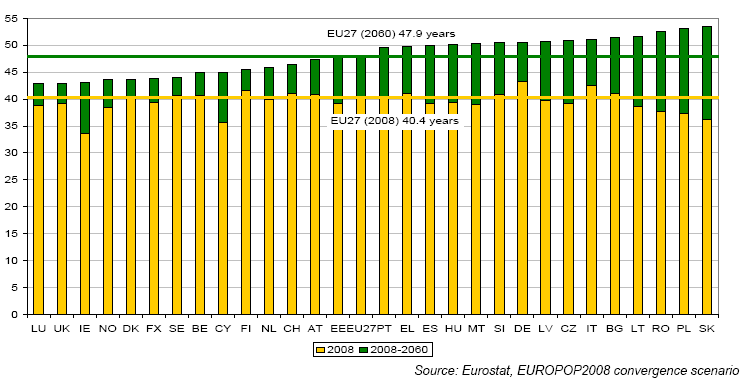
Median age of the total population for the EU Member States, Norway and Switzerland - 2008, 2060.PNG
(
file
)
17 KB
1
16:27, 18 June 2009
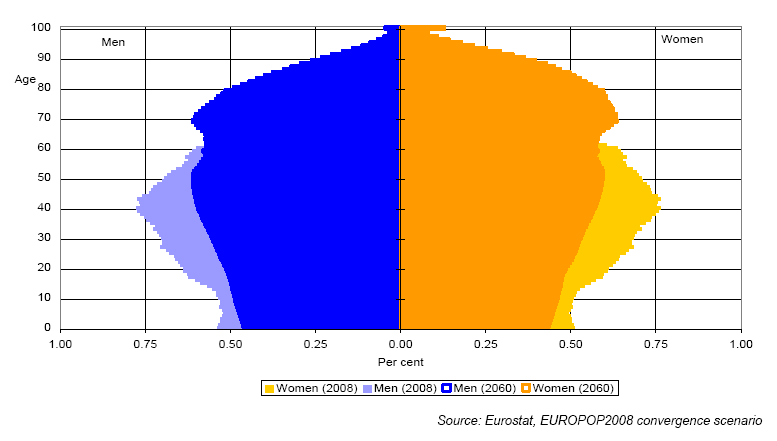
Population pyramids, EU27, 2008, 2060.PNG
(
file
)
19 KB
1
16:31, 18 June 2009
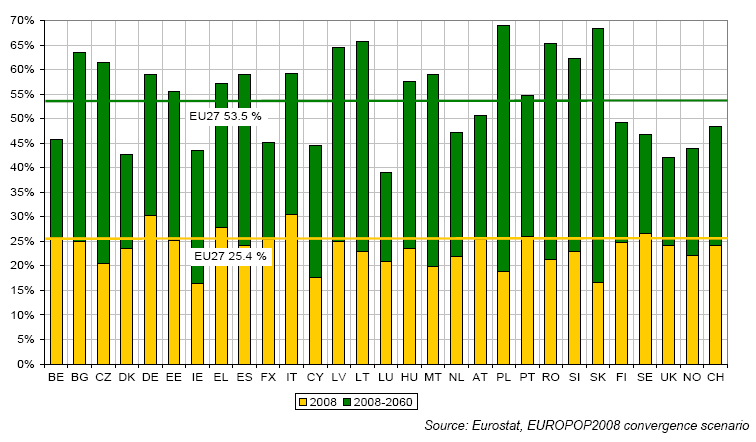
Old age dependency ratio for the EU Member States, Norway and Switzerland - 2008, 2060.PNG
(
file
)
26 KB
1
16:35, 18 June 2009
Vital events for selected years – EU27, 2008 - 2060.PNG
(
file
)
12 KB
1
16:40, 18 June 2009
Natural change and net migration for selected years – EU27, 2008 - 2060.PNG
(
file
)
13 KB
1
16:45, 18 June 2009
Demographic balance 1 January 2008 – 1 January 2060.PNG
(
file
)
56 KB
1
16:48, 18 June 2009
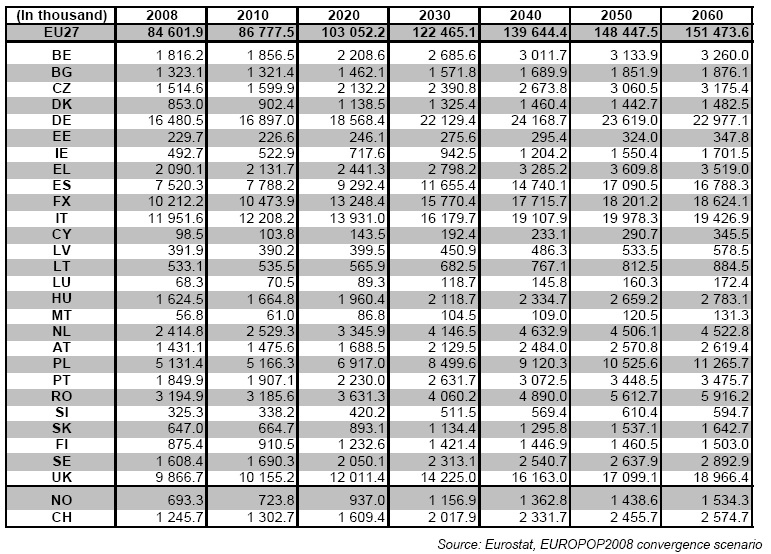
Total population on 1st January for selected years, 2008 - 2060.PNG
(
file
)
67 KB
1
16:52, 18 June 2009
Population aged between 0 and 14 years old for selected years, 2008 - 2060.PNG
(
file
)
61 KB
1
16:56, 18 June 2009
Population aged between 15 and 64 years old for selected years, 2008 - 2060.PNG
(
file
)
66 KB
1
16:59, 18 June 2009
Population aged between 65 years old or over for selected years, 2008 - 2060.PNG
(
file
)
65 KB
1
17:02, 18 June 2009
Population aged between 80 years old or over for selected years, 2008 - 2060.PNG
(
file
)
64 KB
1
17:05, 18 June 2009
Young age dependency ratio for selected years, 2008 - 2060.PNG
(
file
)
58 KB
1
17:09, 18 June 2009
Old age dependency ratio for selected years, 2008 - 2060.PNG
(
file
)
58 KB
1
17:12, 18 June 2009
Total age dependency ratio, for selected years, 2008 - 2060.PNG
(
file
)
58 KB
1
17:31, 18 June 2009
Share of the total population aged 65 years or over, for selected years, 2008 - 2060.PNG
(
file
)
56 KB
1
17:34, 18 June 2009
Share of the total population aged 80 years or over, for selected years, 2008 - 2060.PNG
(
file
)
50 KB
1
17:40, 18 June 2009
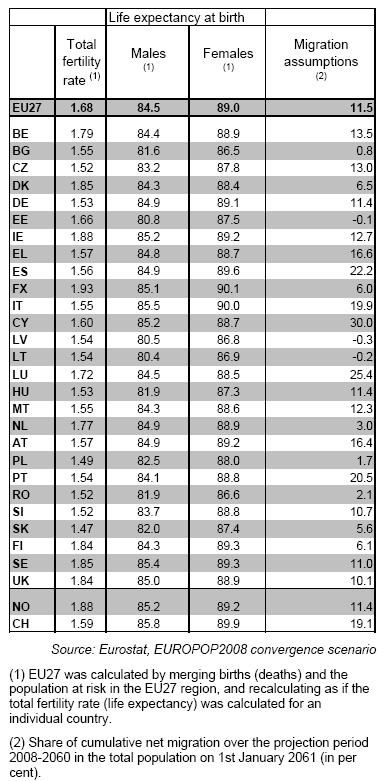
Assumptions for the EUROPOP2008 convergence scenario, convergence year 2150 for the target year 2060.PNG
(
file
)
46 KB
1
10:14, 13 August 2009
Total population 2004 bis.PNG
(
file
)
9 KB
1
10:19, 13 August 2009
Population change 1999-2004 bis.PNG
(
file
)
17 KB
1
10:23, 13 August 2009
Population age groups 2004 bis.PNG
(
file
)
10 KB
1
10:27, 13 August 2009
Unemployment rate 2004 bis.PNG
(
file
)
13 KB
1
10:29, 13 August 2009
Structural employment indicators bis.PNG
(
file
)
14 KB
1
10:33, 13 August 2009
Burglary 2004 bis.PNG
(
file
)
9 KB
1
10:35, 13 August 2009
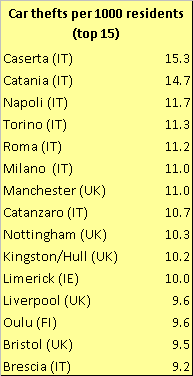
Car thefts 2004 bis.PNG
(
file
)
6 KB
1
10:38, 13 August 2009
Rainfall in 2004.PNG
(
file
)
17 KB
1
10:40, 13 August 2009
Cinemas bis.PNG
(
file
)
13 KB
1
10:09, 17 August 2009
Urban population age groups 2004.PNG
(
file
)
10 KB
1
10:11, 17 August 2009
Urban population change 1999-2004 bis.PNG
(
file
)
17 KB
1
10:14, 17 August 2009
Urban unemployment 2004.PNG
(
file
)
13 KB
1
10:18, 17 August 2009
Urban structural employment indicators 2004.PNG
(
file
)
14 KB
1
10:20, 17 August 2009
Urban burglary 2004.PNG
(
file
)
9 KB
1
10:21, 17 August 2009
Urban car theft 2004.PNG
(
file
)
6 KB
1
10:23, 17 August 2009
Urban rainfall in 2004.PNG
(
file
)
16 KB
1
10:25, 17 August 2009
Urban cinemas 2004.PNG
(
file
)
13 KB
1
16:40, 20 August 2009
Top 30 NUTS 2 regions with highest number of air passengers in 2006.PNG
(
file
)
70 KB
1
15:17, 24 August 2009
Structural profile of forest-based industries (NACE DD20, DE21 and DE22.2) and furniture manufacturing (NACE DN36.1), EU-27, 2005.PNG
(
file
)
16 KB
1
16:48, 2 September 2009
Infant mortality (per 1 000 live births), 1965-2007.PNG
(
file
)
75 KB
1
17:00, 2 September 2009
PhD students (ISCED level 6), 2006 (% of total PhD students).PNG
(
file
)
82 KB
2
17:05, 2 September 2009
Gross value added at basic prices, 1997 and 2007 (% share of total gross value added).PNG
(
file
)
99 KB
1
First page
Previous page
Next page
Last page
Special page
ISSN 2443-8219

.PNG)
,_2000_and_2007.PNG)
_in_2007.PNG)

,_2000_and_2007_(table).PNG)
_in_2007.PNG)


_for_the_EU_Member_States,_Norway_and_Switzerland.PNG)


_and_furniture_manufacturing_(NACE_DN36.1),_EU-27,_2005.PNG)
,_1965-2007.PNG)
,_2006_(%25_of_total_PhD_students).PNG)
.PNG)