Tutorials
Log in
Statistics Explained
menu
search
search
Navigation
Main page
Statistical themes
Glossary
Categories
Statistics 4 beginners
Tutorials
Help
Eurostat home
Education corner
Online publications
Regional yearbook
Sustainable development
Full list
Tools
User contributions
Logs
View user groups
Special pages
search
Navigation
Main page
Statistical themes
Glossary
Categories
Statistics 4 beginners
Tutorials
Help
Eurostat home
Education corner
Online publications
Regional yearbook
Sustainable development
Full list
Tools
User contributions
Logs
View user groups
Special pages
Navigation
Main page
Statistical themes
Glossary
Categories
Statistics 4 beginners
Tutorials
Help
Eurostat home
Education corner
Online publications
Regional yearbook
Sustainable development
Full list
Tools
User contributions
Logs
View user groups
Special pages
Uploads by Clifflo
This special page shows all uploaded files.
File list
Items per page:
20
50
100
250
500
Search for media name:
Username:
Include old versions of files
Go
First page
Previous page
Next page
Last page
Date
Name
Thumbnail
Size
Description
Versions
15:06, 8 June 2022
Standardised death rates for treatable diseases conditions, persons aged less than 75 years, 2019 (per 100 000 inhabitants) Health20.png
(
file
)
82 KB
1
16:52, 8 June 2022
Standardised death rates for treatable diseases conditions, persons aged less than 75 years, by sex, 2019 (per 100 000 inhabitants) Health20.png
(
file
)
97 KB
1
16:57, 8 June 2022
Standardised death rates for preventable diseases conditions, persons aged less than 75 years, by sex, 2019 (per 100 000 inhabitants) Health20.png
(
file
)
97 KB
1
17:38, 8 June 2022
Number of avoidable deaths, persons aged less than 75 years, EU, 2017 (number) B Health20.png
(
file
)
652 KB
1
18:02, 8 June 2022
Standardised death rates for treatable diseases conditions, persons aged less than 75 years, EU, 2017 (per 100 000 inhabitants) Health20.png
(
file
)
64 KB
1
12:05, 9 June 2022
Standardised death rates for preventable diseases conditions, persons aged less than 75 years, EU, 2017 (per 100 000 inhabitants) Health20.png
(
file
)
67 KB
1
12:52, 9 June 2022
Standardised death rates for preventable diseases conditions, EU, 2017 (per 100 000 male female inhabitants) Health20.png
(
file
)
78 KB
1
14:16, 9 June 2022
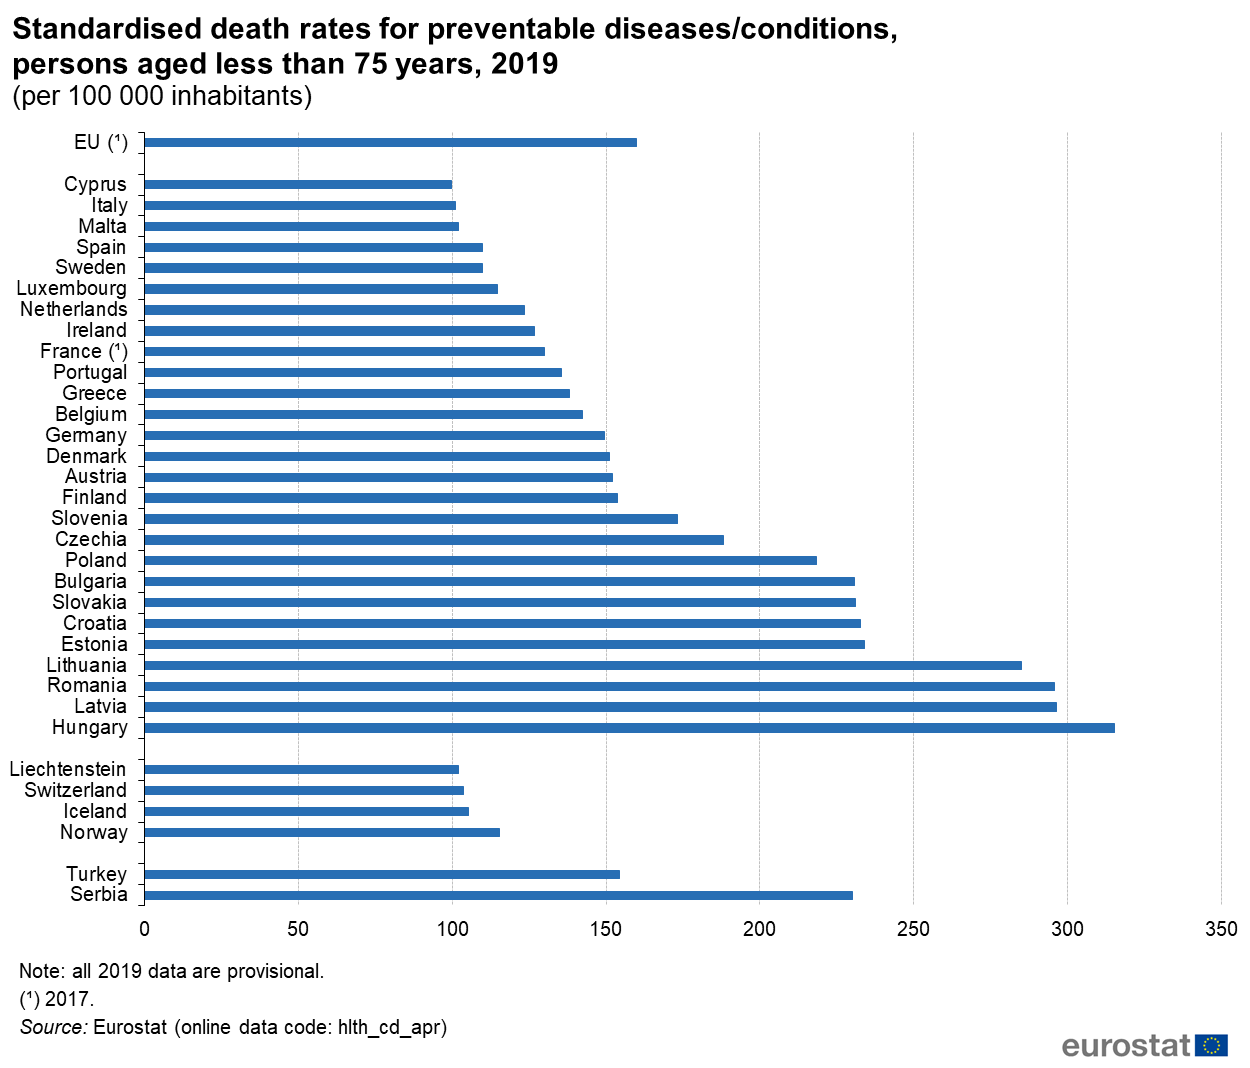
Standardised death rates for preventable diseases conditions, 2019 (per 100 000 inhabitants) Health20.png
(
file
)
120 KB
1
15:12, 9 June 2022
Preventable and treatable mortality statistics 09-06-2022.xlsx
(
file
)
15 KB
1
17:25, 10 June 2022
Standardised death rates for the top 5 treatable diseases conditions, persons aged less than 75 years, 2019 (per 100 000 inhabitants).png
(
file
)
108 KB
1
15:26, 14 June 2022
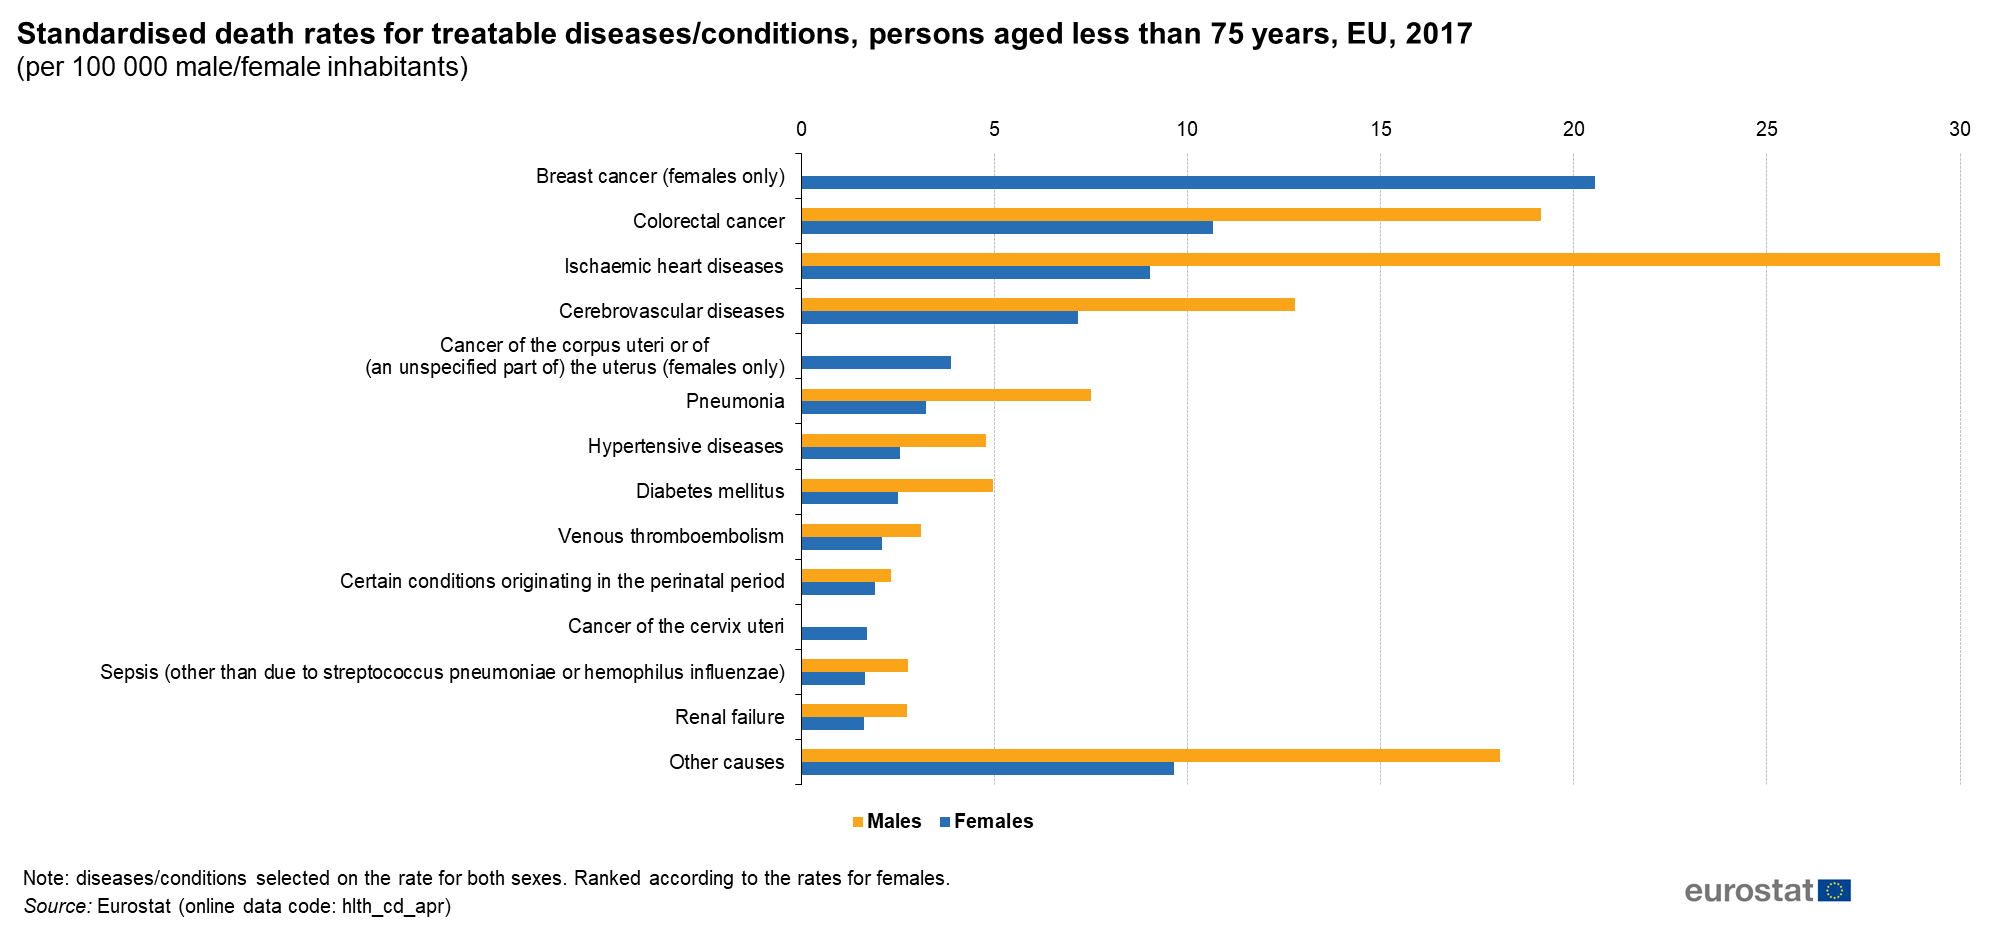
Standardised death rates for treatable diseases conditions, EU, 2017 (per 100 000 male female inhabitants) Health20.png
(
file
)
94 KB
Reverted to version as of 12:46, 9 June 2022 (CEST)
3
16:14, 14 June 2022
Standardised death rates for treatable diseases conditions, 2019 (per 100 000 inhabitants) Health20.png
(
file
)
82 KB
3
16:17, 14 June 2022
Standardised death rates for preventable diseases conditions, persons aged less than 75 years, 2019 (per 100 000 inhabitants) Health20.png
(
file
)
86 KB
3
16:28, 14 June 2022
Number of avoidable deaths, persons aged less than 75 years, EU, 2017 (number) A Health20.png
(
file
)
694 KB
2
16:39, 14 June 2022
Preventable and treatable mortality statistics Health2022.xlsx
(
file
)
145 KB
3
16:14, 5 July 2022
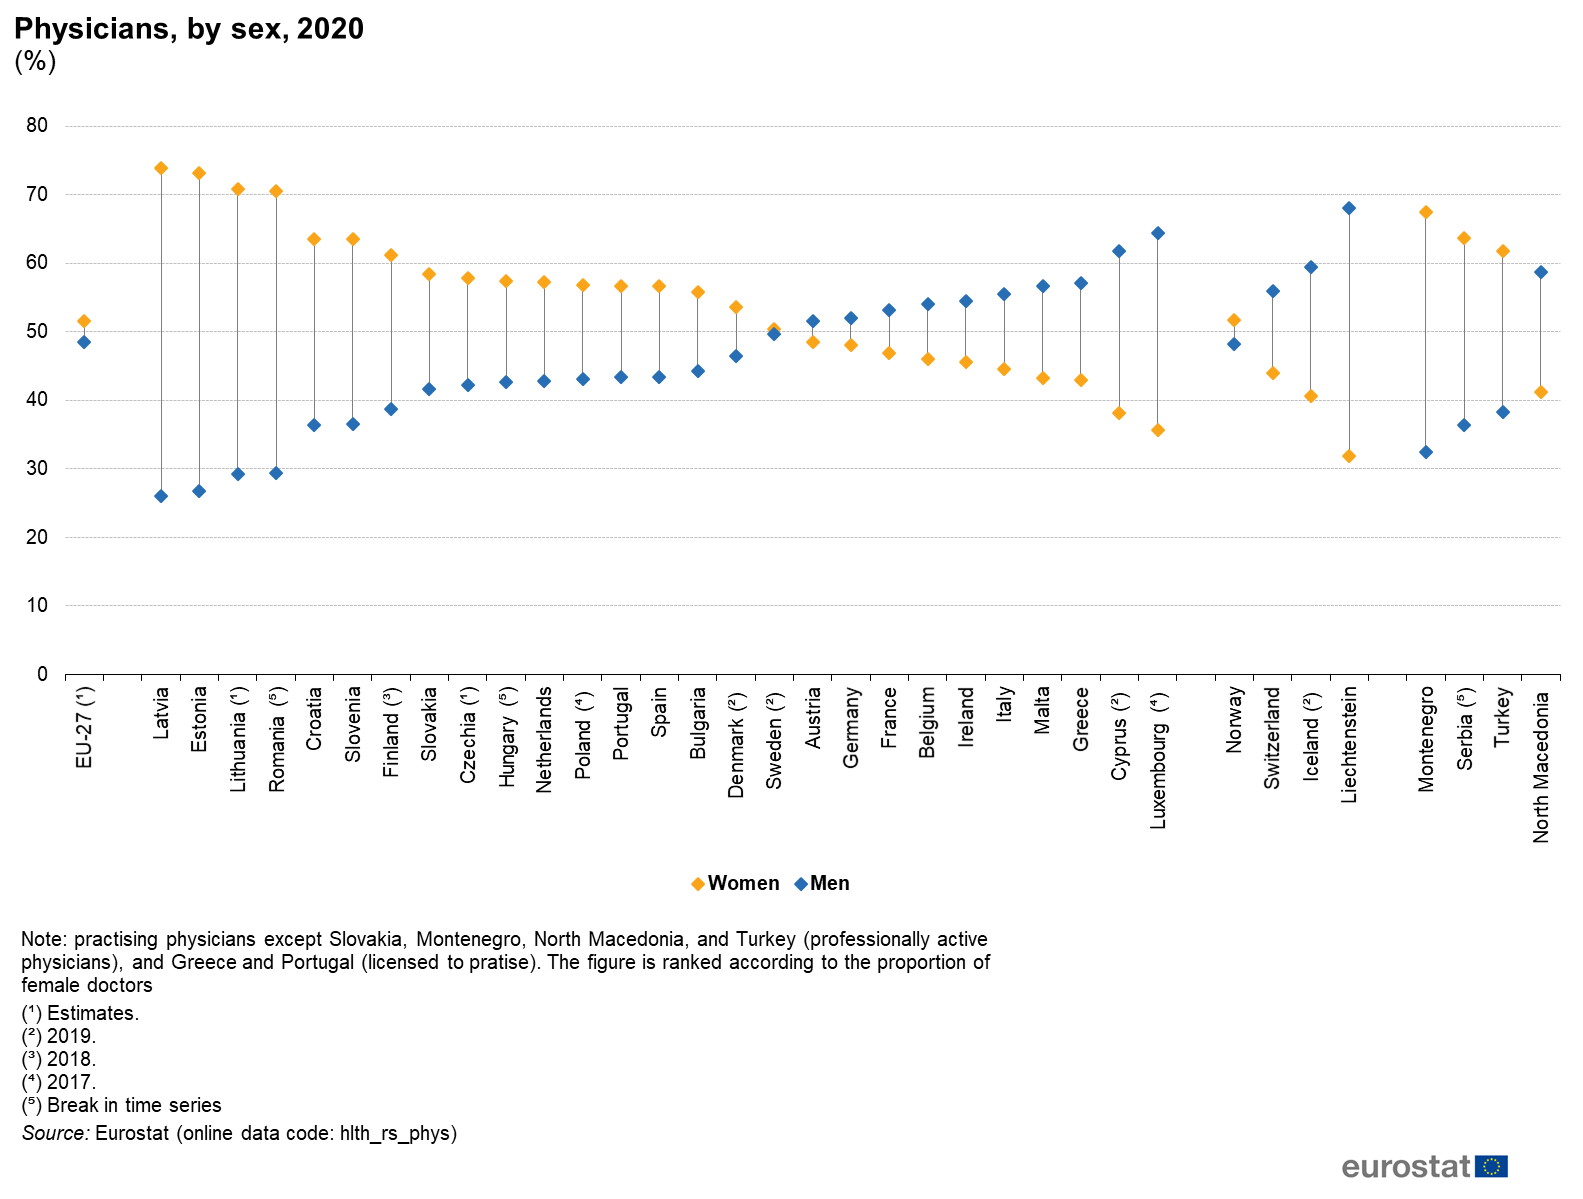
Physicians, by sex, 2020 (%) Health20.png
(
file
)
117 KB
1
17:02, 7 July 2022
Practising physicians, 2015 and 2020 (per 100 000 inhabitants) Health20.png
(
file
)
124 KB
2
17:27, 7 July 2022
Graduates — medical doctors, 2010 and 2020 (per 100 000 inhabitants) Health20.png
(
file
)
123 KB
2
14:22, 8 July 2022
Physicians, by speciality, 2020 Health20.png
(
file
)
970 KB
3
15:56, 8 July 2022
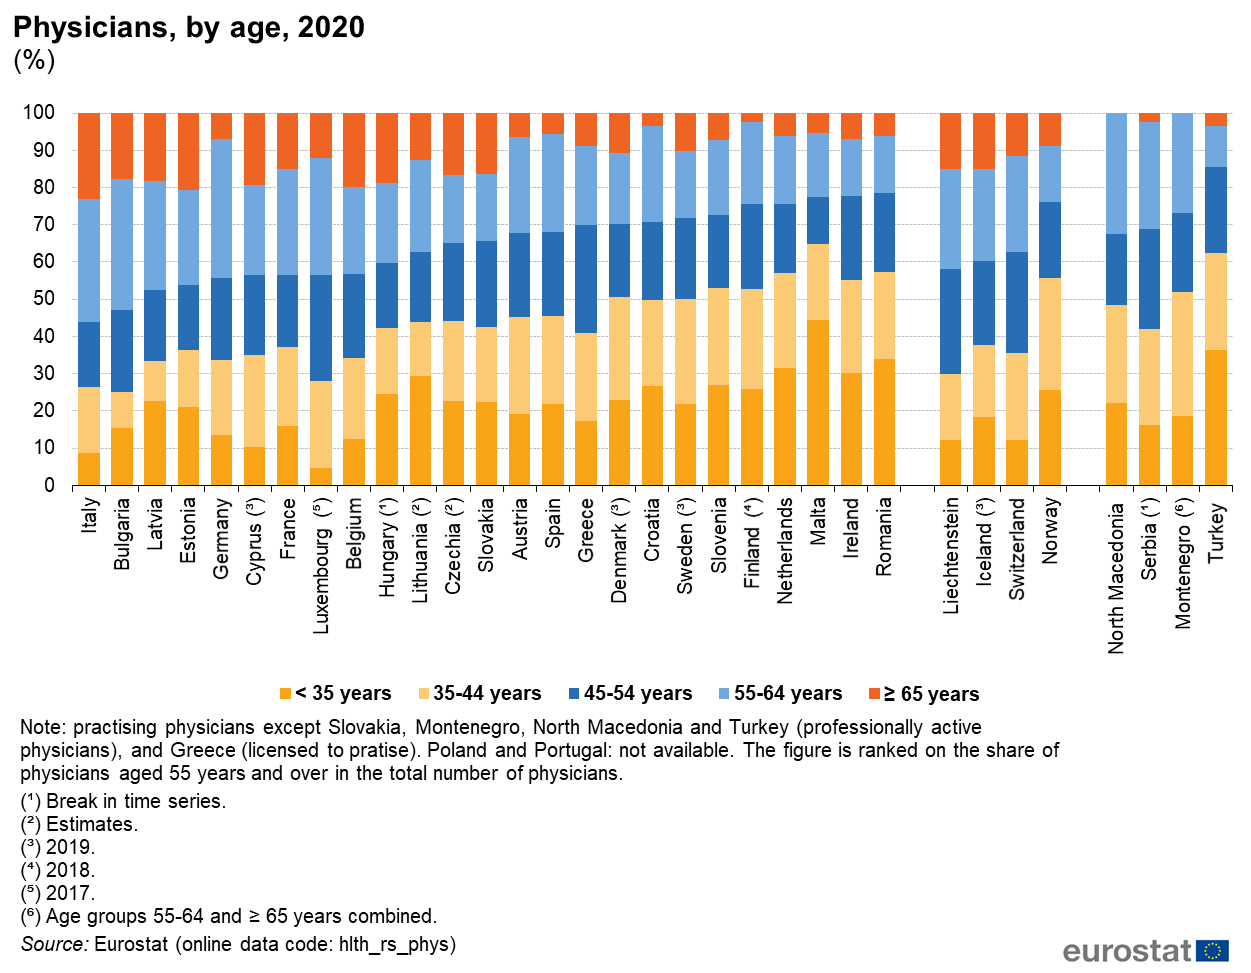
Physicians, by age, 2020 (%) Health20.png
(
file
)
165 KB
3
16:02, 8 July 2022
Healthcare personnel statistics - physicians Health2022.xlsx
(
file
)
68 KB
2
11:41, 13 September 2022
Healthcare personnel statistics - nursing and caring professionals-interactive Health2022.xlsx
(
file
)
12 KB
4
09:45, 21 October 2022
Causes of death – diseases of the respiratory system, residents, 2019 Health2022.png
(
file
)
566 KB
2
09:47, 21 October 2022
Standardised death rates – diseases of the respiratory system, residents, 2019 (per 100 000 male female inhabitants) Health2022.png
(
file
)
587 KB
2
09:48, 21 October 2022
Share of the population reporting that they had chronic lower respiratory diseases (excluding asthma), 2019 (%) Health2022.png
(
file
)
110 KB
2
09:50, 21 October 2022
Share of the population reporting they suffered from asthma, 2019 (%) Health2022.png
(
file
)
111 KB
2
09:57, 21 October 2022
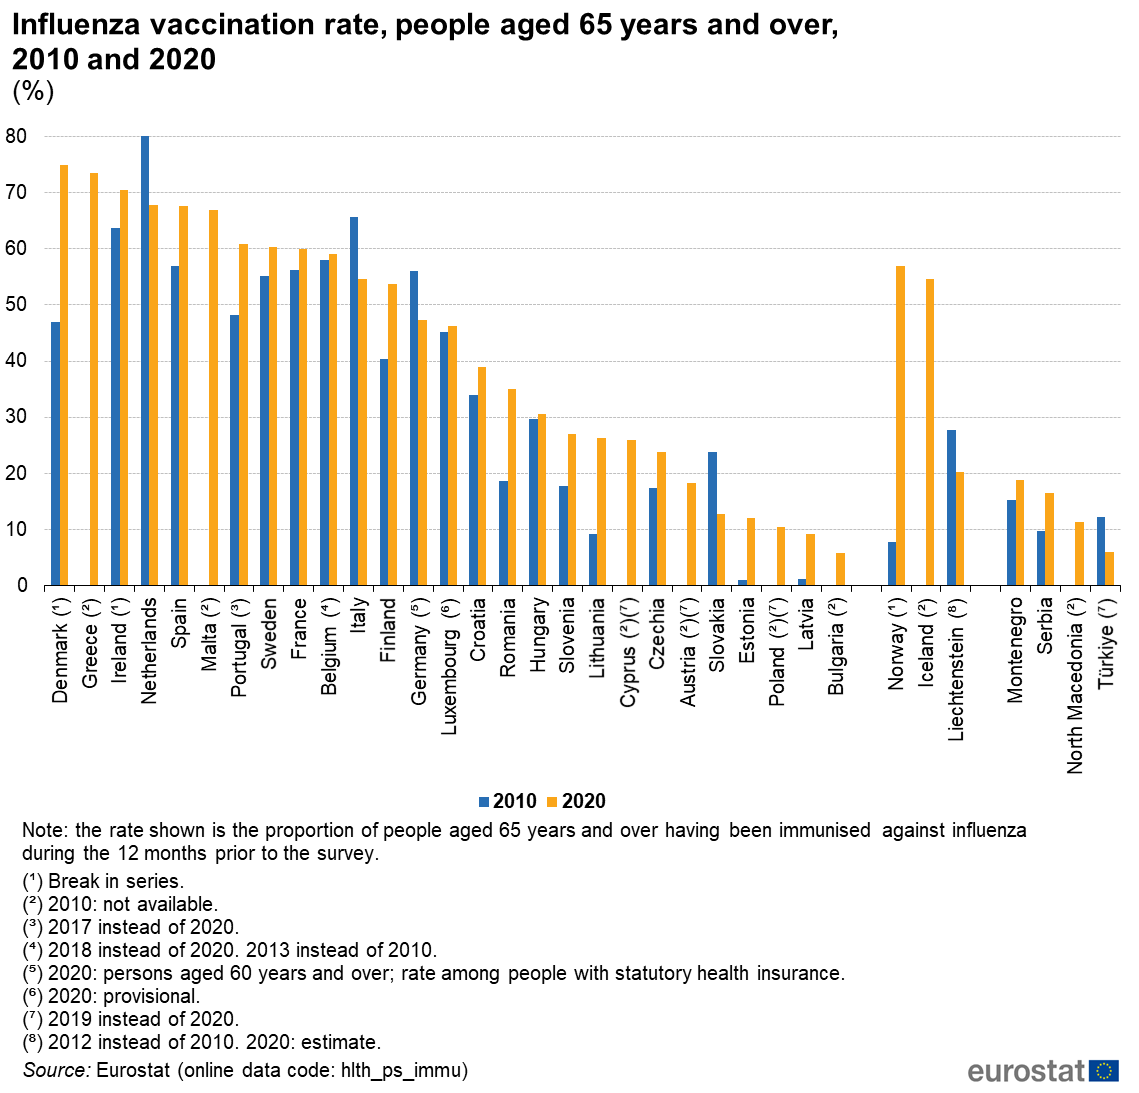
Influenza vaccination rate, people aged 65 years and over, 2010 and 2020 (%) Health2022.png
(
file
)
141 KB
3
09:57, 21 October 2022
Hospital discharge rates for in-patients with diseases of the respiratory system, 2019 (per 100 000 inhabitants) Health2022.png
(
file
)
103 KB
2
09:58, 21 October 2022
In-patient average length of stay for respiratory diseases, 2014 and 2019 (days) Health2022.png
(
file
)
539 KB
2
10:10, 21 October 2022
Respiratory diseases-interactive Health2022.xlsx
(
file
)
13 KB
2
10:38, 24 October 2022
Breast cancer screening, women aged 50 to 69 years, 2010 and 2020 (%) Health2022.png
(
file
)
179 KB
3
10:45, 24 October 2022
Self-reported screening – proportion of women aged 50 to 69 years having had an X-ray breast examination within the specified time periods, 2019 (%) Health2022.png
(
file
)
144 KB
2
12:47, 24 October 2022
Self-reported screening – proportion of women aged 50 to 69 years having had an X-ray breast examination within the two years prior to the survey, by educational attainment level, 2019 (%) Health2022.png
(
file
)
121 KB
2
12:55, 24 October 2022
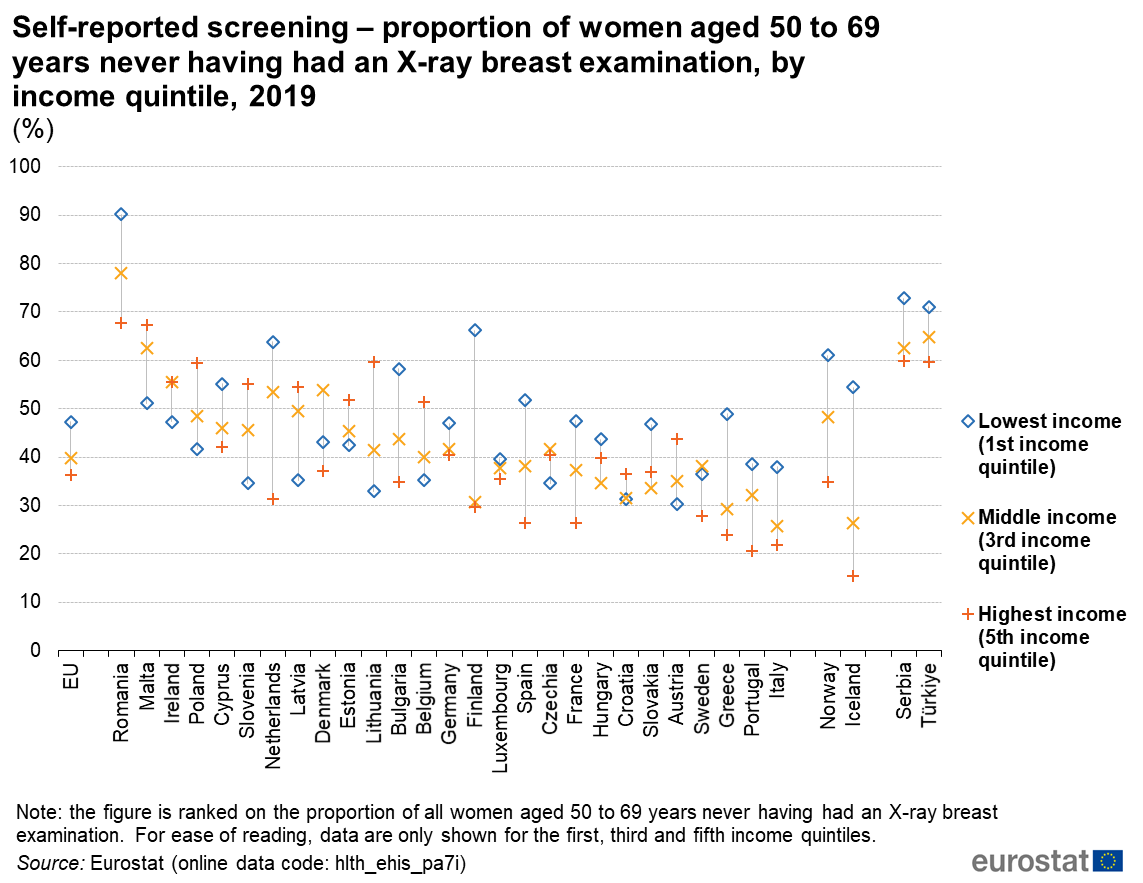
Self-reported screening – proportion of women aged 50 to 69 years never having had an X-ray breast examination, by income quintile, 2019 (%) Health2022.png
(
file
)
115 KB
2
12:59, 24 October 2022
Cervical cancer screening rate, women aged 20 to 69 years, 2020 (%) Health2022.png
(
file
)
198 KB
2
13:05, 24 October 2022
Self-reported screening – proportion of women aged 20 to 69 years having had a cervical smear test within the specified time periods, 2019 (%) Health2022.png
(
file
)
167 KB
2
13:08, 24 October 2022
Self-reported screening – proportion of women aged 20 to 69 years having had a cervical smear test within the three years prior to the survey, by educational attainment level, 2019 (%) Health2022.png
(
file
)
118 KB
2
13:49, 24 October 2022
Self-reported screening – proportion of people aged 50 to 74 years having had a colorectal cancer screening test within the specified time periods, 2019 (%) Health2022.png
(
file
)
146 KB
2
14:12, 24 October 2022
Self-reported screening – proportion of people aged 50 to 74 years never having had a colorectal cancer screening test, by educational attainment level, 2019 (%) Health2022.png
(
file
)
119 KB
2
14:24, 24 October 2022
Self-reported vaccination – proportion of people aged 65 years and over having been immunised against influenza during the 12 months prior to the survey, by educational attainment level, 2019 (%) Health2022.png
(
file
)
120 KB
2
14:26, 24 October 2022
Self-reported screening – proportion of people aged 15 years and over according to the last measurement of blood cholesterol, 2019 (%) Health2022.png
(
file
)
146 KB
2
14:30, 24 October 2022
Self-reported screening – proportion of people aged 15 years and over having had a blood cholesterol measurement within the year prior to the survey, by age, 2019 (%) Health2022.png
(
file
)
390 KB
2
14:35, 24 October 2022
Self-reported screening – proportion of people aged 15 years and over having had a blood sugar measurement within the specified time periods, 2019 (%) Health2022.png
(
file
)
143 KB
2
14:38, 24 October 2022
Self-reported screening – proportion of people aged 15 years and over having had a blood sugar measurement within the year prior to the survey, by sex, 2019 (%) Health2022.png
(
file
)
132 KB
2
14:41, 24 October 2022
Healthcare activities statistics - preventive services-interactive Health2022.xlsx
(
file
)
12 KB
2
12:28, 4 November 2022
Causes of death – accidents (including the sequelae of transport and other accidents), residents, 2019 Health2022.png
(
file
)
520 KB
2
12:45, 4 November 2022
Standardised death rates – accidents and assault, 2019 (per 100 000 male female inhabitants) Health2022.png
(
file
)
570 KB
2
13:08, 4 November 2022
Share of the population aged 15 years and over reporting that they had an accident within the previous 12 months resulting in injury either at home or during a leisure pursuit, 2019 (%) Health2022.png
(
file
)
124 KB
2
13:23, 4 November 2022
Share of the population aged 15 years and over reporting that they had a road traffic accident within the previous 12 months resulting in injury, 2019 (%) Health2022.png
(
file
)
123 KB
2
13:28, 4 November 2022
Hospital discharge rates for in-patients with injuries, poisoning and certain other consequences of external causes, 2019 (per 100 000 inhabitants) Health2022.png
(
file
)
113 KB
2
First page
Previous page
Next page
Last page
Special page
ISSN 2443-8219
_Health20.png)
_Health20.png)
_Health20.png)
_B_Health20.png)
_Health20.png)
_Health20.png)
_Health20.png)
_Health20.png)
.png)
_Health20.png)
_Health20.png)
_Health20.png)
_A_Health20.png)
_Health20.png)
_Health20.png)
_Health20.png)

_Health20.png)

_Health2022.png)
,_2019_(%25)_Health2022.png)
_Health2022.png)
_Health2022.png)
_Health2022.png)
_Health2022.png)
_Health2022.png)
_Health2022.png)
_Health2022.png)
_Health2022.png)
_Health2022.png)
_Health2022.png)
_Health2022.png)
_Health2022.png)
_Health2022.png)
_Health2022.png)
_Health2022.png)
_Health2022.png)
_Health2022.png)
_Health2022.png)
,_residents,_2019_Health2022.png)
_Health2022.png)
_Health2022.png)
_Health2022.png)
_Health2022.png)