Tutorials
Log in
Statistics Explained
menu
search
search
Navigation
Main page
Statistical themes
Glossary
Categories
Statistics 4 beginners
Tutorials
Help
Eurostat home
Education corner
Online publications
Regional yearbook
Sustainable development
Full list
Tools
User contributions
Logs
View user groups
Special pages
search
Navigation
Main page
Statistical themes
Glossary
Categories
Statistics 4 beginners
Tutorials
Help
Eurostat home
Education corner
Online publications
Regional yearbook
Sustainable development
Full list
Tools
User contributions
Logs
View user groups
Special pages
Navigation
Main page
Statistical themes
Glossary
Categories
Statistics 4 beginners
Tutorials
Help
Eurostat home
Education corner
Online publications
Regional yearbook
Sustainable development
Full list
Tools
User contributions
Logs
View user groups
Special pages
Uploads by Antuome
This special page shows all uploaded files.
File list
Items per page:
20
50
100
250
500
Search for media name:
Username:
Include old versions of files
Go
First page
Previous page
Next page
Last page
Date
Name
Thumbnail
Size
Description
Versions
14:47, 23 July 2015
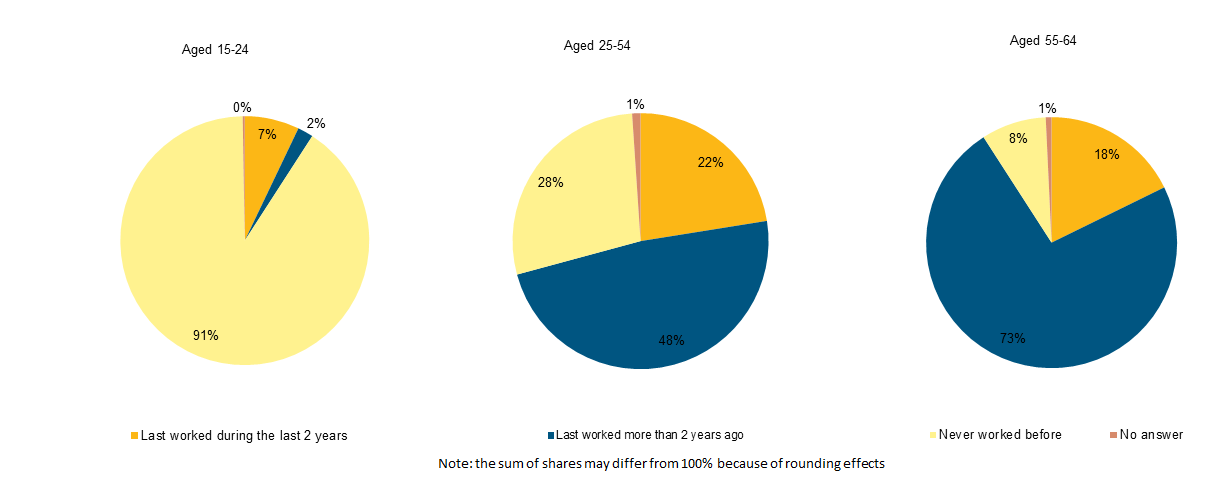
Inactive persons by age group and previous work experience, EU28, 2014.png
(
file
)
33 KB
Reverted to version as of 12:43, 23 July 2015
5
14:52, 23 July 2015
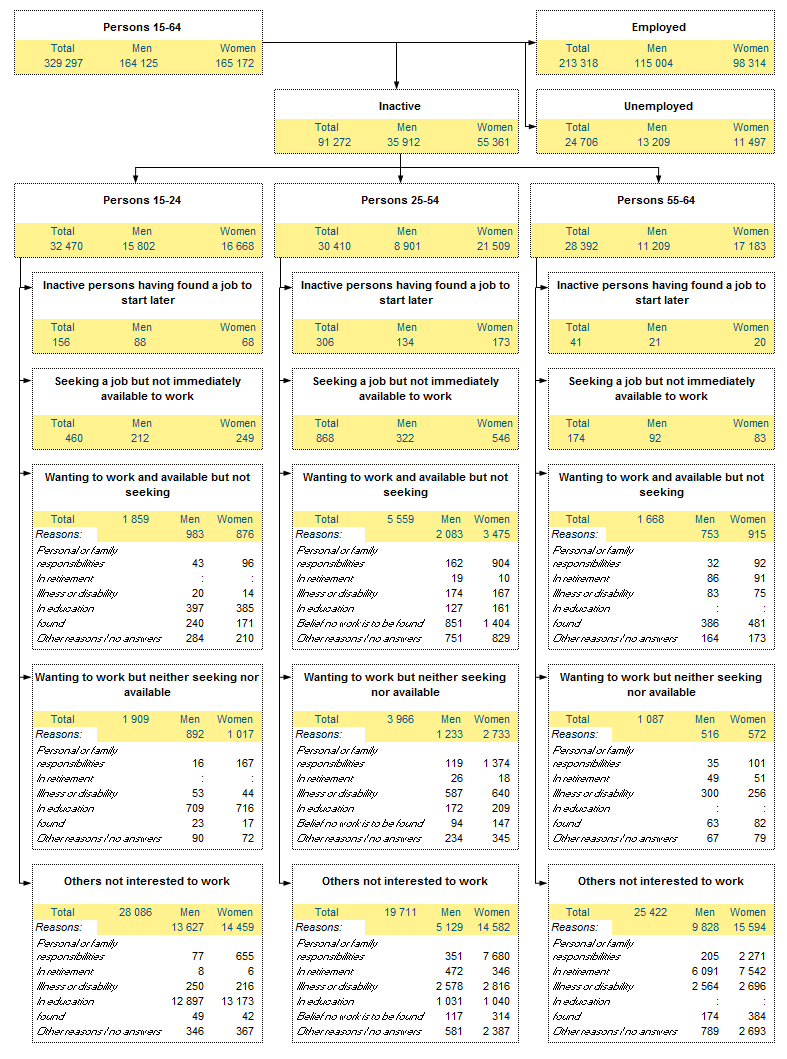
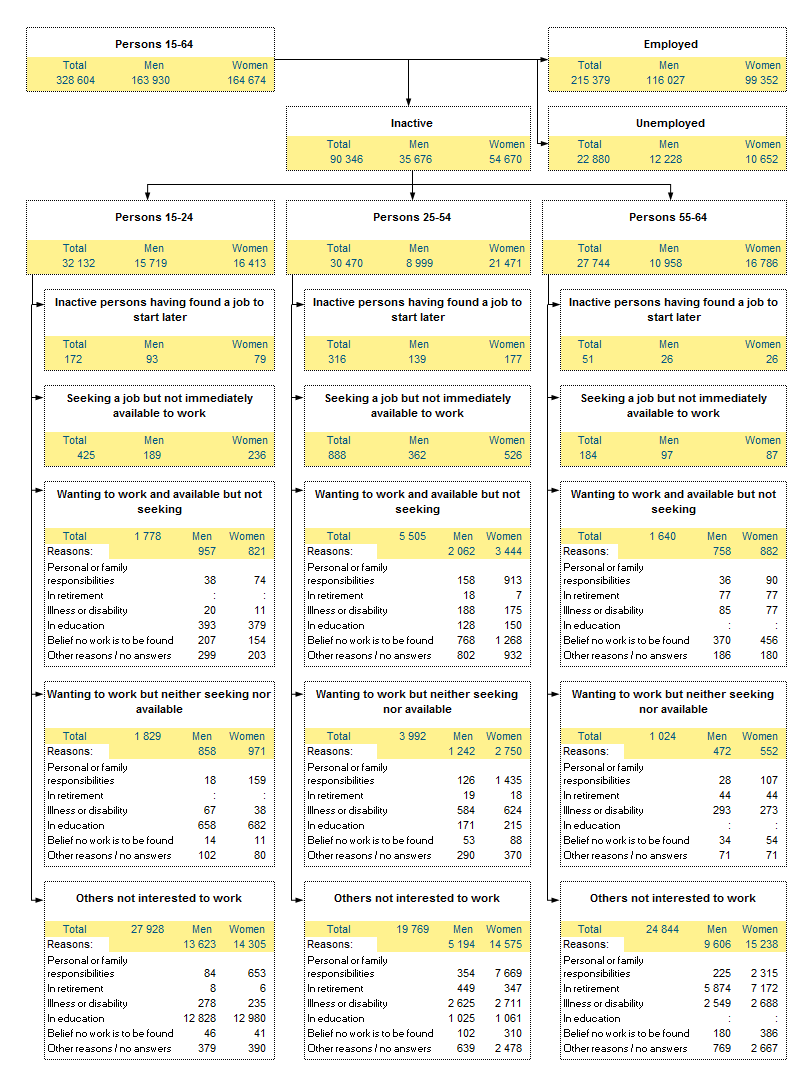
Labour market attachment of persons aged 15-64 in EU-28, 2014 (thousands).png
(
file
)
62 KB
1
09:06, 24 July 2015
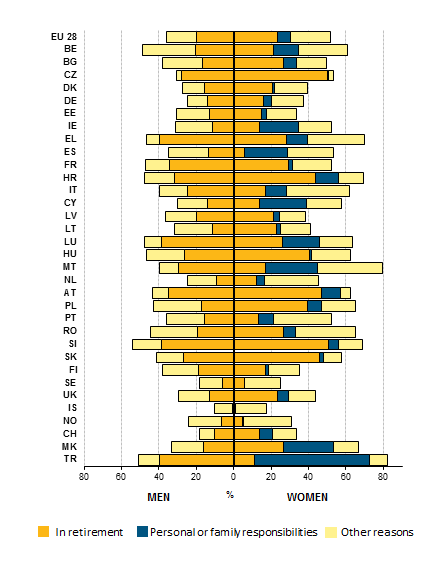
Inactivity rates of older persons (55-64) by sex and main reason for not looking for a job, 2014.png
(
file
)
19 KB
2
09:07, 24 July 2015
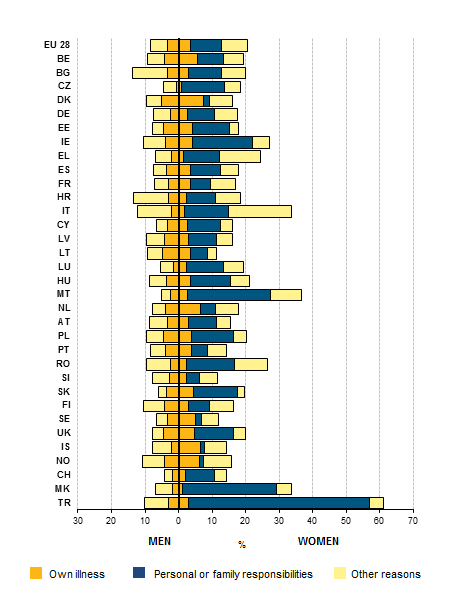
Inactivity rates of prime-aged people (25-54) by sex and main reason for not looking for a job, 2014.png
(
file
)
22 KB
2
09:07, 24 July 2015
Inactivity rates of young persons (15-24) by sex and main reason for not looking for a job, 2014.png
(
file
)
18 KB
2
14:29, 28 July 2015
Inactivity rates 15-64 by sex, EU28, 2002-2014.png
(
file
)
8 KB
2
14:30, 28 July 2015
Inactivity rates of persons aged 25-54 by presence of own young children (0-6 years), 2014.png
(
file
)
17 KB
2
15:24, 28 July 2015
Inactivity rates by sex and age, EU-28, 2002-2014.png
(
file
)
21 KB
6
14:45, 26 August 2016
Inactivity rates 15-64 by sex, EU28, 2002-2014 updated.png
(
file
)
18 KB
2
14:51, 26 August 2016
Inactivity rates 15-64 by sex, EU28, 2002-2015.png
(
file
)
18 KB
1
15:03, 26 August 2016
Inactivity rates by sex and age 2002-2015.png
(
file
)
24 KB
1
15:07, 26 August 2016
Inactivity rates 25-54 by presence of own young children 2015.png
(
file
)
14 KB
3
15:10, 26 August 2016
Inactive persons by age group and previous work experience, EU28, 2015.png
(
file
)
28 KB
1
15:11, 26 August 2016
Labour market attachment of persons aged 15-64 in EU-28, 2015 (thousands).png
(
file
)
64 KB
1
15:28, 30 August 2016
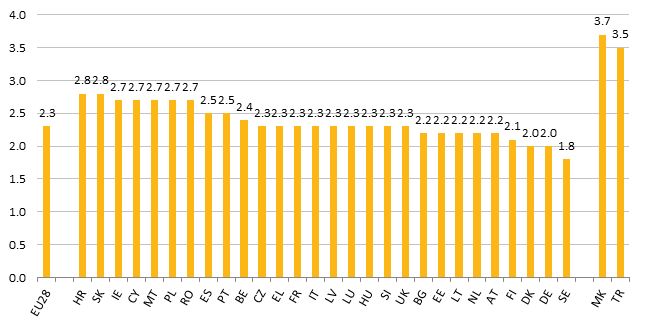
Average household size, 2015 (average number of persons in private households).png
(
file
)
24 KB
1
15:29, 30 August 2016
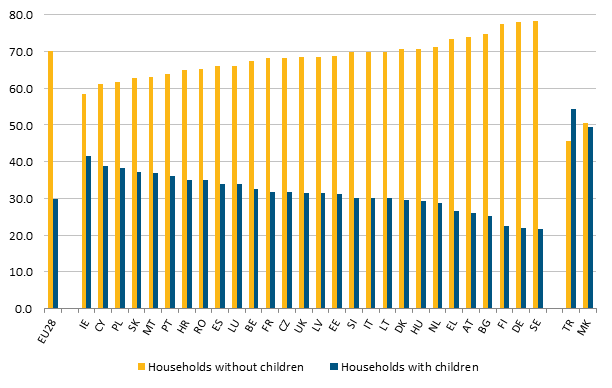
Proportion of population living in private households, by presence of children, 2015.png
(
file
)
22 KB
1
15:34, 30 August 2016
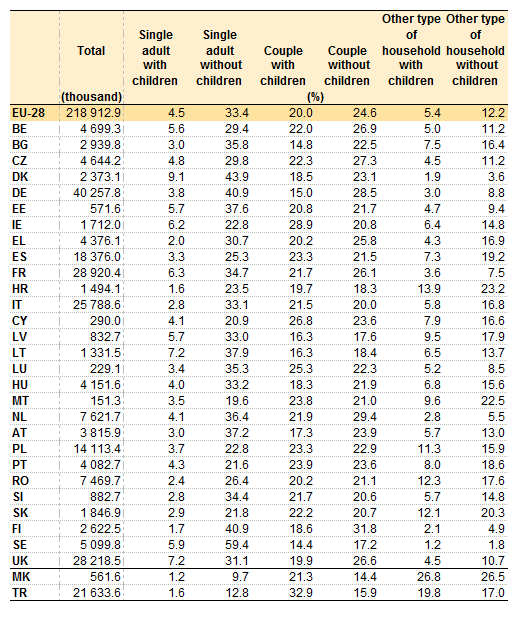
Private households by household composition, 2015 (number of households in 1 000 and % of household types).png
(
file
)
32 KB
2
10:26, 31 August 2016
Inactivity rates of young persons (15-24) by sex and main reason for not looking for a job, 2015.png
(
file
)
19 KB
2
10:27, 31 August 2016
Inactivity rates 25-54 by sex reason 2015.png
(
file
)
18 KB
2
10:28, 31 August 2016
Inactivity rates older persons 55-64 by sex main reason.png
(
file
)
16 KB
4
16:31, 6 September 2016
Private households by household composition, 2015.png
(
file
)
27 KB
1
13:41, 10 October 2016
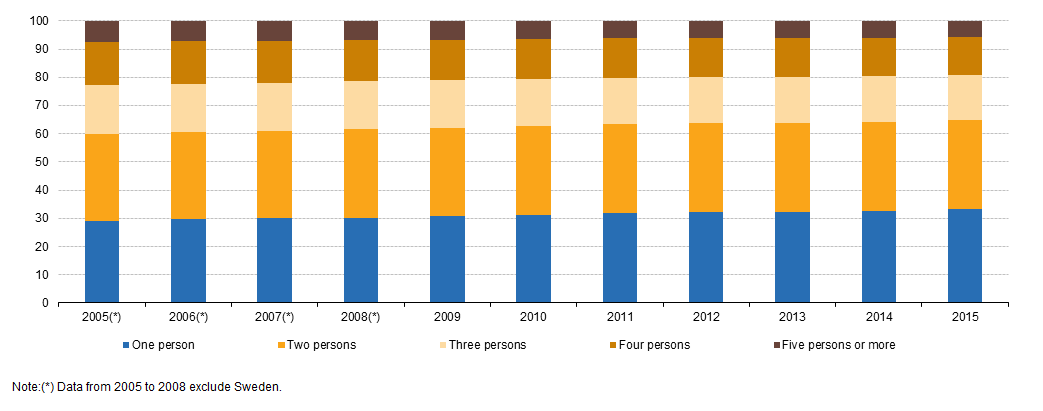
Distribution of household by size, EU-28, 2005-2015.png
(
file
)
19 KB
4
13:47, 10 October 2016
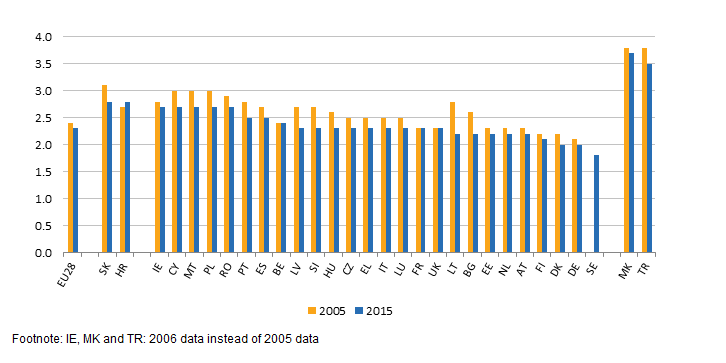
Average household size, 2005 and 2015.png
(
file
)
19 KB
1
13:47, 10 October 2016
Distribution of households by size, EU-28, 2005–15.png
(
file
)
21 KB
1
11:04, 28 August 2017
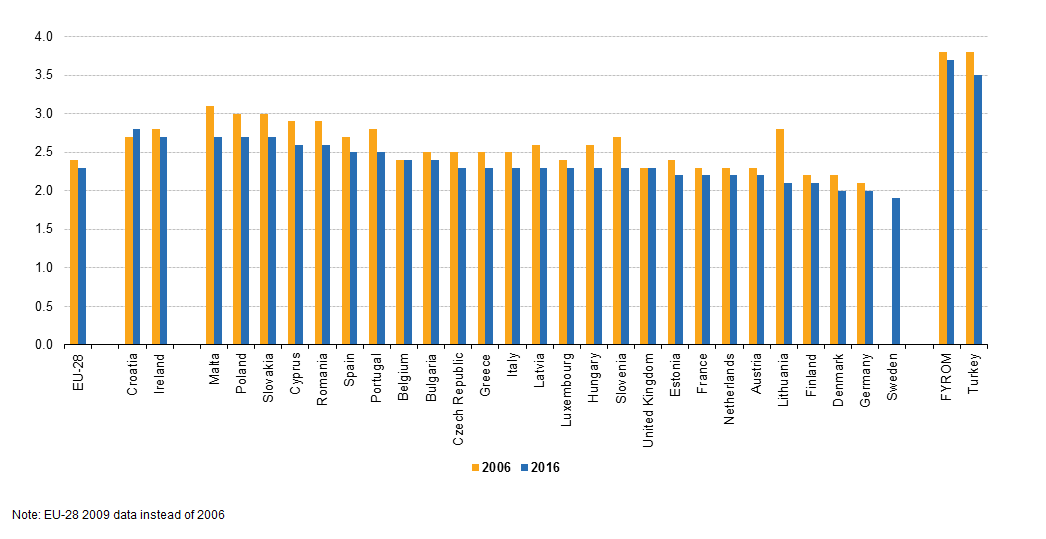
Average household size, 2005 and 2016 (average number of persons in private households) new.png
(
file
)
47 KB
1
09:17, 29 August 2017
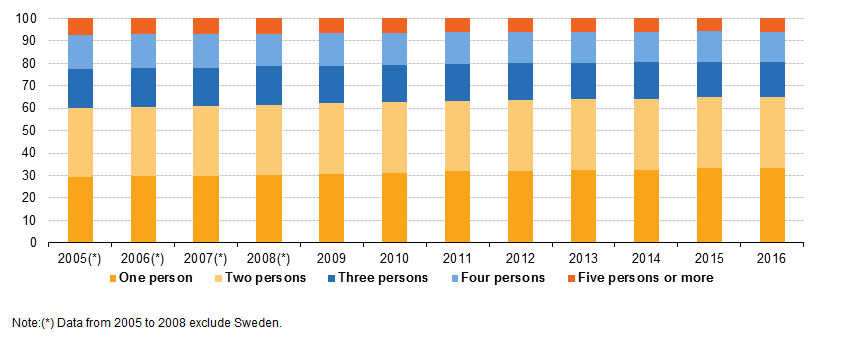
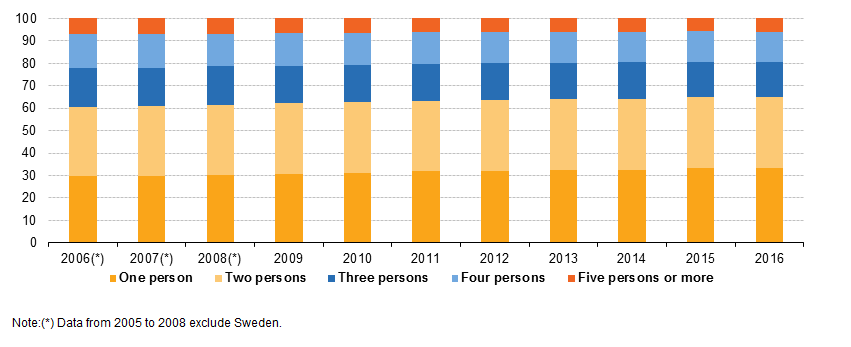
Distribution of households by size, EU-28, 2005–16 (% of all households) final.png
(
file
)
19 KB
5
10:32, 29 August 2017
Distribution of households by size, EU-28, 2005–16 (% of all households) new.png
(
file
)
19 KB
1
11:27, 29 August 2017
Distribution of households by size, EU-28, 2006–16 (% of all households) new.png
(
file
)
18 KB
1
12:06, 20 September 2017
Inactivity rates 15-64 by sex, EU28, 2002-2016 new.png
(
file
)
19 KB
1
12:06, 20 September 2017
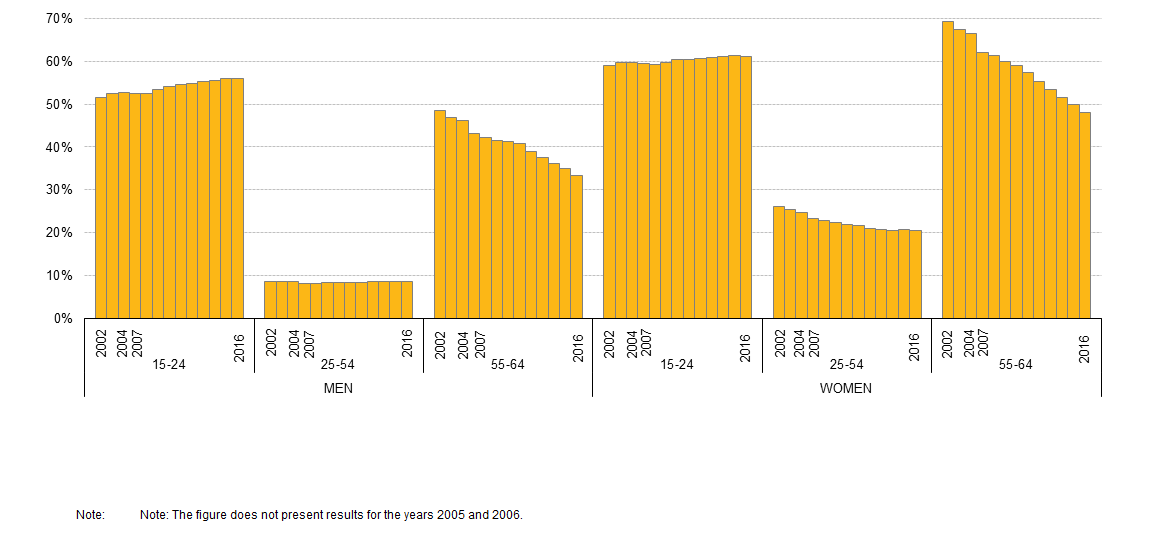
Inactivity rates by sex and age, EU-28, 2002-2016 (%) V2.png
(
file
)
27 KB
1
12:07, 20 September 2017
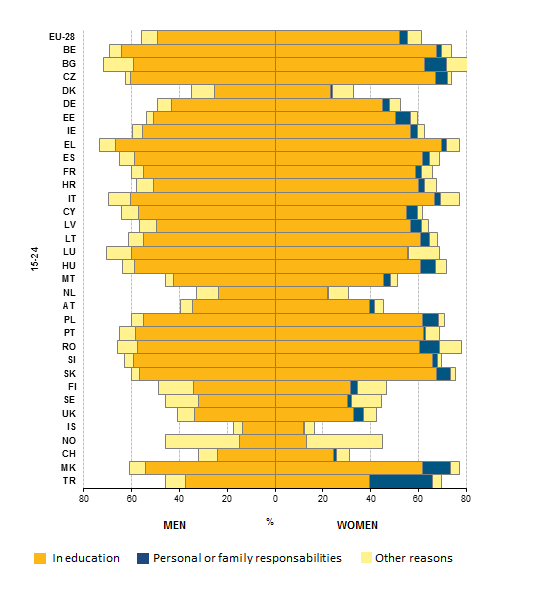
Inactivity rates of young persons (15-24) by sex and main reason for not looking for a job, 2016 update.png
(
file
)
19 KB
1
12:15, 20 September 2017
Inactivity rates of persons aged 25-54 by presence of own young children (0-6 years), 2016 V2.png
(
file
)
14 KB
1
14:22, 20 September 2017
Inactive persons by age group and previous work experience, EU28, 2016 new.png
(
file
)
26 KB
1
14:23, 20 September 2017
Labour market attachment of persons aged 15-64 in EU-28, 2016 (Thousands) V2.png
(
file
)
65 KB
1
15:25, 7 March 2018
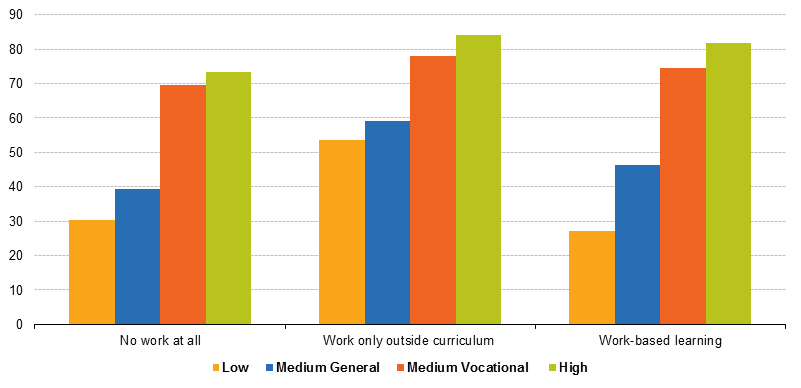
Unemployment rate by education level, type and by work experience during studies , EU-28, 2016 (% of people aged 15-34 who had any form of completed formal education).png
(
file
)
26 KB
2
16:46, 7 March 2018
Employment rate by education type and by work experience during studies , EU-28, 2016 (% of people aged 15-34 who had any form of completed formal education).png
(
file
)
17 KB
2
18:10, 7 March 2018
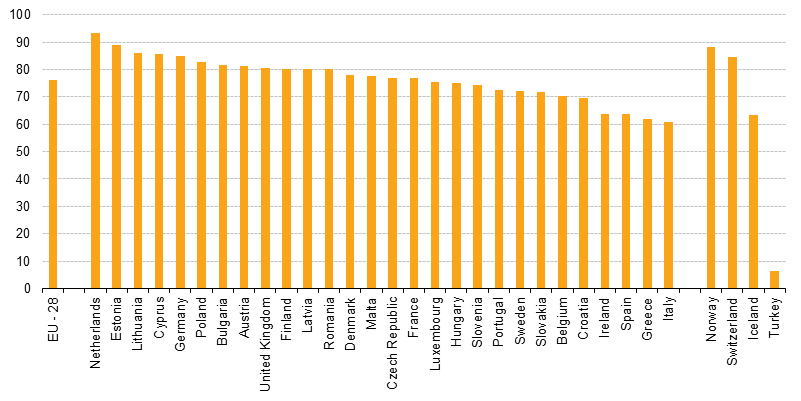
People not having or not willing to have more than one hour travel time each way to work, 2016 ( % of people aged 15-34 ).png
(
file
)
33 KB
1
15:35, 28 May 2018
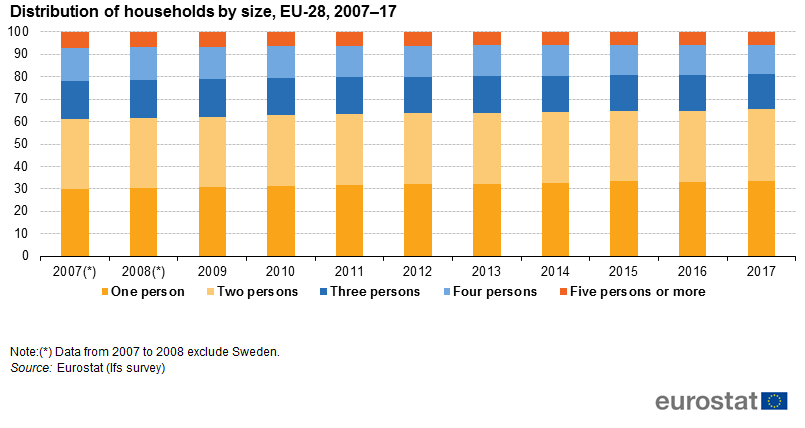
Distribution of households by size, EU-28, 2007–17 (% of all households) new.png
(
file
)
25 KB
1
15:43, 29 May 2018
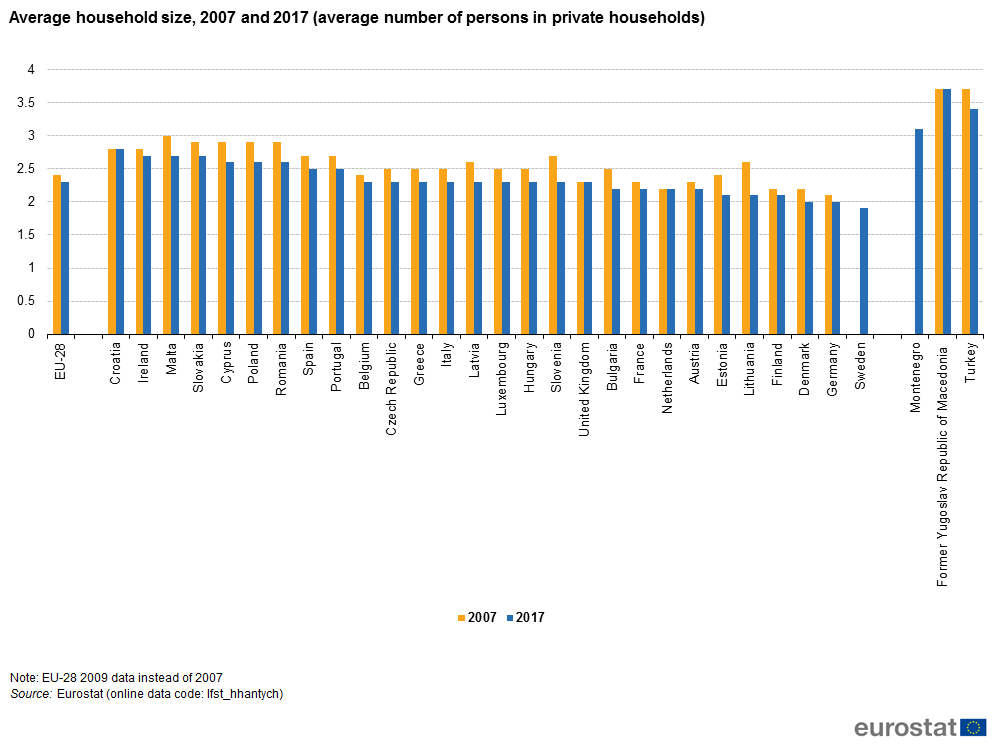
Average household size, 2007 and 2017 (average number of persons in private households) new.png
(
file
)
51 KB
3
15:45, 29 May 2018
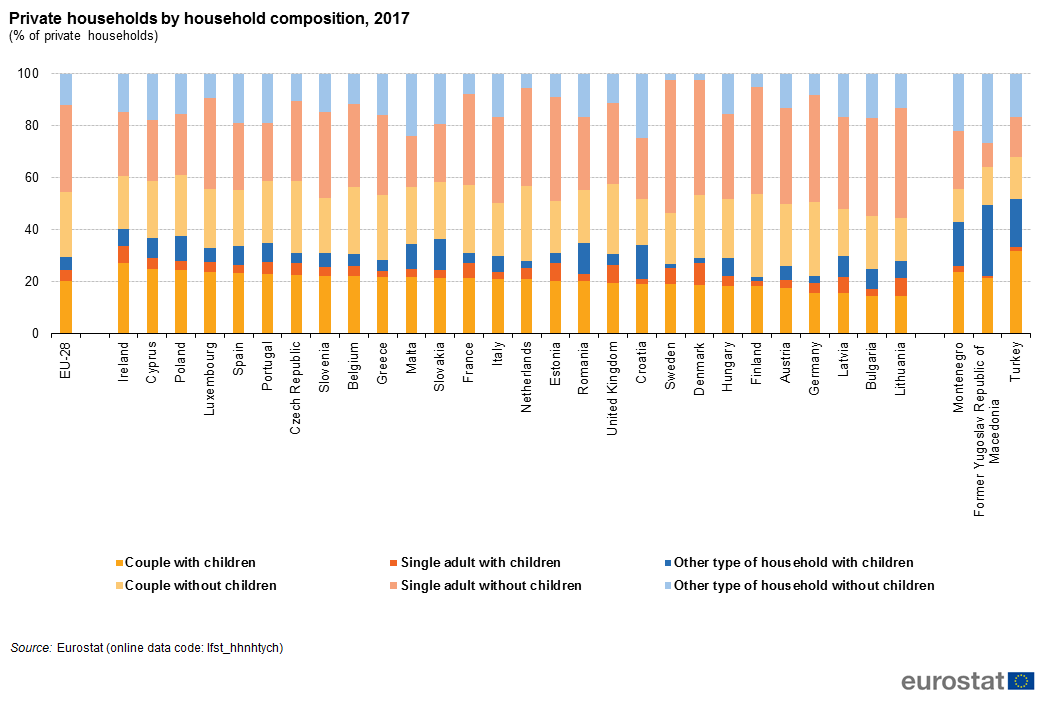
Private households by household composition, 2017 (% of private households) final.png
(
file
)
54 KB
3
15:46, 29 May 2018
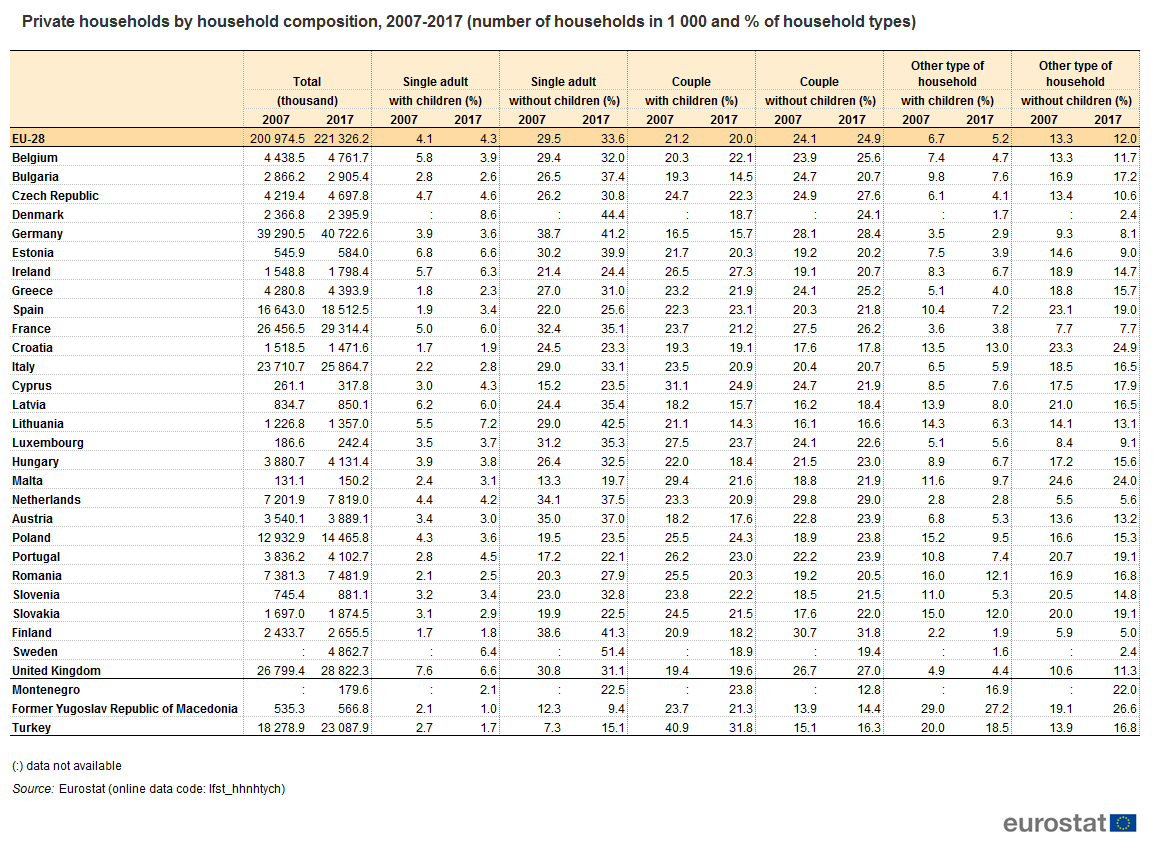
Private households by household composition, 2007-2017 (number of households in 1 000 and % of household types) new.png
(
file
)
76 KB
2
16:09, 8 August 2018
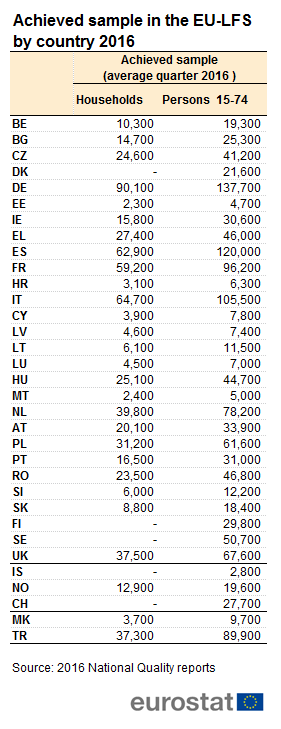
Achieved sample in the EU-LFS by country 2016.png
(
file
)
23 KB
1
11:27, 8 October 2018
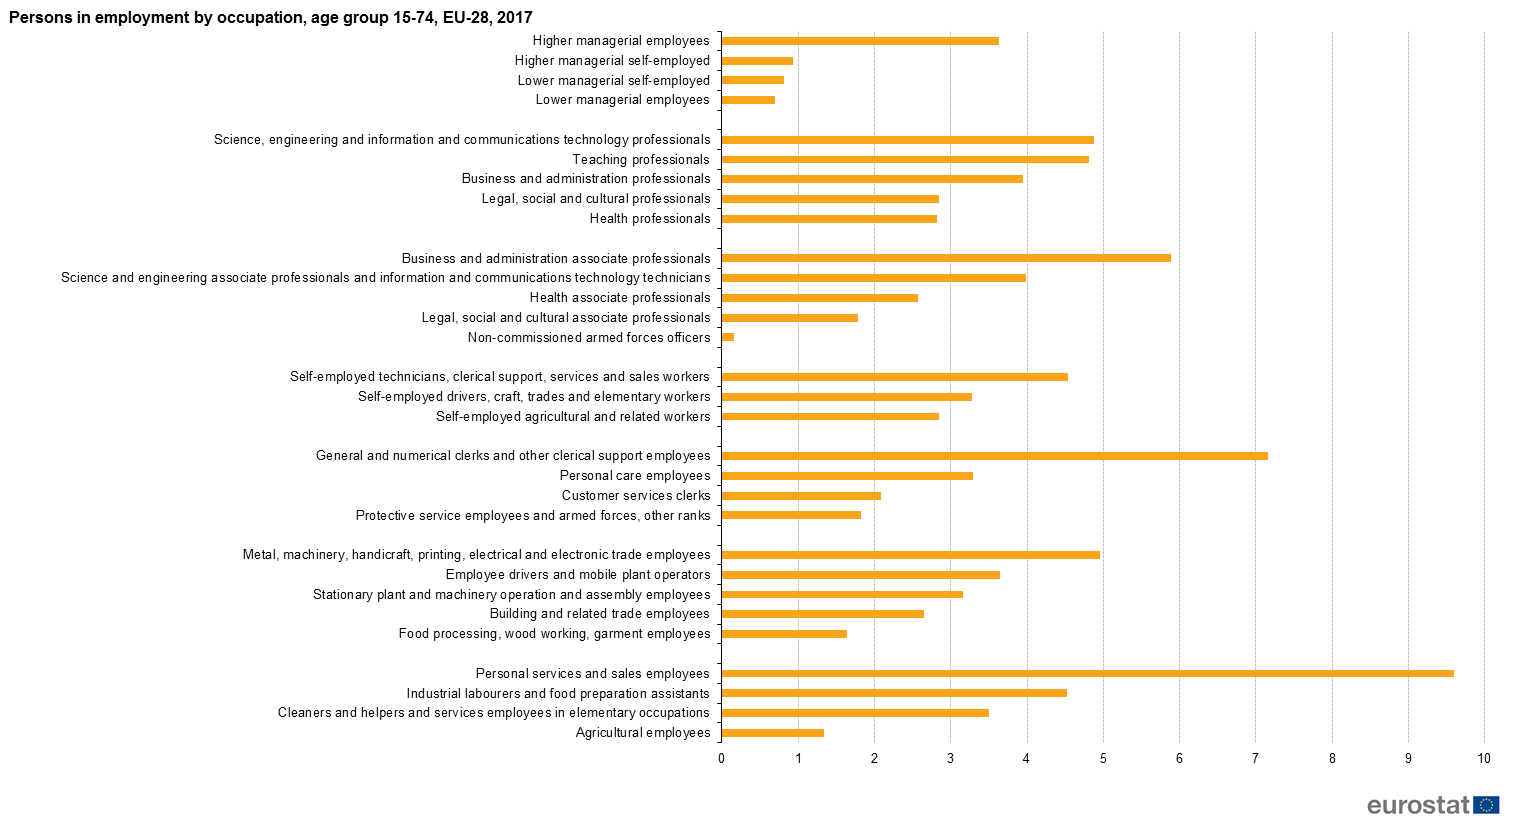
Persons in employment by occupation, age group 15-74, EU-28, 2017 (% of total employment) YB17 v2.png
(
file
)
67 KB
1
16:35, 8 October 2018
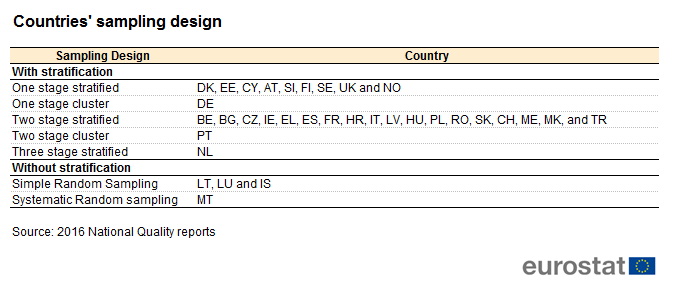
Countries' sampling design.png
(
file
)
16 KB
without rs
2
16:36, 8 October 2018
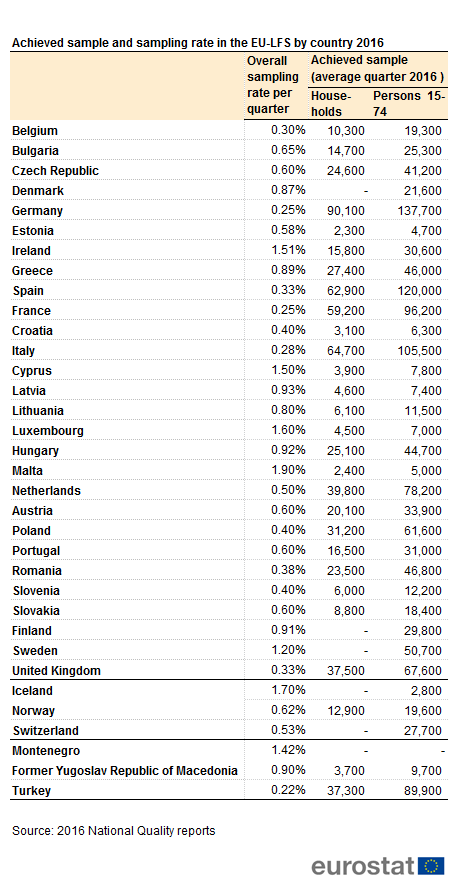
Achieved sample and sampling rate in the EU-LFS by country 2016.png
(
file
)
42 KB
+ Montenegro
4
16:42, 8 October 2018
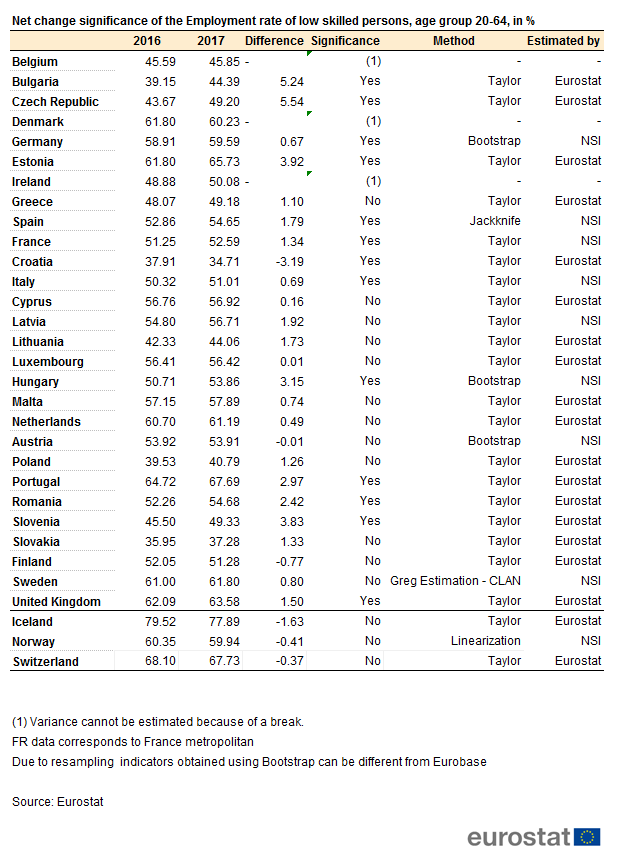
Net change significance of the Employment rate of low skilled persons, age group 20-64, in % .png
(
file
)
52 KB
Latvia corrected
2
16:59, 6 November 2018
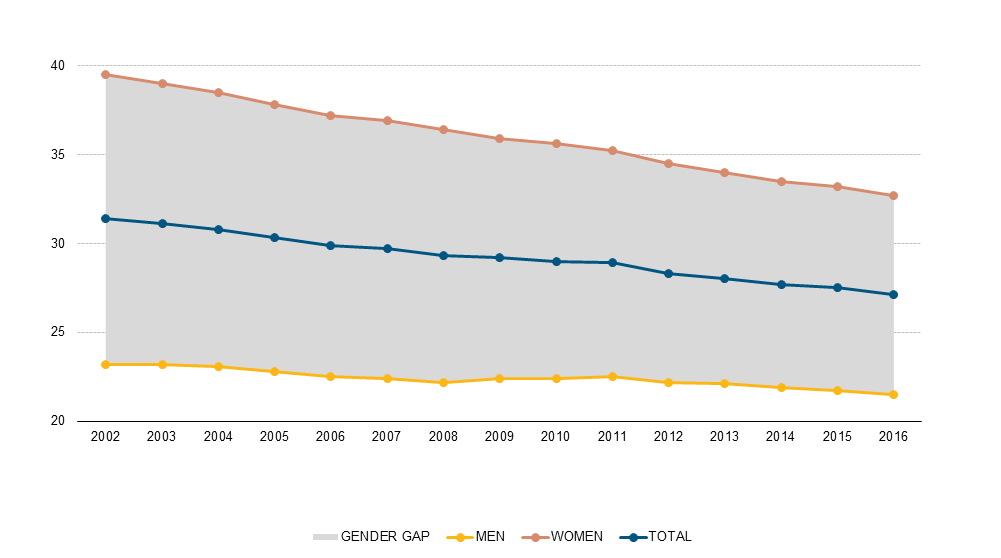
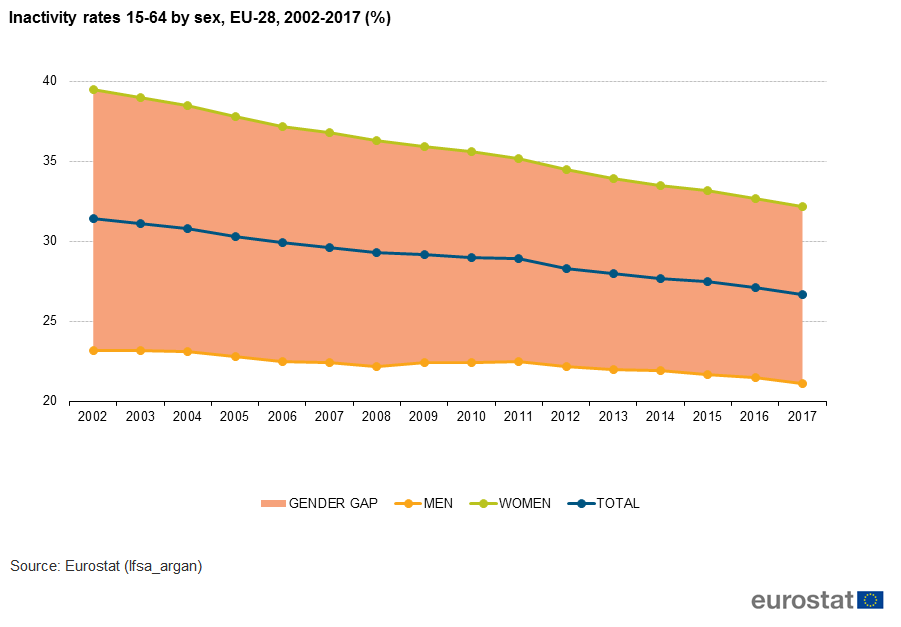
Inactivity rates 15-64 by sex, EU-28, 2002-2017 (%).png
(
file
)
25 KB
1
17:00, 6 November 2018
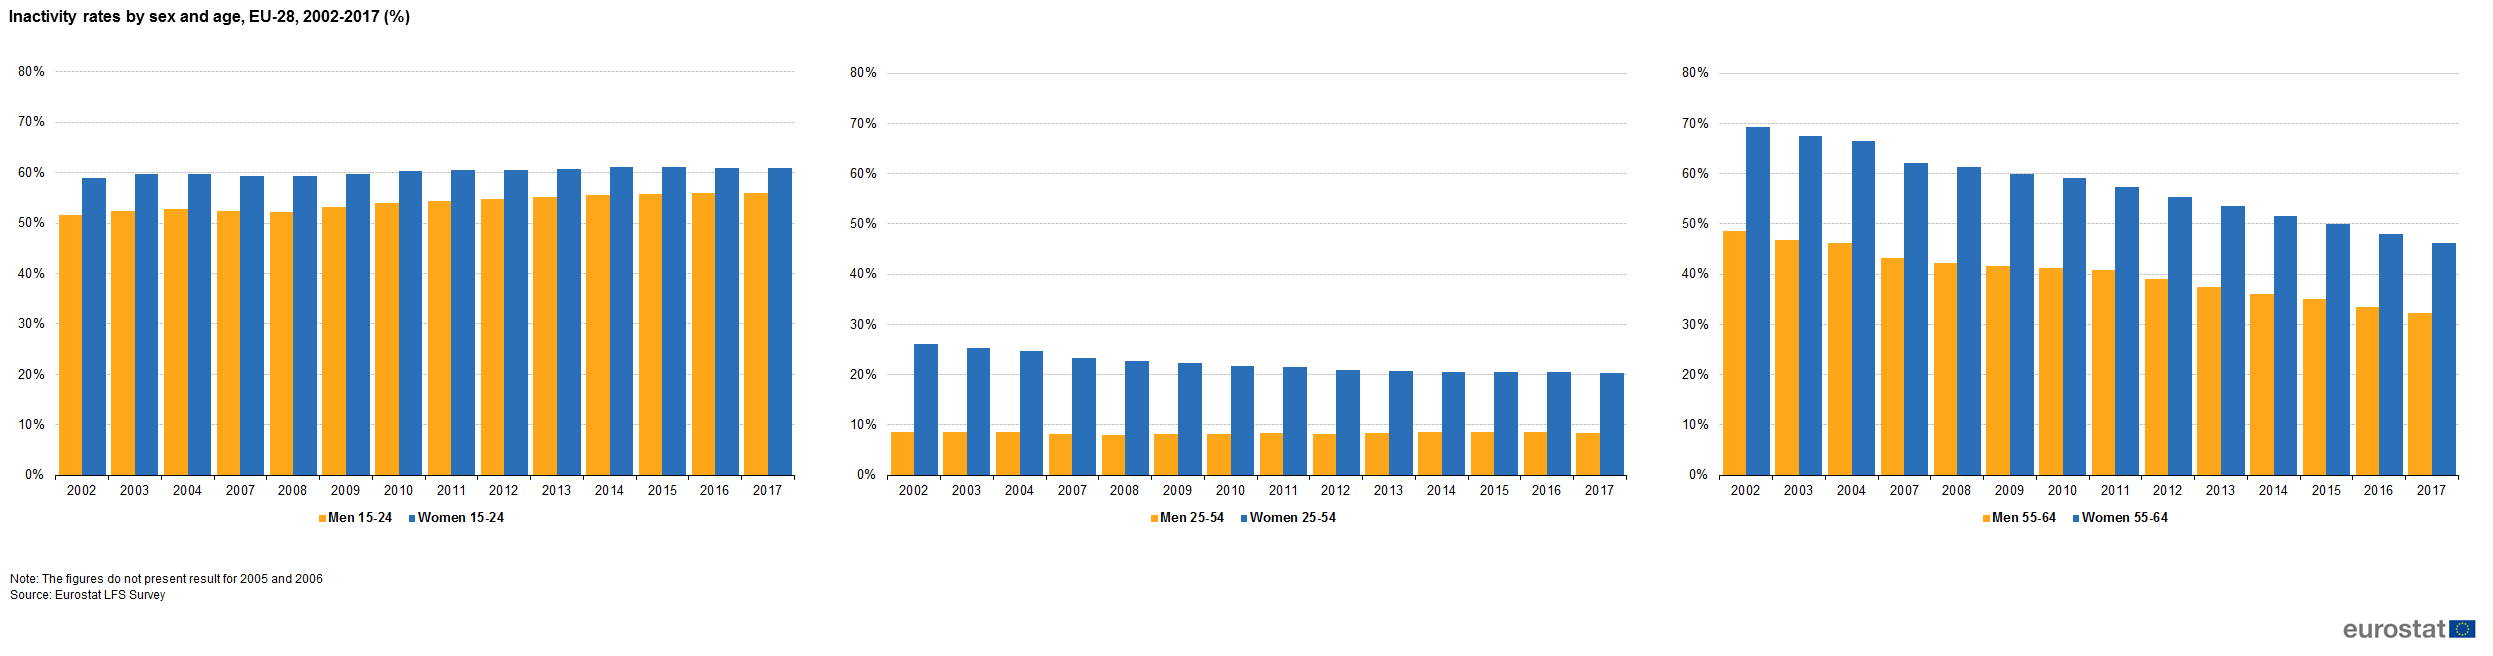
Inactivity rates by sex and age, EU-28, 2002-2017 (%) final.png
(
file
)
90 KB
1
17:04, 6 November 2018
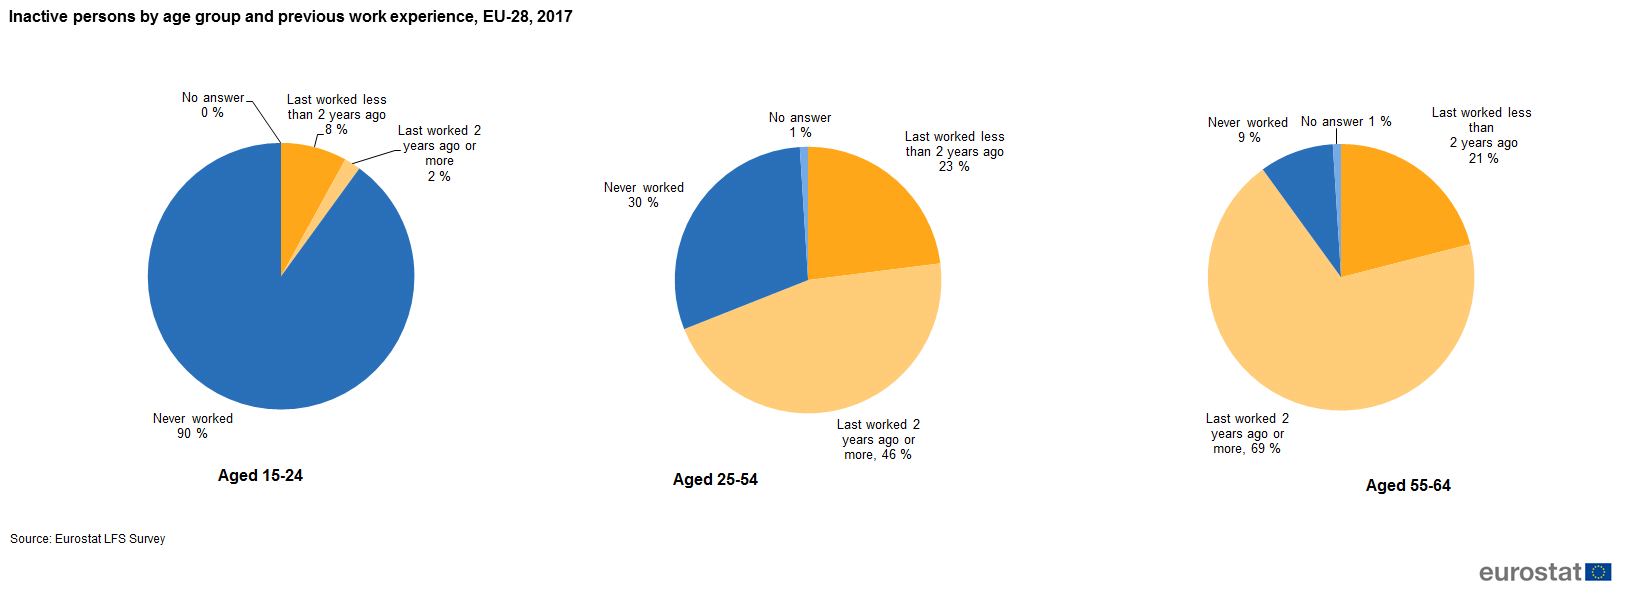
Inactive persons by age group and previous work experience, EU-28, 2017.png
(
file
)
45 KB
1
16:33, 8 November 2018
Inactivity rates of prime-aged people (25-54) by sex and main reason for not looking for a job, 2016 new.png
(
file
)
82 KB
Reverted to version as of 09:50, 27 September 2017
4
First page
Previous page
Next page
Last page
Special page
ISSN 2443-8219

.png)
_by_sex_and_main_reason_for_not_looking_for_a_job,_2014.png)
_by_sex_and_main_reason_for_not_looking_for_a_job,_2014.png)
_by_sex_and_main_reason_for_not_looking_for_a_job,_2014.png)

,_2014.png)


.png)
.png)

.png)
_by_sex_and_main_reason_for_not_looking_for_a_job,_2015.png)


_new.png)
_final.png)
_new.png)
_new.png)

_V2.png)
_by_sex_and_main_reason_for_not_looking_for_a_job,_2016_update.png)
,_2016_V2.png)

_V2.png)
.png)
.png)
.png)
_new.png)
_new.png)
_final.png)
_new.png)

_YB17_v2.png)


.png)

_by_sex_and_main_reason_for_not_looking_for_a_job,_2016_new.png)
_final.png)