Reference metadata describe statistical concepts and methodologies used for the collection and generation of data. They provide information on data quality and, since they are strongly content-oriented, assist users in interpreting the data. Reference metadata, unlike structural metadata, can be decoupled from the data.
The Retail Trade Turnover Index refers to the whole country. The General Index is composed of the separate indices for the eleven (11) categories of aggregated economic activity classes. These categories result from the aggregation of the relevant economic activity classes (NACE Rev. 2 codes: 4711-4799).
The eleven (11) categories of aggregated economic activity classes of the Retail Trade Turnover and Volume Indices are the following:
Supermarkets
Department stores
Food, beverages and tobacco
Automotive fuel-lubricants
Pharmaceuticals and cosmetics[1]
Clothing and footwear[2]
Furniture, electrical goods, household goods[3]
Books, stationery and other articles[4]
Retail sale via mail order houses or via Internet
Retail sale of second-hand goods in stores
Retail trade not in stores, stalls or markets
The breakdown of the Retail Trade Volume Index is similar, the difference being that for the last three categories, it is not calculated the Volume Index.
The Turnover Index in Wholesale Trade (div.46) includes the activities classified under Division 46 (Wholesale trade, except of motor vehicles and motorcycles) of NACE Rev.2 classification.
Division 46 (Wholesale trade) includes the following activities:
Wholesale on a fee or contract basis
Wholesale of agricultural raw materials and live animals
Wholesale of food, beverages and tobacco
Wholesale of household goods
Wholesale of information and communication equipment
Wholesale of other machinery, equipment and supplies
Other specialized wholesale
Non-specialized wholesale trade
The Turnover Index for Motor Trade (div.45) includes the activities classified under Division 45 (Wholesale and retail trade and repair of motor vehicles and motorcycles) of NACE Rev.2 classification.
More specifically, Division 45 includes the following groups:
451 Sale of motor vehicles
452 Maintenance and repair of motor vehicles
453 Sale of motor vehicle parts and accessories
454 Sale, maintenance and repair of motorcycles and related parts and accessories.
Turnover Index for Motor Trade is compiled for the Division (two-digit code) 45 and Group (three-digit code) 451 of the NACE Rev.2 classification.
[1] Dispensing chemist, medical and orthopaedic goods, cosmetic and toilet articles in specialised stores.
[2] Textiles, clothing, footwear and leather goods in specialised stores.
[3]Furniture, lighting equipment, audio and video equipment, hardware, paints and glass, electrical household appliances and other household articles, music and video recordings in specialised stores.
[4]Books, newspapers and stationery, computers, peripheral units and software, telecommunications equipment, carpets, rugs, wall and floor coverings, sporting equipment, games and toys, flowers, plants, seeds, fertilisers, pet animals and pet food, watches and jewellery, other retail sale of new goods in specialised stores.
3.2. Classification system
NACE Rev.2 statistical classification of economic activities is applied, in conformity with Regulation (EC) 1893/2006 of the Council and the European Parliament.
3.3. Coverage - sector
The Trade Turnover indices (according to the NACE Rev.2 classification), cover the economic activity divisions identified by codes 4711 to 4799 (inclusive) and the divisions 45 and 46.
3.4. Statistical concepts and definitions
The aim of the indices is to measure in value terms the activity of Wholesale and retail trade and repair of motor vehicles and motorcycles in the market. Turnover excludes VAT and comprises the totals invoiced by the enterprise during the reference period (month), which correspond to sales of goods or services supplied to third parties.
The definitions used, in accordance with Commission Regulation (EC) No 1503/2006 defining variables and frequency of data compilation, repealing new orders received for building construction and new orders received for civil engineering are as follows:
turnover comprises the totals invoiced by the enterprise per Kind of Activity Unit (KAU) during the reference period, and this corresponds to market sales of goods and services supplied to third parties
turnover includes all duties and taxes on the services invoiced by the enterprise per Kind of Activity unit (KAU), with the exception of the VAT passed on by the enterprise to its customers. It also includes all other charges (transport, packaging, etc.) passed on to the customer, even if these charges are listed separately in the invoice
More specifically, the items generally included in turnover are the following:
sales of manufactured products
sales of products manufactured by subcontractors
sales of goods purchased for resale in the same condition as received
sales of by-products
invoiced charges for packaging and transport
hours worked invoiced to third parties for labour-only subcontracting
invoiced mounting, installations and repairs
invoiced installments (stage payments)
sales of waste and scrap materials
Price reductions, rebates and bonuses conceded later to clients, for example at the end of the year, are not taken into account. Income classified as other operating income, financial income and extraordinary income in company accounts are excluded from turnover. Any operating subsidies received are also excluded.
The deflators for retail index were calculated by Harmonized Consumer Price Index at Constant Tax rates (HICP-CT). Therefore, there is a complete coherence of these deflators in consumption with the domestic turnover of retail sales.
The sales volume represents the turnover value at constant prices and is a quantitative index. It can be calculated as the turnover at current prices, deflated by applying the sales deflator or as a quantitative index derived directly from the quantity of goods sold (for div. 45 and 46).
3.5. Statistical unit
The reporting unit is the enterprise per Kind of Activity unit (KAU).
3.6. Statistical population
For the Turnover Index in Retail Trade (div.47) the population encompasses 32,504 enterprises from Structual Business Statistics (SBS) 2021 and the Business Register (BR) of ELSTAT, with annual turnover in year 2021 equal to or higher than 200,000 €.
For the Turnover Index in Wholesale Trade (div. 46), the population encompasses 18,247 enterprises from SBS 2021 and the BR of ELSTAT with annual turnover in year 2021 equal to or higher than 300,000 €.
For the Turnover Index for Motor Trades (div. 45), the population encompasses 3,944 enterprises from the SBS 2021 and the BR of ELSTAT with annual turnover in year 2021 equal to or higher than 200,000 €.
3.7. Reference area
Geographical level of the data is the whole country.
3.8. Coverage - Time
The time series of the Retail Trade Turnover and Volume indices (2021=100.0), which includes the retail trade of fuel in specialized "fuel" stores, is available monthly, with the first reference period in January 2000.
The availability of the Retail Trade Turnover and Volume indices (2021=100.0), without "fuel" becomes monthly, with the first reference period in January 1995.
The distribution of the Retail Trade Turnover and Volume indices (2021=100.0), with the inclusion and without the inclusion of fuels is done monthly, with the first reference period in January 2000.
3.9. Base period
The base year is the year 2021 (2021=100.0).
Indices, percentage (%) change of rates (monthly and annually).
Month.
6.1. Institutional Mandate - legal acts and other agreements
The legal framework concerning the organization and operation of ELSTAT is as follows:
Law 3832/2010 (Government Gazette No 38, Issue Α): "Hellenic Statistical System Establishment of the Hellenic Statistical Authority (ELSTAT) as an Independent Authority", as amended and in force
Regulation on the Operation and Administration of the Hellenic Statistical Authority (ELSTAT), 2012, (Government Gazette No 2390, Issue B, 28 August 2012)
Regulation (EC) No 223/2009 of the European Parliament and of the Council, on the European statistics (Official Journal of the European Union L 87/164article 14 of the Law 3470/2006 (Government Gazette No 132, Issue A): “National Export Council, tax regulations and other provisions”
Article 3, paragraph 1c, of the Law 3448/2006 (Government Gazette No 57, Issue A): “For the further use of information coming from the public sector and the settlement of matters falling within the responsibility of the Ministry of Interior, Public Administration and Decentralization”
European Statistics Code of Practice, adopted by the Statistical Programme Committee on 24 February 2005 and promulgated in the Commission Recommendation of 25 May 2005 on the independence, integrity and accountability of the national and Community statistical Authorities, after its revision, which was adopted on 28 September 2011 by the European Statistical System Committee
Residential decree 226/2000 (Government Gazette No 195, Issue Α): “Organization of the General Secretariat of the National Statistical Service of Greece”
Articles 4, 12 , 13, 14, 15 and 16 of the Law 2392/1996 (Government Gazette No 60, Issue Α): "Access of the General Secretariat of the National Statistical Service of Greece to administrative sources and administrative files, Statistical Confidentiality Committee, settlement of matters concerning the conduct of censuses and statistical works, as well as of matters of the General Secretariat of the National Statistical Service of Greece"
EU legislation:
The legal basis is Regulation (EU) 2019/2152 of the European Parliament and of the Council on Business Statistics, as well as Commission Implementing Regulation (EU) 2020/1197 laying down technical specifications and regulations pursuant to Regulation (EU) 2019/2152. In addition, Regulation (EC) No. 1893/2006 of the European Parliament and of the Council on the establishment of the statistical nomenclature of economic activities NACE Rev. 2. The definitions of short-term statistics (STS) variables and the classification by main industrial groups (MIG), are defined in Implementing Regulation (EU) no. 2020/1197 of the Commission
6.2. Institutional Mandate - data sharing
The Turnover Indices in Trade are transmitted to Eurostat according to the to EU legislation.
7.1. Confidentiality - policy
The issues concerning the observance of statistical confidentiality by the Hellenic Statistical Authority (ELSTAT) are arranged by articles 7, 8 and 9 of the Law 3832/2010 as in force, by Articles 8, 10 and 11(2) of the Regulation on Statistical Obligations of the agencies of the Hellenic Statistical System and by Articles 10 and 15 of the Regulation on the Operation and Administration of ELSTAT.
More precisely:
ELSTAT disseminates the statistics in compliance with the statistical principles of the European Statistics Code of Practice and in particular with the principle of statistical confidentiality.
7.2. Confidentiality - data treatment
ELSTAT protects and does not disseminate data it has obtained or it has access to, which enable the direct or indirect identification of the statistical units that have provided them by the disclosure of individual information directly received for statistical purposes or indirectly supplied from administrative or other sources. ELSTAT takes all appropriate preventive measures so as to render impossible the identification of individual statistical units by technical or other means that might reasonably be used by a third party. Statistical data that could potentially enable the identification of the statistical unit are disseminated by ELSTAT if and only if:
these data have been treated, as it is specifically set out in the Regulation on Statistical Obligations of the agencies of the Hellenic Statistical System (ELSS), in such a way that their dissemination does not prejudice statistical confidentiality or
the statistical unit has given its consent, without any reservations, for the disclosure of data.
The confidential data that are transmitted by ELSS agencies to ELSTAT are used exclusively for statistical purposes and the only persons who have the right to have access to these data are the personnel engaged in this task and appointed by an act of the President of ELSTAT.
ELSTAT may grant researchers conducting statistical analyses for scientific purposes access to data that enable the indirect identification of the statistical units concerned.
The access is granted provided the following conditions are satisfied:
an appropriate request together with a detailed research proposal in conformity with current scientific standards have been submitted
the research proposal indicates in sufficient detail the set of data to be accessed, the methods of analyzing them, and the time needed for the research
a contract specifying the conditions for access, the obligations of the researchers, the measures for respecting the confidentiality of statistical data and the sanctions in case of breach of these obligations has been signed by the individual researcher, by his/her institution, or by the organization commissioning the research, as the case may be, and by ELSTAT
Issues referring to the observance of statistical confidentiality are examined by the Statistical Confidentiality Committee (SCC) operating in ELSTAT. The responsibilities of this Committee are to make recommendations to the President of ELSTAT on:
the level of detail at which statistical data can be disseminated, so as the identification, either directly or indirectly, of the surveyed statistical unit is not possible
the anonymization criteria for the microdata provided to users
the granting to researchers access to confidential data for scientific purposes
The staff of ELSTAT, under any employment status, as well as the temporary survey workers who are employed for the collection of statistical data in statistical surveys conducted by ELSTAT, who acquire access by any means to confidential data, are bound by the principle of confidentiality and must use these data exclusively for the statistical purposes of ELSTAT. After the termination of their term of office, they are not allowed to use these data for any purpose.
Violation of data confidentiality and/or statistical confidentiality by any civil servant or employee of ELSTAT constitutes the disciplinary offence of violation of duty and may be punished with the penalty of final dismissal.
ELSTAT, by its decision, may impose a penalty amounting from ten thousand (10,000) up to two hundred thousand (200,000) euros to anyone who violates the confidentiality of data and/or statistical confidentiality. The penalty is always imposed after the hearing of the defense of the person liable for the breach, depending on the gravity and the repercussions of the violation. Any relapse constitutes an aggravating factor for the assessment of the administrative sanction.
8.1. Release calendar
A Relese calendar is available on the website with the precise release dates of statistics for the following year.
8.2. Release calendar access
The calendar is distributed to the press and is available to all interested parties free of charge.
In line with the Community legal framework and the European Statistics Code of Practice, ELSTAT disseminates national statistics on the website, respecting professional independence and in an objective, professional and transparent manner in which all users are treated equally.
In this context, data are released simultaneously to all interested parties and users through the Announcements on the specific indices, which are posted on the website of ELSTAT, at the following links, according to the release calendar:
The Turnover Indices in Trade are released,every month, t+60 days after the end of the reference month t. All announcements are published at 12.00 and are also available on the website of ELSTAT
10.2. Dissemination format - Publications
Data are released in publications of ELSTAT such as specific publications: “The Greek Economy” and "Greece in figures".
Users can be given data or further analysis, usually by e-mail after submitting a request, describing the requested data to the Section of Statistical Dissemination (the Trade and Services Indices Section will be informed), at the following e-mail addresses: data.dissem@statistics.gr, data.supply@statistics.gr and data.source@statistics.gr.
Users can also submit their requests electronically, through the portal
The methodology for the compilation of the indicies is laid down by ELSTAT, taking into account international practices and, in particular, Eurostat’s recommendations, guidelines and standards, included in Eurostst Website.
Metadata for the compilation of the Turnover Indices in Trade (Retail, Wholesale and Motor trade) are available on the website of ELSTAT, with the completeness rate in 100%.
10.7. Quality management - documentation
A user oriented short quality report is available at the link:
The Hellenic Statistical Authority (ELSTAT) aims to ensure and further improve the quality of statistics produced and maintain the confidence of users in them. This is achieved through the Quality Policy of ELSTAT.
Quality checks and validation of data are carried out during the whole process of the compilation of the indices - from the data collection stage to the final compilation of the indices.
The well-trained and experienced staff deals with all the stages of the compilation of the indices, that is: data collection, including communication with the enterprises, initial checks of the data as to their correctness, data entry and final checks, which are conducted after the calculation of the index. This way, the personnel have a comprehensive and long-standing experience with the enterprises under survey.
Data are validated either before or after data entry by means of logical checks. During data processing, the data are checked in order to identify and correct any measurement or data entry errors. The detection of these errors is done in data of the enterprises, by examining whether these data are within a certain range of values, based on the size of the enterprises, as well as the seasonality of the data. At the same time, data are checked for completeness, accuracy and consistency of the correlating variables.
The indices are calculated by means of specialised software, through computation routines, thus eliminating any errors to the final results. Nevertheless, even during this stage, consistency checks are carried out to the final results, mainly on comparing the percentage changes of the corresponding quarters.
11.2. Quality management - assessment
The Turnover Indices in Trade are considered to be reliable and sufficiently accurate indices, because:
the concepts, definitions and methodology applied in the compilation of the indices follow the European and international standards and guidelines
the accuracy of data used is accomplished by quality controls for their validation and
the indices are compiled for many years and therefore has been acquired experience and know-how to deal with enterprises data
12.1. Relevance - User Needs
The indices meet national needs and the needs of European users. Generally, the indices provide statistical information necessary to improve the competitiveness and performance of the business community. The main national users of the services turnover indices are the government and other public agencies, the Central Bank of Greece and Hellenic banks, scientific community (Academic / Researcher, Student), Press and other Media, Commercial Business, National Confederation of Hellenic Commerce etc. At international level, the Indices are used by Eurostat, International Monetary Fund (IMF), the United Nations (UN), the European Central Bank (ECB), the Organisation for Economic Co-operation and Development (OECD), the International Labour Organization (ILO) etc. The compiled indices cover the wide range of users’ needs: as concerns domestic market, the indices are used as a tool providing useful information on the activities, competitiveness and productivity of the business sector, thus helping the government in drawing economic policy and entrepreneurs or other agencies in decision making concerning their taking up several initiatives. At European level, there is the need for fully comparable statistics in order to draw the European economic policy.
12.2. Relevance - User Satisfaction
user satisfaction survey: ELSTAT conducts an annual user satisfaction survey. The comments on the media are positive. More information about the latest results of user research, for the annual periods per semester, is available in the Library Information Bulletin, on the website of ELSTAT Products and Services
conference of statistical data users: According to its annual statistical program, ELSTAT has been conducting a user conference since 2010 on an annual basis, attended by representatives of private and public sector bodies, as well as educational and research institutions
12.3. Completeness
Data are in full compliance with the relevant European Regulations.
13.1. Accuracy - overall
The accuracy of indices is influenced by: a) sampling errors and b) non-sampling errors. Sampling errors occur due to the fact that for the indices compilation, the whole target population of enterprises is not investigated, but a sample of them is used instead. Non-sampling errors of indices refer mainly to data errors and non-response errors of the sample enterprises. Measurement errors during data collection are identified by quality checks and then they are corrected. Regarding nonresponse errors, every effort is made so as the units that have not responded to provide the requested data.
13.2. Sampling error
The sample errors in the form of a coefficient of variability (CV %), of the monthly change of the indices for September 2024 is shown below. The first table presents the percentage monthly ratio of the coefficient of variation for the General Retail Trade Turnover Index, comparing September 2024 to August 2024.
Retail Trade Turnover Index
Numerator / denominator
Ratio Estimate
Coefficient of Variation
CV %
Current month-SEPT 2024
Previous month-AUG 2024
1.19
0,0066
0,66
Turnover Index in Wholesale Trade & Motor Trade
Division
CV (%)
46
1.21
45
1.81
451
2.53
Trade Volume Indices
The trade volume indices are derived from the turnover indices, using as deflators the Harmonized Index of Consumer Price Index at Constant Tax rates (HICP-CT) for the retail trade, the Producer (PPI) and Import Price Indices (MPI) and the Agriculture Price Indices (API) for the wholesale trade, and also, the selected group indices from CPI and PPI for the motor trade. As for the deflator indices purposal or directional surveies are used (without random sampling of the collected data), it is not possible to calculate their sampling errors. Therefore the sampling errors of the turnover indices provide approximately the degree of accuracy for the volume indices.
13.3. Non-sampling error
Unit non – response
The non-response of the enterprises is addressed by telephone communication, sending a reminder via e-mail and by personal visits, in order to achieve the collection of the requested data. There are also non-response of enterprises, where the procedure for handling the missing data is to evaluate them due to the trend of the administrative data of these enterprises.
Item non - response
Coverage error
No coverage errors are observed in the Business Register of ELSTAT, on the basis of which the survey on the compilation of the indices in trade was designed.
Over-coverage – rate
No over-coverage errors are observed.
Common units – proportion
The same (common) sample of enterprises is used every month for the compilation of the indices.
The sample is revised when the base year changes and remains the same for as long as the base year is the same. Therefore, the percentage of common enterprises in the sample between the months is 100%.
Measurement error
Any measurement errors during the process of data collection are detected by means of quality checks and are duly corrected.
Non response error
The weighted variable used is turnover, where the size-weighed response rate in September 2024, for retail trade is Rrsw=99.009%, for wholesale Rrsw 99.94% and motor trade is Rrsw=99.78%.
Processing error
All tasks engaged to the processing procedure (e.g. weighting, calculations, tabulation etc) are performed by using a special software application, in order to eliminate processing errors.
Model assumption error
No model is used to compile the index.
14.1. Timeliness
The Turnover and Volume indices in Trade are published through an Announcement 60 days after the end of the reference month.
14.2. Punctuality
The Turnover and Volume indices in Trade are published on the pre-announced release dates.
15.1. Comparability - geographical
The Regulation (EU) 2019/2152 of the European Parliament and of the Council on European Business Statistics, as well as Commission Implementing Regulation (EU) 2020/1197 laying down technical specifications and arrangements pursuant to Regulation (EU) 2019/2152 are applied for the compilation of the indices, thus ensuring a good comparability among them and the other national and European statistics, taking always into account any special conditions prevailing in each country, which may dictate minor methodological deviations.
Assymetry for mirror flows statistics – coefficient
There are no mirror flows statistics among EU Member States in Turnover and Volume indices in Trade.
15.2. Comparability - over time
With the implementation of NACE Rev.2, retail trade of fuel in specialty stores “fuels” became part of retail trade. Therefore, in the revision 2005 of the Retail Trade Turnover index with base year 2005=100.0, it was deemed necessary to calculate parallel series for the revised index, with and without the inclusion of fuels. In this way, it is possible to maintain comparability with the previous series of Turnover and Volume Indices in Retail Trade, in which the "fuels" were not included in the retail trade. Therefore, the retrospective calculation and adjustment of the revised series with base year 2021=100.0 that include "fuels", is possible and has been done since January 2000, while for the corresponding series, which do not include "fuels", the adjustment has been made since January 1995.
For the Turnover Index in Wholesale Trade, the first compilation was according to NACE Rev.1 classification (Statistical Classification of Economic Activities in the European Community) and covered the period 2005-2008. During the year 2009 the compilation of the index was according to the new NACE Rev.2 classification and the retrospective quarterly data were avalaible from the 1st quarter of 2000.
For the Turnover Index in Motor Trade sector, the first compilation of the index was also according to NACE Rev.1 classification and covered the period 2005-2008. During the year 2009, the index was recompiled according to the new classification NACE Rev.2. Due to the exclusion of the group “retail sale of automotive fuel” from the motor trades division, the indices were recalculated. Moreover, in compliance with Commission Regulation (EC) 472/2008 concerning backcasting, data were estimated for the years 2000-2004.
The time series of the for Wholesale and Motor trade quarterly indices with base year (b.y.) 2021=100.0, are available from January 2000 onwards, are considered fully comparable over time.
Since January 2021 onwards, the monthly turnover and volume indices for Wholesale and Motor trade are compiled with b.y. 2021=100.0 with retrospective estimated data (not calendar and seasonally adjusted), from January 2015.
15.3. Coherence - cross domain
Coherence – sub annual and annual statistics
Coherence of the index with the structural statistics in the retail trade
According to Regulation (EU) 2019/2152 of the European Parliament and of the Council on European business statistics and by the implementing Regulation (EU) 2020/1197 of the Commission, the structural statistics of the enterprises per kind of activity (KAU) cover, among other sectors in economic activity, also the retail trade sector. As the structural statistics are annual, a comparison is made on the coherence of the rate of change of the average annual index in retail trade with the corresponding rate of the annual turnover of the structural statistics of the enterprise per kind of activity (KAU) in retail trade.
The small differences in the rate of change between the index and the turnover of structural statistics are mainly due to the fact that for the compilation of the index a common enterprises sample is used every month (which is updated when a revision happens, with the change of the base year of the index), while for the compilation of the structural statistics, the enterprises sample changes every year (with the exception of the very large enterprises). The common enterprises sample used by the index ensures accurate recording of the change of the index among different time periods.
Coherence – National Accounts
The indices are used in the calculation of the quarterly and provisional annual data of the Gross Domestic Product (GDP) in trade. Therefore, there is coherence of the rates of change of the indices with the corresponding rates of change of trade in the National Accounts.
Coherence between the Turnover Index for Motor Trades and statistics on the issuing of new road motor vehicle circulation licenses
ELSTAT conducts the monthly survey on the issuing of new motor vehicle circulation licenses. The primary data derive from the corresbponding Ministry of Transports and arise from the issuing of new circulation licences.
Comparisons are performed to examine the coherence of growth rates between the turnover index and the average quarterly statistics on issuing of new circulation licences.
15.4. Coherence - internal
The estimates of the indices in the categories of groups of economic activity, have a high internal coherence,as single databases are used and the calculation of the indices is done by the same method.
For the Turnover in Retail Trade, regarding the staff of ELSTAT, the annual cost in hours worked in 2024 amounts to 8,873 hours. Regarding the respondents, the annual average response burden is 8.9 minutes per enterprise.
For the Turnover Index in Wholesale Trade, regarding the staff of ELSTAT, the annual cost in hours worked amounts to 3,382 hours. Regarding the respondents, the annual average response burden is 11.22 minutes per enterprise.
For the Turnover Index in Motor Trade sector, regarding the staff of ELSTAT, the annual cost in hours worked amounts to 2,804 hours. Regarding the respondents, the annual average response burden is 11.2 minutes per enterprise.
17.1. Data revision - policy
In accordance with the requirements of the Council Regulation (EC) No 2019/2152 on Business Statistics and Commission Implementing Regulation (EU) No 2020/1197, the Trade Turnover Indices, like other short-term statistics indices, revised every five years and specially in years ending in 0 or 5, in the current revision 2021=100.00 due to the impact of the pandemic, the indices were revised with base year 2021. The purpose of these revisions is to adjust the indices to the current developments in the trade structure, where in addition to the change of the base year, both, the survey samples and the reduction factors (weights) of the enterprise per kind of activity (KAU) are updated. Please find here ELSTAT's revision policy.
17.2. Data revision - practice
The indices are published +t 60 days after the end of the reference month t. The data are provisional according to the first announcement. The data are revised firstly and simultaneously with the publication of the next month and secondly and simultaneously with the publication of the third month of the current quarter. After these revisions the data are considered final. The monthly correction is mainly made due to late reporting of some surveyed enterprises
The average revision (MR) and the average absolute revision (MAR) are given below for the Turnover and Volume Indices in Trade. They have been calculated for the calendar adjusted data for the last four years (48 months).
Turnover: MR = 0.029057 and MAR =0.98781
Volume: MR = -0.00737 and MAR =0.93482
18.1. Source data
Retail Trade Turnvover Index
The survey for the compilation of the Retail index covers 32,504 retail trade enterprises with an annual turnover in 2021, equal to or higher than 200,000 euros. From these enterprises a representative random sample of 1,861 enterprises was selected across the country, with data from 72 Regional Units.
The single stratified random sampling method was applied, employing the enterprise per kind of activity unit (KAU) as a surveyed unit. The sampling frame used for the sample design was based on the results of the SBS 2021 and the ELSTAT's BR. Layering criteria are:
11 categories of grouped branches of economic activity
7 size classes of enterprises, based on their annual turnover in year 2021, as follows:
Division 47
Size class Annual Turnover (€)
1st class: 200,000 – 480,000
2nd class: 480,001 – 870,000
3rd class: 870,001 – 1,605,000
4th class: 1,605,001 – 2,220,000
5th class: 3,220,001 – 8,270,000
6th class: 8,270,001 – 26,500,000
7th class: 26,500,001 - and more
In each stratum (class) created by the intersection of the two layering criteria (activity and class), an enterprise sample is selected with equal probabilities and with the application of systematic sampling. The the enterprises that belong to the 6th and 7th size class are surveyed by census.
Wholesale Turnover Index
For the purposes of the survey for the compilation of the wholesale index a representative random sample of 1,423 enterprises is selected and covers 18,247 wholesale trade enterprises. The one stage stratified random sampling method was applied, employing the enterprises per kind of actiivty unit (KAU) as a surveyed unit.
The surveyed enterpise were stratified by their size class on the basis of their annual turnover (in 2021) in BR of ELSTAT as follows:
Division 46
Size class Annual Turnover (€)
1st class: 300,000 - 958,000
2nd class: 958,001 - 2,430,000
3rd class: 2,430,001 - 6,000,000
4th class: 6,000,001 - 12,782,000
5th class: 12,782,001 - 33,850,000
6th class: 3,850,001 - 75,210,000
7th class: 75,210,001 - and more
The sampling units were allocated to the above ultimate strata by appling the optimal (Neyman) allocation. In each stratum, a systematic sample was selected with equal probabilities. In order for each stratum the sample to be representative by class and geography, implicit stratified sampling procedure was applied by using a sorted list (Regional Units within the classes) and then by taking a systematic sample from the sorted list using a fixed sampling interval and a random start. The enterprises that belong to the 8th and 9th size class are surveyed by census.
Turnover Index in Motor Trade
For the purposes of the survey for the compilation of the motor trade index a representative random sample of 674 enterprises is selected and covers 3,944 motor trade enterprises. The one stage stratified random sampling method was applied, employing the enterprises as a surveyed unit. The surveyed enterprises were stratified as follows:
1. By economic activity (groups: 3-digit code activities of NACE Rev.2) as follows: 451, 452, 453+454
2. By size class of enterprises: In each class, the enterprises were stratified by their size class on the basis of their annual turnover (in 2021) in BR of ELSTAT as follows:
Division 45
Size class Annual Turnover (€)
1st class: 200,000 - 883,000
2nd class: 883,001 - 1,670,000
3rd class: 1,670,001 - 2,930,000
4th class: 2,930,001 - 7,030,000
5th class: 7,030,001 - 15,902,000
6th class: 15,902,001 - 60,960,000
7th class: 60,960,001 - and more
The sampling units (enterprises) were selected from the sampling frame based on the results of the SBS 2021 and ELSTAT's BR. The sampling units were allocated to the ultimate strata (that were created by crossing the above stratification criteria) by appling the optimal (Neyman) allocation. In each ultimate stratum, a systematic sample was selected with equal probabilities. In order for each stratum the sample to be representative by class (4-digit code economic activity) and geography, implicit stratified sampling procedure was applied by using a sorted list (Regional Units within the classes) and then by taking a systematic sample from the sorted list using a fixed sampling interval and a random start. The enterprises that belong to the 6th and 7th size class are surveyed by census.
18.2. Frequency of data collection
Data collection is carried out monthly.
18.3. Data collection
Data are collected by specially designed questionnaires (for each division), which sent by email to the enterprises from trained private partners.
Non-response is addressed by telephone or email reminder to the enterprises. Data from administrative sources (the tax authorities) are also taken into account.
18.4. Data validation
Data validation is done by comparing the current values with those of the previous month and of the same month of the previous year. Communication with respondents follows in case of outliers.
18.5. Data compilation
The turnover index is calculated by applying the chaining method. Firstly, the moving based index is calculated by comparing the estimated turnover value for the current month m with the corresponding value of the previous month (moving based index). Afterwards, the fixed-based index for the current month is calculated by multiplying the moving-based index by the fix-based index of the previous month.
1. Value of Turnover
a. Symbolisms
For each branch of economic activity with 4-digit level of NACE Rev.2, stands for:
h : Size class (stratum) of enterprises h=1,2...,7
Nh : Number of enterprises in the size class h (population size)
nh : Number of sample enterprises that responded in the size class h (respondents)
ymhi : Turnover value of current month m, of the enterprises of order i, in the size class h
Ymh : Turnover value of the current month m, of all enterprises that belong to the size class h
that is:
Ym : Turnover value of the current month m, of all enterprises that belong to economic activity class:
that is:
b. Estimation of the turnover value
The estimate of turnover value in current month is based on a reduction in all relevant data from the enterprises sample. This is achieved by multiplying the monthly turnover value of each enterprise, with a suitable reduction factor and then summing up of the products. This factor, for each stratum h (intersection of activity and class of enterprises turnover size) is defined as the quotient of the total number of Nh enterprises , by the number of enterprises of the nh sample, which corresponded.
The reduction factor αh for each enterprise in stratum (class) h is given by the equation:
where
Nh is the total number of enterprises in stratum h
nh is the number of enterprises that responded in stratum h of the sample.
The estimation of the turnover value of the current month m is calculated as follows:
where is the turnover value for the current month m of the ithenterprise in stratum h=1,2,3,…7.
The estimate of the turnover value for each of the above 11 retail categories is obtained by summing the individual estimates of the turnover value of the four-digit classes that make up the category. Finally, the turnover value estimate of more than 11 retail categories (e.g. overall index, food sector index, etc.) is summed up by the individual estimates of the turnover value of the four-digit sectors that constitute the estimated level.
2.Turnover index
The fixed-base index for the current month m is calculated by multiplying the moving-based index by the fixed base index of the previous month m-1.
The above is a consequence of the types:
where,
: moving-base index of the current month m, in relation to the previous month (m-1),
: fixed-base index for the current month, m,
: fixed-base index for the previous month, m-1 and
, : turnover estimates of the current month and of the previous month.
For the back casting of the time series since 2015 (with b.y. 2015=100.0) to b.y. 2021=100.0, a retrospective calculation was made by readjusting the previous series to b.y. 2021=100.0
3.Volume index
The Trade Volume Index is obtained from the Trade Turnover Index if the latter is deflated by the Harmonized Index of Consumer Price Index at Constant Tax rates (HICP-CT) with constant taxes. For retail index the deflators based on HICPI data are compiled for the Overall Index, Overall Index except automotive fuel, food sector, non-food sector except auyomotive fuel and for 9 of the 11 retail categories. It should be noted that no deflators are calculated for the categories: ‘Retail sale of second-hand goods in stores’ and ‘Retail trade not in stores, stalls or markets’, because data on the sale prices of the products of these stores are not collected.
For the wholesale index the deflators based on Producer Price Index (PPI) and Import Price Index (MPI),
For the motor trade index the deflators based on selected group of indices from CPI and PPI.
Imputation – rate
Usually, imputed values are not used to substitute turnover values in the enterprises sample. However, in very few cases, imputed prices are used, the percentage of which does not exceed 0.5%. The procedure for handling missing values is to estimate them (imputed values), based on the turnover of the enterprises in previous years, taking into account the evolution of the rate of changes of the value of turnover in the economic activity sector, the class of size of the enterprise and the trend of the administrative data of the enterprise.
18.6. Adjustment
The Retail Trade index is adjusted to the working days of the months of the year, where are reduced to a typical month by multiplying the estimated turnover values by a specific correction factor according to the number of working days of each month. The typical month of equal duration refers to the actual number of working days.
The correction factor ct is obtained by dividing the average monthly number of working days of the current year by the number of working days of the surveyed month, as follows:
where:
: the average monthly number of working days, of the current year,
: the number of working days in month t.
These weighting coefficient are reviewed annually. For the wholsale and motor trade indices the calendar adjustment provided by the use of JDemetra+ 2.0.0.
Seasonal adjustment
Seasonal adjustment is the procedure followed to remove the impact of seasonality on the timeseries (that is eliminating the monthly effects, e.g: the beginning of the school year, holidays, tourist period, etc) in order to improve the comparability over time. The seasonal adjustment is performed with the application of TRAMO-SEATS method with the use of JDemetra+ 2.0.0. The whole series with seasonally adjusted indices is recalculated every time a new observation is added into the timeseries.
The Retail Trade Turnover Index refers to the whole country. The General Index is composed of the separate indices for the eleven (11) categories of aggregated economic activity classes. These categories result from the aggregation of the relevant economic activity classes (NACE Rev. 2 codes: 4711-4799).
The eleven (11) categories of aggregated economic activity classes of the Retail Trade Turnover and Volume Indices are the following:
Supermarkets
Department stores
Food, beverages and tobacco
Automotive fuel-lubricants
Pharmaceuticals and cosmetics[1]
Clothing and footwear[2]
Furniture, electrical goods, household goods[3]
Books, stationery and other articles[4]
Retail sale via mail order houses or via Internet
Retail sale of second-hand goods in stores
Retail trade not in stores, stalls or markets
The breakdown of the Retail Trade Volume Index is similar, the difference being that for the last three categories, it is not calculated the Volume Index.
The Turnover Index in Wholesale Trade (div.46) includes the activities classified under Division 46 (Wholesale trade, except of motor vehicles and motorcycles) of NACE Rev.2 classification.
Division 46 (Wholesale trade) includes the following activities:
Wholesale on a fee or contract basis
Wholesale of agricultural raw materials and live animals
Wholesale of food, beverages and tobacco
Wholesale of household goods
Wholesale of information and communication equipment
Wholesale of other machinery, equipment and supplies
Other specialized wholesale
Non-specialized wholesale trade
The Turnover Index for Motor Trade (div.45) includes the activities classified under Division 45 (Wholesale and retail trade and repair of motor vehicles and motorcycles) of NACE Rev.2 classification.
More specifically, Division 45 includes the following groups:
451 Sale of motor vehicles
452 Maintenance and repair of motor vehicles
453 Sale of motor vehicle parts and accessories
454 Sale, maintenance and repair of motorcycles and related parts and accessories.
Turnover Index for Motor Trade is compiled for the Division (two-digit code) 45 and Group (three-digit code) 451 of the NACE Rev.2 classification.
[1] Dispensing chemist, medical and orthopaedic goods, cosmetic and toilet articles in specialised stores.
[2] Textiles, clothing, footwear and leather goods in specialised stores.
[3]Furniture, lighting equipment, audio and video equipment, hardware, paints and glass, electrical household appliances and other household articles, music and video recordings in specialised stores.
[4]Books, newspapers and stationery, computers, peripheral units and software, telecommunications equipment, carpets, rugs, wall and floor coverings, sporting equipment, games and toys, flowers, plants, seeds, fertilisers, pet animals and pet food, watches and jewellery, other retail sale of new goods in specialised stores.
12 June 2025
The aim of the indices is to measure in value terms the activity of Wholesale and retail trade and repair of motor vehicles and motorcycles in the market. Turnover excludes VAT and comprises the totals invoiced by the enterprise during the reference period (month), which correspond to sales of goods or services supplied to third parties.
The definitions used, in accordance with Commission Regulation (EC) No 1503/2006 defining variables and frequency of data compilation, repealing new orders received for building construction and new orders received for civil engineering are as follows:
turnover comprises the totals invoiced by the enterprise per Kind of Activity Unit (KAU) during the reference period, and this corresponds to market sales of goods and services supplied to third parties
turnover includes all duties and taxes on the services invoiced by the enterprise per Kind of Activity unit (KAU), with the exception of the VAT passed on by the enterprise to its customers. It also includes all other charges (transport, packaging, etc.) passed on to the customer, even if these charges are listed separately in the invoice
More specifically, the items generally included in turnover are the following:
sales of manufactured products
sales of products manufactured by subcontractors
sales of goods purchased for resale in the same condition as received
sales of by-products
invoiced charges for packaging and transport
hours worked invoiced to third parties for labour-only subcontracting
invoiced mounting, installations and repairs
invoiced installments (stage payments)
sales of waste and scrap materials
Price reductions, rebates and bonuses conceded later to clients, for example at the end of the year, are not taken into account. Income classified as other operating income, financial income and extraordinary income in company accounts are excluded from turnover. Any operating subsidies received are also excluded.
The deflators for retail index were calculated by Harmonized Consumer Price Index at Constant Tax rates (HICP-CT). Therefore, there is a complete coherence of these deflators in consumption with the domestic turnover of retail sales.
The sales volume represents the turnover value at constant prices and is a quantitative index. It can be calculated as the turnover at current prices, deflated by applying the sales deflator or as a quantitative index derived directly from the quantity of goods sold (for div. 45 and 46).
The reporting unit is the enterprise per Kind of Activity unit (KAU).
For the Turnover Index in Retail Trade (div.47) the population encompasses 32,504 enterprises from Structual Business Statistics (SBS) 2021 and the Business Register (BR) of ELSTAT, with annual turnover in year 2021 equal to or higher than 200,000 €.
For the Turnover Index in Wholesale Trade (div. 46), the population encompasses 18,247 enterprises from SBS 2021 and the BR of ELSTAT with annual turnover in year 2021 equal to or higher than 300,000 €.
For the Turnover Index for Motor Trades (div. 45), the population encompasses 3,944 enterprises from the SBS 2021 and the BR of ELSTAT with annual turnover in year 2021 equal to or higher than 200,000 €.
Geographical level of the data is the whole country.
Month.
The accuracy of indices is influenced by: a) sampling errors and b) non-sampling errors. Sampling errors occur due to the fact that for the indices compilation, the whole target population of enterprises is not investigated, but a sample of them is used instead. Non-sampling errors of indices refer mainly to data errors and non-response errors of the sample enterprises. Measurement errors during data collection are identified by quality checks and then they are corrected. Regarding nonresponse errors, every effort is made so as the units that have not responded to provide the requested data.
Indices, percentage (%) change of rates (monthly and annually).
The turnover index is calculated by applying the chaining method. Firstly, the moving based index is calculated by comparing the estimated turnover value for the current month m with the corresponding value of the previous month (moving based index). Afterwards, the fixed-based index for the current month is calculated by multiplying the moving-based index by the fix-based index of the previous month.
1. Value of Turnover
a. Symbolisms
For each branch of economic activity with 4-digit level of NACE Rev.2, stands for:
h : Size class (stratum) of enterprises h=1,2...,7
Nh : Number of enterprises in the size class h (population size)
nh : Number of sample enterprises that responded in the size class h (respondents)
ymhi : Turnover value of current month m, of the enterprises of order i, in the size class h
Ymh : Turnover value of the current month m, of all enterprises that belong to the size class h
that is:
Ym : Turnover value of the current month m, of all enterprises that belong to economic activity class:
that is:
b. Estimation of the turnover value
The estimate of turnover value in current month is based on a reduction in all relevant data from the enterprises sample. This is achieved by multiplying the monthly turnover value of each enterprise, with a suitable reduction factor and then summing up of the products. This factor, for each stratum h (intersection of activity and class of enterprises turnover size) is defined as the quotient of the total number of Nh enterprises , by the number of enterprises of the nh sample, which corresponded.
The reduction factor αh for each enterprise in stratum (class) h is given by the equation:
where
Nh is the total number of enterprises in stratum h
nh is the number of enterprises that responded in stratum h of the sample.
The estimation of the turnover value of the current month m is calculated as follows:
where is the turnover value for the current month m of the ithenterprise in stratum h=1,2,3,…7.
The estimate of the turnover value for each of the above 11 retail categories is obtained by summing the individual estimates of the turnover value of the four-digit classes that make up the category. Finally, the turnover value estimate of more than 11 retail categories (e.g. overall index, food sector index, etc.) is summed up by the individual estimates of the turnover value of the four-digit sectors that constitute the estimated level.
2.Turnover index
The fixed-base index for the current month m is calculated by multiplying the moving-based index by the fixed base index of the previous month m-1.
The above is a consequence of the types:
where,
: moving-base index of the current month m, in relation to the previous month (m-1),
: fixed-base index for the current month, m,
: fixed-base index for the previous month, m-1 and
, : turnover estimates of the current month and of the previous month.
For the back casting of the time series since 2015 (with b.y. 2015=100.0) to b.y. 2021=100.0, a retrospective calculation was made by readjusting the previous series to b.y. 2021=100.0
3.Volume index
The Trade Volume Index is obtained from the Trade Turnover Index if the latter is deflated by the Harmonized Index of Consumer Price Index at Constant Tax rates (HICP-CT) with constant taxes. For retail index the deflators based on HICPI data are compiled for the Overall Index, Overall Index except automotive fuel, food sector, non-food sector except auyomotive fuel and for 9 of the 11 retail categories. It should be noted that no deflators are calculated for the categories: ‘Retail sale of second-hand goods in stores’ and ‘Retail trade not in stores, stalls or markets’, because data on the sale prices of the products of these stores are not collected.
For the wholesale index the deflators based on Producer Price Index (PPI) and Import Price Index (MPI),
For the motor trade index the deflators based on selected group of indices from CPI and PPI.
Imputation – rate
Usually, imputed values are not used to substitute turnover values in the enterprises sample. However, in very few cases, imputed prices are used, the percentage of which does not exceed 0.5%. The procedure for handling missing values is to estimate them (imputed values), based on the turnover of the enterprises in previous years, taking into account the evolution of the rate of changes of the value of turnover in the economic activity sector, the class of size of the enterprise and the trend of the administrative data of the enterprise.
Retail Trade Turnvover Index
The survey for the compilation of the Retail index covers 32,504 retail trade enterprises with an annual turnover in 2021, equal to or higher than 200,000 euros. From these enterprises a representative random sample of 1,861 enterprises was selected across the country, with data from 72 Regional Units.
The single stratified random sampling method was applied, employing the enterprise per kind of activity unit (KAU) as a surveyed unit. The sampling frame used for the sample design was based on the results of the SBS 2021 and the ELSTAT's BR. Layering criteria are:
11 categories of grouped branches of economic activity
7 size classes of enterprises, based on their annual turnover in year 2021, as follows:
Division 47
Size class Annual Turnover (€)
1st class: 200,000 – 480,000
2nd class: 480,001 – 870,000
3rd class: 870,001 – 1,605,000
4th class: 1,605,001 – 2,220,000
5th class: 3,220,001 – 8,270,000
6th class: 8,270,001 – 26,500,000
7th class: 26,500,001 - and more
In each stratum (class) created by the intersection of the two layering criteria (activity and class), an enterprise sample is selected with equal probabilities and with the application of systematic sampling. The the enterprises that belong to the 6th and 7th size class are surveyed by census.
Wholesale Turnover Index
For the purposes of the survey for the compilation of the wholesale index a representative random sample of 1,423 enterprises is selected and covers 18,247 wholesale trade enterprises. The one stage stratified random sampling method was applied, employing the enterprises per kind of actiivty unit (KAU) as a surveyed unit.
The surveyed enterpise were stratified by their size class on the basis of their annual turnover (in 2021) in BR of ELSTAT as follows:
Division 46
Size class Annual Turnover (€)
1st class: 300,000 - 958,000
2nd class: 958,001 - 2,430,000
3rd class: 2,430,001 - 6,000,000
4th class: 6,000,001 - 12,782,000
5th class: 12,782,001 - 33,850,000
6th class: 3,850,001 - 75,210,000
7th class: 75,210,001 - and more
The sampling units were allocated to the above ultimate strata by appling the optimal (Neyman) allocation. In each stratum, a systematic sample was selected with equal probabilities. In order for each stratum the sample to be representative by class and geography, implicit stratified sampling procedure was applied by using a sorted list (Regional Units within the classes) and then by taking a systematic sample from the sorted list using a fixed sampling interval and a random start. The enterprises that belong to the 8th and 9th size class are surveyed by census.
Turnover Index in Motor Trade
For the purposes of the survey for the compilation of the motor trade index a representative random sample of 674 enterprises is selected and covers 3,944 motor trade enterprises. The one stage stratified random sampling method was applied, employing the enterprises as a surveyed unit. The surveyed enterprises were stratified as follows:
1. By economic activity (groups: 3-digit code activities of NACE Rev.2) as follows: 451, 452, 453+454
2. By size class of enterprises: In each class, the enterprises were stratified by their size class on the basis of their annual turnover (in 2021) in BR of ELSTAT as follows:
Division 45
Size class Annual Turnover (€)
1st class: 200,000 - 883,000
2nd class: 883,001 - 1,670,000
3rd class: 1,670,001 - 2,930,000
4th class: 2,930,001 - 7,030,000
5th class: 7,030,001 - 15,902,000
6th class: 15,902,001 - 60,960,000
7th class: 60,960,001 - and more
The sampling units (enterprises) were selected from the sampling frame based on the results of the SBS 2021 and ELSTAT's BR. The sampling units were allocated to the ultimate strata (that were created by crossing the above stratification criteria) by appling the optimal (Neyman) allocation. In each ultimate stratum, a systematic sample was selected with equal probabilities. In order for each stratum the sample to be representative by class (4-digit code economic activity) and geography, implicit stratified sampling procedure was applied by using a sorted list (Regional Units within the classes) and then by taking a systematic sample from the sorted list using a fixed sampling interval and a random start. The enterprises that belong to the 6th and 7th size class are surveyed by census.
The indices are disseminated monthly.
The Turnover and Volume indices in Trade are published through an Announcement 60 days after the end of the reference month.
The Regulation (EU) 2019/2152 of the European Parliament and of the Council on European Business Statistics, as well as Commission Implementing Regulation (EU) 2020/1197 laying down technical specifications and arrangements pursuant to Regulation (EU) 2019/2152 are applied for the compilation of the indices, thus ensuring a good comparability among them and the other national and European statistics, taking always into account any special conditions prevailing in each country, which may dictate minor methodological deviations.
Assymetry for mirror flows statistics – coefficient
There are no mirror flows statistics among EU Member States in Turnover and Volume indices in Trade.
With the implementation of NACE Rev.2, retail trade of fuel in specialty stores “fuels” became part of retail trade. Therefore, in the revision 2005 of the Retail Trade Turnover index with base year 2005=100.0, it was deemed necessary to calculate parallel series for the revised index, with and without the inclusion of fuels. In this way, it is possible to maintain comparability with the previous series of Turnover and Volume Indices in Retail Trade, in which the "fuels" were not included in the retail trade. Therefore, the retrospective calculation and adjustment of the revised series with base year 2021=100.0 that include "fuels", is possible and has been done since January 2000, while for the corresponding series, which do not include "fuels", the adjustment has been made since January 1995.
For the Turnover Index in Wholesale Trade, the first compilation was according to NACE Rev.1 classification (Statistical Classification of Economic Activities in the European Community) and covered the period 2005-2008. During the year 2009 the compilation of the index was according to the new NACE Rev.2 classification and the retrospective quarterly data were avalaible from the 1st quarter of 2000.
For the Turnover Index in Motor Trade sector, the first compilation of the index was also according to NACE Rev.1 classification and covered the period 2005-2008. During the year 2009, the index was recompiled according to the new classification NACE Rev.2. Due to the exclusion of the group “retail sale of automotive fuel” from the motor trades division, the indices were recalculated. Moreover, in compliance with Commission Regulation (EC) 472/2008 concerning backcasting, data were estimated for the years 2000-2004.
The time series of the for Wholesale and Motor trade quarterly indices with base year (b.y.) 2021=100.0, are available from January 2000 onwards, are considered fully comparable over time.
Since January 2021 onwards, the monthly turnover and volume indices for Wholesale and Motor trade are compiled with b.y. 2021=100.0 with retrospective estimated data (not calendar and seasonally adjusted), from January 2015.


 : the average monthly number of working days, of the current year,
 : the number of working days in month t.
 of the previous month (moving based index). Afterwards, the fixed-based index for the current month is calculated by multiplying the moving-based index by the fix-based index of the previous month.


 of the current month m is calculated as follows:
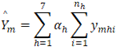
 is the turnover value for the current month m of the ith enterprise in stratum h=1,2,3,…7.
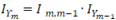

 : moving-base index of the current month m, in relation to the previous month (m-1),
 : fixed-base index for the current month, m,
 : fixed-base index for the previous month, m-1 and
 ,
,  : turnover estimates of the current month and of the previous month.