|
 |
| For any question on data and metadata, please contact: Eurostat user support |
|
|||
| 1.1. Contact organisation | NATIONAL STATISTICS INSTITUTE - INE Spain |
||
| 1.2. Contact organisation unit | Deputy Directorate for Industrial and Services Statistics |
||
| 1.5. Contact mail address | Avenida de Manoteras, 50-52 28050 Madrid (Spain) |
||
|
|||
| 2.1. Metadata last certified | 15/04/2021 | ||
| 2.2. Metadata last posted | 15/04/2021 | ||
| 2.3. Metadata last update | 15/04/2021 | ||
|
|||
| 3.1. Data description | |||
The main purpose of the employment rate in the Retail Trade Indices (RTI) is to provide information about the number of persons employed in enterprises dedicated to retail trade in Spain. This allows measuring the evolution of the activity in the sector in the short term. This statistical operation fulfils Council Regulation (EC) No 1165/98 of 19 May 1998 concerning short-term statistics amended by Regulation (EC) No 1158/2005 of the European Parliament and of the Council of 6 July 2005. These Regulations aim to establish a common framework for the production of short-term Community statistics on the business cycle necessary for the analysis of the short-term evolution of supply and demand, production factors and prices. It is a statistic with direct data collection. Results are presented as indices to measure variations taking as reference the base year 2015. This operation began to be carried out in the year 1995, however some series began in the year 2000. In January 2013, coinciding with the base change from 2005 to 2010, the formulation used was modified from direct Laspeyres-type indices with fixed base year 2005 to chainlinked Laspeyres indices with base year 2010 (monthly chain-linking during the last month of December). |
|||
| 3.2. Classification system | |||
Indices of Retail Trade in base 2015 are published following the Statistical Classification of Economic Activities in the European Community (NACE Rev.2). |
|||
| 3.3. Coverage - sector | |||
The current index covers Division 47 of NACE Rev.2. |
|||
| 3.4. Statistical concepts and definitions | |||
Enterprise classification variables Economic activity The economic activity carried out by a enterprise is defined as the creation of added value by means of the production of goods and services. Each one of the statistical units studied (enterprises) frequently carries out several activities that should be classified in separate categories of the National Classification of the Statistical Classification of Economic Activities in the European Community (NACE Rev.2). In general, the activities carried out by an economic unit may be of three types: main, secondary and auxiliary activities. The main activity differs from secondary activities because it generates the greatest added value and auxiliary activities are those that generate services that are not sold on the market and only serve the unit they depend on (administration departments, transport or storage services). Due to the difficulties faced by enterprises in calculating added value when various activities are carried out, the activity which generates the greatest volume of business is considered the main activity or, failing that, that which employs the greatest number of persons. Although statistical units are classified according to their main activity, the information that is requested from the informant units refers not only to the main activity under consideration, but also to all the secondary and auxiliary activities which are carried out.
Enterprise size The size of enterprises is one of the most important variables when it comes to classifying enterprises. This size may be established in terms of the magnitude of turnover or production value, or by considering the number of persons on the enterprise staff. In RTI, this latter option is chosen to determine the size of the enterprises.
Variables studied Number of persons employed The number of persons employed is defined in Commisssion Regulation (EC) No 1503/2006. The number of persons employed is defined as the total number of persons who work in the observation unit (inclusive of working proprietors, partners working regularly in the unit and unpaid family workers), as well as persons who work outside the unit who belong to it and are paid by it (e.g. sales representatives, delivery personnel, repair and maintenance teams). It includes persons absent for a short period (e.g. sick leave, paid leave or special leave), and also those on strike, but not those absent for an indefinite period. It also includes part-time workers who are regarded as such under the laws of the country concerned and who are on the payroll, as well as seasonal workers, apprentices and home workers on the payroll. The number of persons employed excludes manpower supplied to the unit by other enterprises, persons carrying out repair and maintenance work in the observation unit on behalf of other enterprises, as well as those on compulsory military service. Unpaid family workers refers to persons who live with the proprietor of the unit and work regularly for the unit, but do not have a contract of service and do not receive a fixed sum for the work they perform. This is limited to those persons who are not included on the payroll of another unit as their principal occupation. |
|||
| 3.5. Statistical unit | |||
The Council Regulation No 1165/98 of 19 May 1998 concerning short-term statistics, amended by the Regulation No 1158/2005 of 6 July 2005 concerning short-term statistics requires the use of enterprises as observation units for indicators in retail trade. In RTI survey, enterprises which carry out any of the activities included within Division 47 of NACE Rev. 2 as their main economic activity, are used as statistical units. The enterprise is also the informant unit. |
|||
| 3.6. Statistical population | |||
The statistical population comprises the observation units (enterprises) whose main activity is registered in Division 47 of Section G of the National Classification of Economic Activities (CNAE-2009): 47. Retail trade, except of motor vehicles and motorcycles. The frame used to identify the units is the Central Business Register (CBR). According to the CBR in year 2020 there were about 436,000 enterprises in the Spanish territory whose main activity belongs to division 47. |
|||
| 3.7. Reference area | |||
The geographical coverage of RTI is the whole Spanish territory so the Autonomous Cities of Ceuta and Melilla are included. Employment of the units located outside the Spanish territory are not included in the aggregates. |
|||
| 3.8. Coverage - Time | |||
The base year of the index is 2015. The index previously had 1994, 2001, 2005 and 2010 as base years. The index corresponding to reference month January 2018 was the first to be published in base 2015. For the index G47_X_G473 the serie begins in 1995. For the index G47 the serie begins in 2000. |
|||
| 3.9. Base period | |||
Council Regulation No 1165/98 of 19 May 1998 concerning short-term statistics, amended by Regulation No 1158/2005 of 6 July 2005 which concerns short-term statistics, establishes that, every five years, Member States shall rebase the indices using as base years the years ending with a 0 or a 5 and that all indices must be rebased on the new base year within three years after the end of each new base year. For this reason in 2020 the data will be disseminated in base 2015. For this base we have:
The base and reference year are the same at national level and for the data transmitted to Eurostat. |
|||
|
|||
Indices and percentage changes (on previous period or compared to the same period in previous year). |
|||
|
|||
The reference period is the last day of the month. |
|||
|
|||
| 6.1. Institutional Mandate - legal acts and other agreements | |||
The legal basis for the STS indicators is Council Regulation No 1165/98 of 19 May 1998 concerning short-term statistics, amended by Regulation No 1158/2005 of 6 July 2005 concerning short-term statistics and by Regulation (EC) No 1893/2006 of 20 December 2006 establishing the statistical classification of economic activities NACE Revision 2. The definitions of short-term statistics variables are laid down in Commission Regulation No 1503/2006 of 28 September 2006 which implements and amends Council Regulation No 1165/98 of 19 May 1998 that concerns short-term statistics as regards the definition of variables. According to the Spanish legislation, 'Retail Trade Indices' is a compulsory statistic. The compilation and dissemination of data are governed by the Statistical Law No 12/1989 "Public Statistical Function" of May 9, 1989, and Law No 4/1990 of June 29 on "National Budget of State for the year 1990" amended by Law No 13/1996 "Fiscal, administrative and social measures" of December 30, 1996, makes compulsory all statistics included in the National Statistics Plan. The Plan contains the statistics that must be developed in the four year period by the State General Administration's services or any other entity dependent on it. All statistics included in the National Statistics Plan are statistics for state purposes and are obligatory. The National Statistics Plan 2017-2020, approved by Royal Decree 410/2016, of October 31st, is the Plan currently implemented. This statistical operation has governmental purposes, and it is included in the National Statistics Plan 2017-2020, which is available in the following link: https://www.ine.es/ss/Satellite?L=en_GB&c=INEPlanEst_C&p=1254735995577&pagename=INE%2FINELayout&cid=1259945808649 |
|||
| 6.2. Institutional Mandate - data sharing | |||
The exchanges of information between the INE and the rest of the State statistical offices (Ministerial Departments, independent bodies and administrative bodies depending on the State General Administration), or between these offices and the Autonomous Communities Statistical Offices, are regulated in the Statistical Law No 12/1989 "Public Statistical Function". This law also regulates the mechanisms of statistical coordination, and concludes cooperation agreements between the different offices when necessary. Through the collaboration agreements signed with regional statistical institutes, monthly information exchange is done meeting the requirements established to preserve statistical confidentiality. |
|||
|
|||
| 7.1. Confidentiality - policy | |||
RTI is a statistical operation included in the National Statistics Plan 2017-2020, therefore, it is subject to Statistics Law No 12/1989 "Public Statistical Function" and, consequently, data is protected by the principle of statistical confidentiality in all the storages of production. Regulation (EC) No 223/2009 of the European Parliament and of the Council on European statistics stipulates the need to establish a guideline and common principles to ensure confidentiality of data used during the production of European statistics and also when accessing the confidential data. INE Spain Confidentiality Policy can be found in the following link: http://www.ine.es/en/ine/codigobp/politica_confidencialidad_en.pdf |
|||
| 7.2. Confidentiality - data treatment | |||
INE Spain takes the necessary logical, physical and administrative provisions to protect confidential data, from data collection to dissemination. Questionnaires of the survey include a legal clause related to protection and preservation of data collected. In the case of this survey, only aggregate information is disseminated. Besides data are only published down to an activity level at which they are not confidential and no confidential data can be obtained. |
|||
|
|||
| 8.1. Release calendar | |||
The advanced release calendar is published in the last quarter of each year and shows the exact dates of the publication of the STS. |
|||
| 8.2. Release calendar access | |||
The release calendar is disseminated on the INE website. |
|||
| 8.3. Release policy - user access | |||
All users have access to the data since 9 am on the press release day. The data are disseminated at INE Spain website (http://www.ine.es/dyngs/INEbase/en/operacion.htm?c=Estadistica_C&cid=1254736176900&menu=ultiDatos&idp=1254735576799). Users are informed that the data are being released via Twitter and also at INE Spain website "News flash" section. In accordance with the European Statistics Code of Practice, all users have access to the same statistical information at the same time, and any privileged pre-release access to any outside user must be limited, controlled and made public. In this sense, a few hours before its official publication, some statistical information of the INE is transmitted, under embargo, to the appointed body, the Secretariat of State for Economic Affairs and Business Support of the Ministry of Economic Affairs and Digital Transformation, for the purpose of providing sufficient time for their responsible parties to prepare answers to any possible questions that journalists might ask them. The release policy doesn't determine the time at which data are disseminated. The dissemination policy is available in the following link: http://www.ine.es/en/ine/codigobp/politica_difusion_en.pdf The same release policy is applied to national releases and to transmissions to Eurostat. Main aggregates are transmitted to EUROSTAT several days before the national release and all indexes at the moment of the national release. Data are transmitted in SDMX-ML format. |
|||
|
|||
Monthly. |
|||
|
|||
| 10.1. Dissemination format - News release | |||
The press releases are available on-line |
|||
| 10.2. Dissemination format - Publications | |||
All information related to this indicator is posted on the INE website. Here you can find the following publications: - Press Release, highlighting the components that influence the evolution of the indicator in the reference month, both with regard to sales and occupation. - Table Annex containing the tables attached to the Press Release. - Methodology where it can be consulted the Standardised Methodological Report of INE Spain, the file of the Inventory Statistical Operation and the methodology of Retail Trade Indices which highlight in greater detail the methodological characteristics of the indicator. - Related links where information about previous bases can be consulted. All these publications are available at the following link: http://www.ine.es/dyngs/INEbase/en/operacion.htm?c=Estadistica_C&cid=1254736176900&menu=ultiDatos&idp=1254735576799 |
|||
| 10.3. Dissemination format - online database | |||
INEbase is the system used to store and disseminate through the INE Web all statistical information. It contains all the information produced by the INE in electronic format. It is organized basically following the thematic classification of the Inventory of Statistical Operations of the General State Administration. The basic unit is the statistical operation, defined as the set of activities that lead to the collection of statistics for a particular sector or theme, from data collected individually. The results of the survey are available from 1995 to the present. National dissemination shows indices as well as the different rates of change in employment for different levels of disaggregation, by region and by distribution class. Index are available on the following link. The weighting structure used in the index calculation is available on the following link. In 2020 the total number of accesses to Retail Trade Indices website was AC1 = 166,751 and the total number of accesses to Retail Trade Indices metadata was AC2= 2,330. |
|||
| 10.4. Dissemination format - microdata access | |||
Microdata are not published but, they are given only to Regional Statistical Institutes with which there is a signed collaboration agreement for the transfer of such information under the Framework Agreement for cooperation between INE and Headquarters Statistics of the Autonomous Communities (OCECAS). |
|||
| 10.5. Dissemination format - other | |||
It is possible to request information to the user service area of the INE, which takes into account, when processing such requests, limitations on confidentiality or precision. Our data are sent to Eurostat, either to be used in european aggregates or to be released also as national data. |
|||
| 10.6. Documentation on methodology | |||
The documentation on the methodology is available at http://www.ine.es/en/daco/daco43/notaccm15_en.pdf. The metadata completeness rate is AC3=100% |
|||
| 10.7. Quality management - documentation | |||
The statistics are prepared in accordance with EU guidelines in order to meet the Code of Practice implemented by Eurostat following the quality criteria on relevance, accuracy and reliability, timeliness and punctuality, coherence and comparability and accessibility and clarity . Fields from 11 to 18 of this document are the user-oriented quality report of this statistical operation. |
|||
|
|||
| 11.1. Quality assurance | |||
The quality assurance framework for INE statistics is based on the ESCOP, the Code of Good Practice of the European Statistics Eurostat. The ESCOP consists on 15 principles, grouped into three areas: Institutional Environment, Statistical Processes and Statistical Output. Each principle is associated with a number of indicators to measure. To value quality different tools provided by Eurostat are used: the indicators mentioned above, the autoevaluation (DESAP), the review for counterparts (Peer Review), the audits of quality and user satisfaction surveys. The RTI production process is designed to ensure the quality of the information used as well as the results obtained from the same. To do this, at all stages of the process various quality controls are designed and detection of invalid values, non-response estimation, supervision and inspection of field work, and other permanent controls on the flow of information are carried out. This statistical operation is carried out under Regulation 1165/98 of the Council of 19 May 1998 concerning short-term statistics and follow the community guidelines, meeting the Code of Practice and taking the necessary measures so that the indicator meets all requirements published in required quality. |
|||
| 11.2. Quality management - assessment | |||
The RTI is a high quality product. Its sample size allows to offer information up to regional level within reasonable sampling errors, the harmonized methodology used allows to offer international comparisons with a high level of solvency and gives a valuable measure of the retail sector than no other statistical source provides with the same level of detail with monthly frequency. As for the limitations of the survey should be noted the inherent sampling statistical operations such as no response and the sampling errors or variation coefficients of the estimates. In both cases are kept within reasonable limits. Also, met the quality criteria listed in Article 12, paragraph 1 of Regulation (EC) No 223/2009 of the European Parliament and of the Council, namely: relevance, accuracy, timeliness, punctuality, accessibility, clarity, comparability and consistency. |
|||
|
|||
| 12.1. Relevance - User Needs | |||
The RTI covers statistical information needs of different user groups: |
|||
| 12.2. Relevance - User Satisfaction | |||
To provide guidance about the opinion that users have on Retail Trade Indices (RTI), surveys of user satisfaction carried out by INE Spain can be used. These user satisfaction surveys value, among others, the services sector. These surveys are carried out every three years since 2007. The general rate achieved by the services sector in 2019 satisfaction survey was 3.80 out of 5. The national user surveys' results is available in the link: http://www.ine.es/ss/Satellite?c=Page&cid=1259944133654&pagename=MetodologiaYEstandares%2FINELayout&L=1 Moreover, people in charge of the survey stay in contact with the main users and respondents in order to attend any specific needs of information. |
|||
| 12.3. Completeness | |||
Retail Trade Indices provide all the information required by national and international regulations related to this statistical operation, so the rate of available statistics is R1=100%. |
|||
|
|||
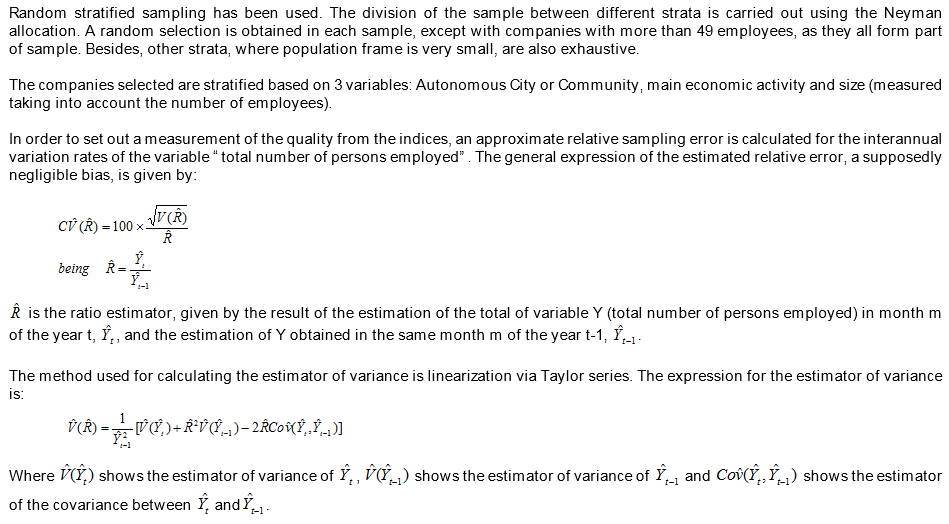
| 13.1. Accuracy - overall | |||
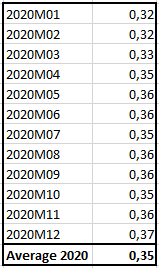
The sample design attempts to minimize sampling errors. Also, errors are reduced as far as possible during the process survey: in data collection (monitoring and control response rate of editing) and later in non response imputation phase and calculation of aggregate indices. This allows a high degree of reliability of the statistical operation. Random stratified sampling has been used. In order to set out a measurement of the quality from the indices, an approximate relative sampling error is calculated for the interannual variation rates. CV for Empl_47 annual error average 2020: 0.35% Non sampling errors are small too, over-coverage, multiple listings, non-response, imputation can be considerated minor. Our data are final after three periods from first release and the different between first and last release is small. |
|||
| 13.2. Sampling error | |||
Coefficient of variance for employment in G47 (%)
|
|||
| 13.3. Non-sampling error | |||
Impact of over-coverage and multiple listings of the frame We have studied impact of over-coverage and multiple listings of the frame through new units are selected to enter our sample. Every year, in September we select units for annual renovations, 20-25% of sampling units are rotated in non-exhaustive strata, and we select companies which belong to exhaustive strata. In the month of January each year, part of the sample is renovated These results have been calculated with new units selected in September 2020: Over-coverage
Multiple listings
% Impact of multiple listings: 0.06% Under-coverage We don’t have information about it.
Impact of survey instrument, respondent and interviewer Our survey use simple questionnaires where it appears a contact person who could resolve any doubts about it. These contact persons work in INE during a long time and they are prepared to answer any questions. Besides, most of the questionnaires are collected via web. We use selective editing in web questionnaires, for it most of them have passed several editing controls and respondents should correct them or give us an explanation about their data. When we received all data, these are revised using selective editing too. If an important error is detected we recontact with respondent again and we correct it.
Impact of unit and non-response item In 2020, we have 12,005 units in our sample. In it, we have an average rate of non-response small. Average rate, A4. Year 2020: 16.76% in first release Average rate, A4. Year 2020: 7.94% in last release
Impact of data editing, coding and imputation Data editing: a first editing phase, at micro-data level takes place when the respondent fills in the e-questionnaire, we use selective editing in them. Data from others respondent way (paper, telephone, fax) are editing by selective editing too when they are recorded. During the data collection another micro-data level editing phase occurs including all data collection methods questionnaires. After that the selective editing is carried out. Finally the macro-data editing phase takes place. Imputation: monthly and annual rates of units filling in the questionnaire in each elementary aggregates are imputed to those units of the same elementary aggregate that did not answer in the reference period. Elementary aggregates are the most detailed levels for which indices are calculated. % data editing, coding and imputation (October 2020):
Our questionnaire could be found in Annex of this document. |
|||
|
|||
| 14.1. Timeliness | |||
The RTI is disseminated the last week of the month following the reference, which meets the deadlines set by Eurostat. |
|||
| 14.2. Punctuality | |||
The employment RTI is published in accordance with the calendar set by INE at the end of each year. |
|||
|
|||
| 15.1. Comparability - geographical | |||
The survey is designed homogeneously throughout the geographic area in terms of its methodology, design, the process of collecting information and data editing. Moreover, the European cross-country comparability is ensured by Regulation 1165/98 of the Council of 19 May 1998 concerning short-term statistics, which gives the statistical homogeneity with other European Union countries that broadcast this same information. |
|||
| 15.2. Comparability - over time | |||
The RTI was first published in 1995. Due to the base changes made since then (base 2001, base 2005, base 2010 and base 2015) some methodological aspects of the survey have been modified, which has led to breaks in the series, which have been suitably treated to provide a linked series from the first year publication of the survey to date. Comparable data for the EMPL:G47 |
|||
| 15.3. Coherence - cross domain | |||
In the data validation we take into account data of other statistics to ensure consistency among them, we can mention the following: Structural Business Statistics: Services Sector (SBS) of INE SBS and STS use the same population framework. Our sampling frame is the Statistical Business Register. The sampling design is also quite similar. Both apply stratified sampling with optimum sample allocation. Strata are formed using the following variables: Main economic activity, number of employees and region (NUTS2). In SBS, businesses with 50 or more employees belong to take-all stratum. In STS, for retail trade, the take-all stratum is similar to SBS and for the rest of services, businesses with 200 or more employees belong to take-all stratum. Both uses Horvitz-Thompson estimators but there are some differences in the estimation process. SBS estimators are adjusted by stratum changes and the total population, N, is estimated using their own data. In STS, N comes from updated sampling frame. Besides, SBS is designed to obtain the level of employment and STS is designed to study increasing or decreasing of employment. Labour Force Survey of INE Labour Force Survey is a quarterly survey although the reference period for information is the week before to the interview. Its statistical unit is the main family house. It uses a two-stage sampling with stratification, the units of first stage are the census sections and the units of second stage are the family dwellings. Most of the published data are presented in absolute values. In STS sampling frame for employment is the Statistical Business Register. Sample is obtained from enterprises apply stratified sampling with optimum sample allocation. Strata are formed using the following variables: Main economic activity, number of employee and region (NUTS2). Data are published in index form. |
|||
| 15.4. Coherence - internal | |||
The coherence between variables is contrasted in all phases of the statistical process. |
|||
|
|||
Efforts have been made to the questionnaire containing all the necessary information while its design is as simplified as possible to be easily completed by the enterprises in the sample, in order to reduce as far as possible the overhead of certain reporting units that would result from the completion of multiple surveys in one year. Burden (respondents) hours per year: 1,656 h. Cost (NSI) hours per year: 21,417 h. |
|||
|
|||
| 17.1. Data revision - policy | |||
Revised data are used both for the National dissemination and to obtain the STS data transmitted to Eurostat, so the same policy is applied to the STS data released nationally and sent to Eurostat. The revision policy adopted for the Retail Trade raw data at INE Spain encompasses several types of revisions:
The link to the revision policy for raw data adopted at INE Spain is the following: There is no official revision calendar, each indicator has its own revision calendar. |
|||
| 17.2. Data revision - practice | |||
The first time the index of a given month is published, it provides provisional data, which are not final until two months later. Meanwhile the index is revised using the same data modifications that have occurred since the date of the first publication, due for instance to the replacement of the estimated data (for management issues) by the updated data completed by the enterprise. However, the series corrected for calendar effects and seasonal effects are reviewed in full every month. A6 indicator, average size of revisions, where revision is defined as the difference between final and preliminary estimators, is used for data revision practice. The quality indicators used in data revision are: MAR (Mean Absolute Revision), RMAR (Relative Mean Absolute Revision) and MR (Mean Revision). For number of persons employed: A6_MAR (December 2020): 0.07 A6_MR (December 2020): 0.00 A6_MaxAR (December 2020): 0.46 April 2020 MAR, RMAR, MR and MaxAR values were obtained with the information of its last 36 final months being December 2020 the last one. The benchmarking isn't carried out. Revisions aren’t carried out either in a business account quarterly/annual business or on national accounts and on structural business statistics either. Major revisions are informed in advance in the press release the same day of dissemination, although main users are informed in advance. Besides, from 2015 we communicate main updates in our website |
|||
|
|||
| 18.1. Source data | |||
For the survey data, we resort to the use of questionnaires to enterprises whose main activity is Division 47 of section G of the National Classification of Economic Activities (NACE, Rev. 2). Stratified sampling is used. The distribution of the sample between the different layers is done by Neyman allocation. In each stratum, a random selection made, except the enterprises over 49 employees who enter all part of the sample and other strata where frame population is very small that are also exhaustive. The selected enterprises were ranked based on three variables: main activity, size (measured by number of employees) and region. The sample size was calculated to provide indicators of the variables turnover and employment representative. The sample consists of approximately 12,500 enterprises. Rotations are performed annually, approximately 20-25% of the sample, which incorporates all new businesses depth stratum, which removes those which have been died, not found, erroneously included fused and where small businesses to replace that the completion of questionnaires required a great effort. The annual rotation process involves making a new selection of sampling units representing commercial distribution in Spain and a re-weighting of such units so that the sample data to the population rise. The rotation of the sample for the index calculation is done in January of each year, at that time also updates elevation factors and weightings. |
|||
| 18.2. Frequency of data collection | |||
Data collection is done monthly. |
|||
| 18.3. Data collection | |||
The reporting enterprises send their data through the Internet, by mail (paper completed questionnaires), or by fax or phone. |
|||
| 18.4. Data validation | |||
At the stage of completion of the questionnaire, a system that detects inconsistencies is used so that the respondent is advised and is required to confirm or modify the information provided. |
|||
| 18.5. Data compilation | |||
The questionnaires are collected by INE data collection staff and there is a first cleansing of errors according to a set of edits. Microediting consists on validating data from each local unit, attending to its historical values. The analysis establishes monthly and annual comparisons so that the data is validated without contacting the informants when the evolution is repeated periodically. Next, at centralized level, the selective editing phase, imputation (non-response is imputed using the data of the previous month of the non-respondent units and the variation rate of the units in the same stratum) and the macroediting process take place. In some cases, manual editing is required, for example non responding large units. Finally estimators are calculated by aggregating the elementary indices taking into account the weightings. In the last phase, the dissemination files together with the press release are prepared according to the dissemination breakdowns. The indexes are obtained using a chaining-linking. The elementary indices are calculated from the respondents (imputed in case of non-response) common to the reference month and the previous december. The weighting variable is calculated with the employment of December (t-1) from our own sample in base 2015, they have been updated according to the samples used in new base. |
|||
| 18.6. Adjustment | |||
Employment is not adjusted. |
|||
|
|||
None. |
|||
|
|||
|
|||
| Questionnaire |
|||