Reference metadata describe statistical concepts and methodologies used for the collection and generation of data. They provide information on data quality and, since they are strongly content-oriented, assist users in interpreting the data. Reference metadata, unlike structural metadata, can be decoupled from the data.
Data are disseminated for the following activities of Sections H, I, J, L, M (excl. M701, M72 and M75) and Ν of the statistical classification NACE Rev.2 and Divisions of NACE:
Land transport and transport via pipelines (Section H division 49)
Water transport (Section H division 50)
Air transport (Section H division 51)
Warehousing and support activities for transportation (Section H division 52)
Postal and courier activities (Section H division 53)
Accommodation activities (Section I division 55)
Food Service activities (Section I division 56)
Publishing activities (Section J division 58)
Motion picture, video and television program production, sound recording and music publishing activities (Section J division 59)
Programming and broadcasting activities (Section J division 60)
Telecommunications (Section J division 61)
Computer programming, consultancy and related activities (Section J division 62)
Information service activities (Section J division 63)
Real estate activities (Section L division 68)
Legal and accounting activities (Section M division 69)
Management consultancy activities (Section M division 70)
Architectural and engineering activities, technical testing and analysis (Section M division 71)
Advertising and market research (Section M division 73)
Other professional. scientific and technical activities (Section M division 74)
Rental and Leasing activities (Section N division 77)
Employment activities (Section N division 78)
Travel agency, tour operator reservation service and related activities (Section N division 79)
Security and investigation activities (Section N division 80)
Services to buildings and landscape activities (Section N division 81)
Office administrative, office support and other business support activities (Section N division 82)
3.2. Classification system
Eurostat’s classification NACE Rev.2 is used as required by Regulation (EC) 1893/2006 of the European Parliament and of the Council, along with the Eurostat’s classification CPA 2008 at 6-digit level of analysis, as required by Regulation (EC) 451/2008 of the European Parliament and the Council.
3.3. Coverage - sector
The Services Producer Price Indices (SPPI) with base year 2021=100.0, cover activities of Sections H, I, J, L, M (excl. M701, M72 and M75) and Ν of the statistical classification NACE Rev.2 and Divisions of NACE: 49, 50, 51, 52, 53, 55, 56, 58, 59, 60, 61, 62, 63, 68, 69, 70, 71, 73, 74, 77, 78, 79, 80, 81, 82.
3.4. Statistical concepts and definitions
The Producer Price Indices for Services are output price indices for the production of services from domestic producers and show the evolution of prices for the services that are provided to customers which are enterprises or persons that represent enterprises, in other words, they refer to services that are used as intermediate use (Business to Business-Β2Β), without differing significantly from the overall index (Business to All-B2All).Particularly in the group of indices of: the air transport index and the sea and short sea shipping index (of the new branches of services)have already been compiled as overall index (B2All) and the two indices for postal and courier services and the telecommunication services (of the new branches of services), which are compiled as overall indices (B2All) and as sub-indices for businesses (B2B) and for consumers (B2C).
The purpose of these indices is to measure the quarterly changes in producer’s prices in services as Business to All (B2All) and to record the trend of prices that reflect supply and demand in the services markets, to analyse the actual changes in the economy and to monitor inflation pressures.
3.5. Statistical unit
The reporting unit is the enterprise per Kind of Activity Unit (KAU). Consequently, the products within the scope of the survey are included even if they are part of a secondary activity of the observation enterprise (=unit). The selection of the sample of products and units is based on the method of purposive sampling. According to this method, the main criterion for the selection of the sampling units was their sales value during the base year 2021, irrespective of the location of their headquarters, according to the Business Register of ELSTAT.
3.6. Statistical population
Purposive sample of the units that are activated in the corresponding branch of economic activity and which are selected from the business register of 2021, based on a turnover threshold.
3.7. Reference area
Greece as a total.
3.8. Coverage - Time
The SPPI time series are disseminated on a quarterly basis from the 1st quarter 2007 onwards.
3.9. Base period
The base year is the year 2021 (2021=100.0).
Index, percentage changes (%) (quarterly and annual).
The reference period is the quarter.
6.1. Institutional Mandate - legal acts and other agreements
The legal framework concerning the organization and operation of ELSTAT is as follows:
Law 3832/2010 (Government Gazette No 38, Issue Α): "Hellenic Statistical System Establishment of the Hellenic Statistical Authority (ELSTAT) as an Independent Authority", as amended and in force.
Regulation on the Operation and Administration of the Hellenic Statistical Authority (ELSTAT), 2012, (Government Gazette No 2390, Issue B, 28 August 2012).
Regulation (EC) No 223/2009 of the European Parliament and of the Council, on the European statistics (Official Journal of the European Union L 87/164).
Article 14 of the Law 3470/2006 (Government Gazette No 132, Issue A): “National Export Council, tax regulations and other provisions”.
Article 3, paragraph 1c, of the Law 3448/2006 (Government Gazette No 57, Issue A): “For the further use of information coming from the public sector and the settlement of matters falling within the responsibility of the Ministry of Interior, Public Administration and Decentralization”.
European Statistics Code of Practice, adopted by the Statistical Programme Committee on 24 February 2005 and promulgated in the Commission Recommendation of 25 May 2005 on the independence, integrity and accountability of the national and Community statistical Authorities, after its revision, which was adopted on 28 September 2011 by the European Statistical System Committee.
Presidential Decree 226/2000(Government Gazette No 195, Issue Α): “Organization of the General Secretariat of the National Statistical Service of Greece”.
Articles 4, 12 , 13, 14, 15 and 16 of the Law 2392/1996 (Government Gazette No 60, Issue Α): "Access of the General Secretariat of the National Statistical Service of Greece to administrative sources and administrative files, Statistical Confidentiality Committee, settlement of matters concerning the conduct of censuses and statistical works, as well as of matters of the General Secretariat of the National Statistical Service of Greece".
The legal framework concerning Eurostat legislation:
The legal basis for the SPPI is the Regulation (EU) No 2019/2152of the European Parliament and of the Council on European business statistics, as well as Commission Implementing Regulation (EU) No 2020/1197laying down technical specifications and arrangements pursuant to Regulation (EU) No 2019/2152. In addition, Regulation (EC) No. 1893/2006 of the European Parliament and of the Council refers on the establishment of the statistical nomenclature of economic activities NACE Rev. 2.
6.2. Institutional Mandate - data sharing
The SPPI data are transmitted to Eurostat according to Regulation (EU) No 2019/2152 of the European Parliament and of the Council on European business statistics. as well as Commission Implementing Regulation (EU) No 2020/1197 laying down technical specifications and arrangements pursuant to Regulation (EU) No 2019/2152.
7.1. Confidentiality - policy
The issues concerning the observance of statistical confidentiality by the Hellenic Statistical Authority (ELSTAT) are arranged by articles 7, 8 and 9 of the Law 3832/2010 as in force, by Articles 8, 10 and 11(2) of the Regulation on Statistical Obligations of the agencies of the Hellenic Statistical System and by Articles 10 and 15 of the Regulation on the Operation and Administration of ELSTAT.
More precisely:
ELSTAT disseminates the statistics in compliance with the statistical principles of the European Statistics Code of Practice and in particular with the principle of statistical confidentiality.
7.2. Confidentiality - data treatment
ELSTAT protects and does not disseminate data it has obtained or it has access to, which enable the direct or indirect identification of the statistical units that have provided them by the disclosure of individual information directly received for statistical purposes or indirectly supplied from administrative or other sources. ELSTAT takes all appropriate preventive measures so as to render impossible the identification of individual statistical units by technical or other means that might reasonably be used by a third party. Statistical data that could potentially enable the identification of the statistical unit are disseminated by ELSTAT if and only if:
a) these data have been treated, as it is specifically set out in the Regulation on Statistical Obligations of the agencies of the Hellenic Statistical System (ELSS), in such a way that their dissemination does not prejudice statistical confidentiality or
b) the statistical unit has given its consent, without any reservations, for the disclosure of data.
The confidential data that are transmitted by ELSS agencies to ELSTAT are used exclusively for statistical purposes and the only persons who have the right to have access to these data are the personnel engaged in this task and appointed by an act of the President of ELSTAT.
ELSTAT may grant researchers conducting statistical analyses for scientific purposes access to data that enable the indirect identification of the statistical units concerned. The access is granted provided the following conditions are satisfied:
a) an appropriate request together with a detailed research proposal in conformity with current scientific standards have been submitted;
b) the research proposal indicates in sufficient detail the set of data to be accessed, the methods of analyzing them, and the time needed for the research;
c) a contract specifying the conditions for access, the obligations of the researchers, the measures for respecting the confidentiality of statistical data and the sanctions in case of breach of these obligations has been signed by the individual researcher, by his/her institution, or by the organization commissioning the research, as the case may be, and by ELSTAT.
Issues referring to the observance of statistical confidentiality are examined by the Statistical Confidentiality Committee (SCC) operating in ELSTAT. The responsibilities of this Committee are to make recommendations to the President of ELSTAT on:
the level of detail at which statistical data can be disseminated, so as the identification, either directly or indirectly, of the surveyed statistical unit is not possible;
the anonymization criteria for the microdata provided to users;
the granting to researchers access to confidential data for scientific purposes.
The staff of ELSTAT, under any employment status, as well as the temporary survey workers who are employed for the collection of statistical data in statistical surveys conducted by ELSTAT, who acquire access by any means to confidential data, are bound by the principle of confidentiality and must use these data exclusively for the statistical purposes of ELSTAT. After the termination of their term of office, they are not allowed to use these data for any purpose.
Violation of data confidentiality and/or statistical confidentiality by any civil servant or employee of ELSTAT constitutes the disciplinary offence of violation of duty and may be punished with the penalty of final dismissal.
ELSTAT, by its decision, may impose a penalty amounting from ten thousand (10,000) up to two hundred thousand (200,000) euros to anyone who violates the confidentiality of data and/or statistical confidentiality. The penalty is always imposed after the hearing of the defense of the person liable for the breach, depending on the gravity and the repercussions of the violation. Any relapse constitutes an aggravating factor for the assessment of the administrative sanction.
8.1. Release calendar
A release calendar is available on the website with the precise release dates of statistics for the following year.
8.2. Release calendar access
The calendar is distributed to the press and is available to all interested parties free of charge.
In line with the Community legal framework and the European Statistics Code of Practice, ELSTAT disseminates national statistics on ELSTAT’s website respecting professional independence and in an objective, professional and transparent manner in which all users are treated equitably.
In this content, data for SPPI are released simultaneously to all interested parties and users through an Announcement, which is posted on the website of ELSTAT.
This Announcement is also available by e-mail to all interested parties. In addition, data are transmitted to Eurostat on a predefined date, concomitantly with their national publication.
The Services Producer Price Indices are disseminated on a quarterly basis.
10.1. Dissemination format - News release
Every quarter, 90 days (t+90) after the end of the reference quarter, at 12:00, an Announcement is released concerning the newly compiled indices in Greek and in English. This Announcement is sent, free-of-charge, and mostly by email to the press and to other interested parties.
10.2. Dissemination format - Publications
There are no publications concerning the Services Producer Price Indices.
10.3. Dissemination format - online database
There are no data concerning the Services Producer Price Indices available on the on-line database of ELSTAT.
Data tables - consultations
In 2024, total access to the website as regards the SPPI amounted to 21,049 hits.
10.4. Dissemination format - microdata access
Data are available after submitting a request to ELSTAT, Division of Statistical Information and Publications, Pireos 46 &Eponiton, 18510, Piraeus, tel. (+30) 213 135 2022, e-mail: data.dissem@statistics.gr
Access to microdata is only permitted under strict conditions and always with due process.
10.5. Dissemination format - other
More data dissemination by ELSTAT as well as in Eurostat’s publications.
Users can be given data or further analysis, usually by telephone or e-mail after submitting a request, describing the requested data to the Section of Statistical Dissemination (the Trade and Services Indices Section will be informed), at the following e-mail addresses: data.dissem@statistics.gr, data.supply@statistics.gr, data.source@statistics.gr.
Users can also submit their requests electronically.
Metadata – consultations
In 2024, total access to the website as regards the SPPI amounted to 21,049 hits. There is no possibility to make the distinction between users’ consultations on data tables and users’ consultations on metadata.
10.6. Documentation on methodology
The methodology for the compilation of the index is laid down by ELSTAT, taking into account international practices and, in particular, Eurostat’s recommendations, guidelines and standards.
The methodological issue that includes a set of guidelines for the preparation of short-term statistics is available.
The methodological manual on Services Producers Price Indices (SPPI) by Eurostat, is available.
The metadata of the SPPI are posted on the webpage of ELSTAT at the link:
Metadata completeness amounts to 100%.
10.7. Quality management - documentation
A concise user-oriented quality report isavailable on the website of ELSTAT.
11.1. Quality assurance
The Hellenic Statistical Authority (ELSTAT) aims to ensure and further improve the quality of statistics produced and maintain the confidence of users in them. This is achievedthrough the QualityPolicy of ELSTAT which is posted on the website of ELSTAT.
Quality checks and validation of data are carried out during the whole process of the compilation of the index - from the data collection stage to the final compilation of the index.
The well-trained and experienced staff deals with all the stages of the compilation of the indices, that is: data collection, including communication with the enterprises, initial checksof the data as to their correctness, data entry and final checks, which are conducted after the calculation of the index. This way, the personnel have a comprehensive and long-standing experience with the enterprises under survey.
Data are validated either before or after data entry by means of logical checks. During data processing, the data are checked in order to identify and correct any measurement or data entry errors. The detection of these errors is done in data of the enterprises, by examining whether these data are within a certain range of values, based on the size of the enterprises, as well as the seasonality of the data. At the same time, data are checked for completeness, accuracy and consistency of the correlating variables.
The index is calculated by means of specialised software, through computation routines, thus eliminating any errors to the final results. Nevertheless, even during this stage, consistency checks are carried out to the final results, mainly on comparing the percentage changes of the corresponding quarters.
11.2. Quality management - assessment
The Services Producer Price Indices have been progressively developed by making revisions every five-year period, following European and international standards and guidelines on both concepts and definitions as well as methodology.
12.1. Relevance - User Needs
The Services Producer Price Indices cover national needs and the needs of European and other users. The main national users of the SPPI are the government, other public agencies, the Central Bank of Greece, other Hellenic banks, the Hellenic Federation of Enterprises (SEV), the Foundation for Economic and Industrial Research (IOBE), the Centre for Planning and Economic Research, chambers, etc., while at international level, the indices are used by Eurostat, the International Monetary Fund (IMF), the United Nations (UN), etc.
Users needs vary. At national level, the SPPI are used as a tool offering up-to-date and reliable information for the observation of the trend of prices and as deflators for the corresponding branches of economic activity of the services sector, so as the government is able to define the monetary policy, and the enterprises or other institutions to facilitate the decision-making for undertaking initiatives in order to enhance growth. At European level, there is the need for reliable statistics, such as SPPI, which would be comparable at all levels, in order for the European monetary policy to be defined.
ELSTAT conducts an annual user satisfaction survey. The comments on the media are positive. More information about the latest results of user research, for the annual periods per semester, is available in the Library Information Bulletin, on the website of ELSTAT, "Products and Services".
b. Conference of statistical data users
According to its annual statistical program, ELSTAT has been conducting a user conference since 2010 on an annual basis, attended by representatives of private and public sector bodies, as well as educational and research institutions. Information about user conferences.
12.3. Completeness
Τhe data provided cover completely the requirements of the relevant Eurostat Regulations.
13.1. Accuracy - overall
The accuracy of SPPI is generally considered to be high. ELSTAT does not calculate sampling errors for SPPI because the purposive sampling technique is applied, instead of the random sampling technique. As regards non-sampling errors, they mostly refer to measurement or non-response errors. The efforts which are made mostly focus on identifying and eliminating, to the extent possible, these errors, through the revision of data.
13.2. Sampling error
Sampling error is not estimated for the SPPI because the purposive sampling technique is applied.
The information of collected prices referred to the mid of the quarter, in a quarterly periodicity, so in this way, to ensure the comparison of the average price level of the current period (quarter), compared to the level of prices in the corresponding base period (quarter).
13.3. Non-sampling error
Unit non – response
In case of non-response, the surveyed enterprise is contacted by telephone, or is sent a reminder by e-mail or even a statistical interviewer pays a visit to the enterprise.There are, also, errors due to non-response of enterprises, yet non-response rate is less than 5% of the sample, with the overall response to be about 95%. Non-response is treated by estimating missing values according to the prices trend from other enterprises that provide the same or similar services.
Item non - response
There are not any errors related to the inconsistent implementation of definitions. If some services-products cease to be representative or change their characteristics on the basis of which they are defined, new items or similar items are used to replace them. In these cases, their calculation, for the base year, is based on the use of the indices of the group in which they belong.
Coverage error
No coverage errors are observed in the Business Register of ELSTAT, on the basis of which the survey on the compilation of the SPPI was designed.
Over-coverage – rate
No over-coverage errors (e.g., closed enterprises, enterprises out of the scope of the survey, etc.) are observed in the Business Register of ELSTAT, on the basis of which the survey on the compilation of the SPPI was designed.
Common units – proportion
The index is compiled on the basis of a common sample of enterprises for each quarter, which is renewed with the change of the base year. The enterprises which stop their activity, replaced immediately by the Business Register, so that the percentage of common enterprises of the sample among the quarters to be at 100%.
Measurement error
Measurements errors occur during data collection. They are identified by means of quality checks and are duly corrected.
Non response error
In case of non-response, the surveyed enterprise is contacted by telephone, or is sent a reminder by e-mail.
Processing error
Processing errors are minimized because all the relevant tasks are performed by using a special software application and logical checks are performed.
Model assumption error
No model is used for the compilation of the index.
14.1. Timeliness
The indices are published 90 days (t+90) after the end of the reference quarter.
14.2. Punctuality
All the indices are published in accordance with the pre-announced release calendar.
15.1. Comparability - geographical
The Regulation (EU) No 2019/2152 and the STS basic methodological guidelines are implemented for the compilation of the indices, thus ensuring a good comparability between the Greek SPPI and the other national and European statistics, taking always into account any special conditions prevailing in each country, which may dictate minor methodological deviations.
15.1.1 Assymetry for mirror flows statistics – coefficient
For the SPPI there are no mirror-flows statistics among EU Member States.
15.2. Comparability - over time
The time series of the index with base year 2021=100.0 is considered fully comparable over time.
These time series are available from January 2010 onwards (except the Aggregated Sections, the H to N (excl. K, M701, M72 and M75) Sections and the Divisions H49, H50, I55, I56, J58, J59, J60, L68, M74, N77, N79, N81, N82, which are available from 1st quarter 2021).
15.3. Coherence - cross domain
Regular crosschecks are carried out on the basis of information from other surveys. Comparisons are made mainly with the sub-indices of the consumer price index (CPI) that have to do with the corresponding branches of services sector. The difference with these sub-indices is that the latter include taxes in the prices, as well as that the services in the CPI may be provided by non-domestic producers.
Coherence – sub annual and annual statistics
The common sample of enterprises used for the index ensures the accurate representation of the evolution of the index during several time periods.
Coherence – National Accounts
The SPPI are used by the National Accounts Division for the compilation of their estimations and they are also used as deflators for the relevant branches of economic activities in the services sector.
15.4. Coherence - internal
The SPPIs are internally coherent because a common data base is used and they are complied on the basis of common methodology. Higher-level aggregate derives from detailed indices according to well-defined procedures.
a) Regarding the staff of ELSTAT that is involved in the compilation of the index, the annual cost, in working hours in 2024, amounts to 1,918 hours.
b) With regard to the surveyed units, the average annual charge in working hours required to provide a response in 2024, is 4.4 minutes per price (in an average of 7 prices per unit collected questionnaire of the units).
17.1. Data revision - policy
According to the Regulation (EU) No 2019/2152, the Services Producer Price Indices (like other short-term statistics variables), are revised every five years in years ending in 0 or 5, but in the current revision with base year 2021=100.0 (due to the impact of the pandemic), the indices were revised with base year, the year 2021. The purpose of these revisions is to adjust the index to the current developments in the services sector, where in addition to the change of the base year, both, the survey sample and the reduction factors (weights) of the enterprises are updated.
The data are revised, in accordance with the Revision Policy of ELSTAT.
The same revision policy for all kind of revisions is applied to data released nationally and to those transmitted to Eurostat to assure coherence.
17.2. Data revision - practice
The data released for the most recent quarter are provisional and are published together with revised data of the previous quarters. Quarterly correction is made due to late reporting of respondents. Whenever the data are revised, the same revision policy is applied to data released nationally ant to those transmitted to Eurostat, in order to ensure coherence.
18.1. Source data
The turnover of each service in a 6-digit CPA analysis was provided from the results of an Ad hoc statistical survey of the enterprises (=units) from the Statistical Business Register (SBR) of ELSTAT in year 2021.
The selection of the enterprises of the sample was done with the application of purposive sampling from ELSTAT's SBR in year 2021, so as: a) to produce the services that were selected and b) their turnover in services to be significantly high in relation to the total turnover in the respective division of economic activity which are classified.
From the results of the above survey, we calculated the weighting coefficients (in 6-digit CPA analysis), that were used on calculation of the indices in every respective sector of economic activity, with the reduction to the available total turnover of 2-digit, 3-digit and 4-digit of NACE Rev. 2, as existed in the data of ELSTAT's SBR in year 2021.
The data are collected from a sample that contains 450 enterprises, while the total number of observations (prices in the middle of the reference quarter) is approximately 3,000. For the compilation of SPPIs are recorded the transactions that reflect the prices received by the producers for services actually sold to purchasers, including discounts, rebates or other charges. The collected prices are the basic prices for services sold. i.e. prices excluding VAT and other similar deductible taxes directly linked to turnover and also excluding all other taxes on products-services but including any existed subsidies.
18.2. Frequency of data collection
The data are collected on a quarterly basis.
18.3. Data collection
Data are collected by specialized employees–price collectors and for this purpose specially designed questionnaires are used for this purpose, adapted to each enterprise. The services provided by each enterprise are pre-printed in the questionnaires and the prices charged for these services are requested, during the reference quarter. The prices are collected by means of the following ways:
with personal visits of price collectors to the enterprises
via telephone contacts
via e-mail
via internet search.
Non-response is treated by telephone contacts, e-mails and personal visits of interviewers to the enterprises.
18.4. Data validation
Data are validated by means of logical checks. Data processing encompasses investigation of data in order to identify and duly correct any errors. Special emphasis is put on the errors that have significant impact on the results. After identifying errors, further investigation takes place in cooperation with the enterprise in order to confirm that it is an error or just an unusual price. Moreover, completeness checks are carried out in order to confirm that the values are within given ranges and that values for related variables are coherent. The data processing and data validation takes place either during or after data entry.
The data are compared with the data of the previous quarters and inconsistencies or major deviations lead to more thorough investigation.
18.5. Data compilation
The indices are Laspeyres-type indices with weights based on turnover data at 6-digit level that are produced from the specific structural surveys of the year 2021 (and for div. 69, 70 of the year 2020).
In the cases of postal and courier services and of telecommunications services, as it was stated, two sub indices, a B2B and a B2C, are compiled and then the overall index B2All as a weighted average of the above two indices. The indices are compiled with successive aggregations from lower to higher levels, in which every aggregation level uses the arithmetic mean of indices at the lowest level duly weighted.
The SPPI indices in any division are calculated using a variation of the Laspeyres formula, as follows:
where:
, is the general index of the current period (quarter) t, at the highest level of aggregation,
, is the total index of grouping level i during the current period (quarter) t,
wi = the weighting coefficientof grouping level i, (from the turnover of every level i during the base period 0),
i = 1,2…n, grouping level
t = current period (quarter or year)
where: and are the price and quantity of the product-service (of businesses involved in weighting) in the lowest grouping level i in base period 0, respectively,
with: = the turnover of each subcategory i, in base period 0.
and the: = the turnover in the total level of completion of each subcategory i, in base period 0.
The successive phases of grouping from the lower to the higher level classifications are: service, sub-category (6-digit level), category (5-digit level), activity or class (4-digit level), group (3-digit level), division (2-digit level), B2B and B2C indices, overall index.
The total index of each subcategory i, is calculated as weighted mean:
, where: ,
= is the j unit’s turnover in the subcategory i and is the index of unit j in the subcategory i, with j = 1, 2… k, units.
The calculation of the index , is done using the arithmetic mean of the relative prices of the m varieties of each service r, in the subcategory i, in j units.
Then:
,
where: , is the number of varieties m (when exist in j units), of the service r, from all sources of price collection, m=1,2,3,..,Nr
, is the number of m variety of the service r, the current period t,
, is the price of m variety of the service r, in the base period 0.
The back casting calculation of indices is a simple reduction in the base year 2021=100.0, without recalculation of the indices with new weights 2021=100.0.
To connect the time series of the quarterly and annually indices with base year 2015=100.0 in base year 2021=100, a retrospective calculation was made by readjusting the previous series to the base year 2021=100.0, multiplying the indices of the series calculated with base year 2015=100.0 with 100 and dividing by the annual average of the indices in the year 2021 with base year 2015=100.0.
The SPPI indices for the 1st quarter 2024 onwards have been calculated with the new weights of the 2021 revision. The calculation of the annual SPPIs is done using the arithmetic mean of quarterly SPPIs in every classification division of NACE Rev.2.
Imputation – rate
Not usually imputed values are used to substitute the price collection by sample units. However, in very few cases imputed values are the rate not exceeding 0.01%. The procedure followed for the handling of missing data (missing values) is their assessment (imputed rates), based on the trend of current price collection of the units that provide the same or similar services.
18.6. Adjustment
A statistical procedure for adaptation or correction of the data is not used.
Seasonal adjustment:
There is no seasonal adjustment in the index.
No further comment.
Data are disseminated for the following activities of Sections H, I, J, L, M (excl. M701, M72 and M75) and Ν of the statistical classification NACE Rev.2 and Divisions of NACE:
Land transport and transport via pipelines (Section H division 49)
Water transport (Section H division 50)
Air transport (Section H division 51)
Warehousing and support activities for transportation (Section H division 52)
Postal and courier activities (Section H division 53)
Accommodation activities (Section I division 55)
Food Service activities (Section I division 56)
Publishing activities (Section J division 58)
Motion picture, video and television program production, sound recording and music publishing activities (Section J division 59)
Programming and broadcasting activities (Section J division 60)
Telecommunications (Section J division 61)
Computer programming, consultancy and related activities (Section J division 62)
Information service activities (Section J division 63)
Real estate activities (Section L division 68)
Legal and accounting activities (Section M division 69)
Management consultancy activities (Section M division 70)
Architectural and engineering activities, technical testing and analysis (Section M division 71)
Advertising and market research (Section M division 73)
Other professional. scientific and technical activities (Section M division 74)
Rental and Leasing activities (Section N division 77)
Employment activities (Section N division 78)
Travel agency, tour operator reservation service and related activities (Section N division 79)
Security and investigation activities (Section N division 80)
Services to buildings and landscape activities (Section N division 81)
Office administrative, office support and other business support activities (Section N division 82)
30 May 2025
The Producer Price Indices for Services are output price indices for the production of services from domestic producers and show the evolution of prices for the services that are provided to customers which are enterprises or persons that represent enterprises, in other words, they refer to services that are used as intermediate use (Business to Business-Β2Β), without differing significantly from the overall index (Business to All-B2All).Particularly in the group of indices of: the air transport index and the sea and short sea shipping index (of the new branches of services)have already been compiled as overall index (B2All) and the two indices for postal and courier services and the telecommunication services (of the new branches of services), which are compiled as overall indices (B2All) and as sub-indices for businesses (B2B) and for consumers (B2C).
The purpose of these indices is to measure the quarterly changes in producer’s prices in services as Business to All (B2All) and to record the trend of prices that reflect supply and demand in the services markets, to analyse the actual changes in the economy and to monitor inflation pressures.
The reporting unit is the enterprise per Kind of Activity Unit (KAU). Consequently, the products within the scope of the survey are included even if they are part of a secondary activity of the observation enterprise (=unit). The selection of the sample of products and units is based on the method of purposive sampling. According to this method, the main criterion for the selection of the sampling units was their sales value during the base year 2021, irrespective of the location of their headquarters, according to the Business Register of ELSTAT.
Purposive sample of the units that are activated in the corresponding branch of economic activity and which are selected from the business register of 2021, based on a turnover threshold.
Greece as a total.
The reference period is the quarter.
The accuracy of SPPI is generally considered to be high. ELSTAT does not calculate sampling errors for SPPI because the purposive sampling technique is applied, instead of the random sampling technique. As regards non-sampling errors, they mostly refer to measurement or non-response errors. The efforts which are made mostly focus on identifying and eliminating, to the extent possible, these errors, through the revision of data.
Index, percentage changes (%) (quarterly and annual).
The indices are Laspeyres-type indices with weights based on turnover data at 6-digit level that are produced from the specific structural surveys of the year 2021 (and for div. 69, 70 of the year 2020).
In the cases of postal and courier services and of telecommunications services, as it was stated, two sub indices, a B2B and a B2C, are compiled and then the overall index B2All as a weighted average of the above two indices. The indices are compiled with successive aggregations from lower to higher levels, in which every aggregation level uses the arithmetic mean of indices at the lowest level duly weighted.
The SPPI indices in any division are calculated using a variation of the Laspeyres formula, as follows:
where:
, is the general index of the current period (quarter) t, at the highest level of aggregation,
, is the total index of grouping level i during the current period (quarter) t,
wi = the weighting coefficientof grouping level i, (from the turnover of every level i during the base period 0),
i = 1,2…n, grouping level
t = current period (quarter or year)
where: and are the price and quantity of the product-service (of businesses involved in weighting) in the lowest grouping level i in base period 0, respectively,
with: = the turnover of each subcategory i, in base period 0.
and the: = the turnover in the total level of completion of each subcategory i, in base period 0.
The successive phases of grouping from the lower to the higher level classifications are: service, sub-category (6-digit level), category (5-digit level), activity or class (4-digit level), group (3-digit level), division (2-digit level), B2B and B2C indices, overall index.
The total index of each subcategory i, is calculated as weighted mean:
, where: ,
= is the j unit’s turnover in the subcategory i and is the index of unit j in the subcategory i, with j = 1, 2… k, units.
The calculation of the index , is done using the arithmetic mean of the relative prices of the m varieties of each service r, in the subcategory i, in j units.
Then:
,
where: , is the number of varieties m (when exist in j units), of the service r, from all sources of price collection, m=1,2,3,..,Nr
, is the number of m variety of the service r, the current period t,
, is the price of m variety of the service r, in the base period 0.
The back casting calculation of indices is a simple reduction in the base year 2021=100.0, without recalculation of the indices with new weights 2021=100.0.
To connect the time series of the quarterly and annually indices with base year 2015=100.0 in base year 2021=100, a retrospective calculation was made by readjusting the previous series to the base year 2021=100.0, multiplying the indices of the series calculated with base year 2015=100.0 with 100 and dividing by the annual average of the indices in the year 2021 with base year 2015=100.0.
The SPPI indices for the 1st quarter 2024 onwards have been calculated with the new weights of the 2021 revision. The calculation of the annual SPPIs is done using the arithmetic mean of quarterly SPPIs in every classification division of NACE Rev.2.
Imputation – rate
Not usually imputed values are used to substitute the price collection by sample units. However, in very few cases imputed values are the rate not exceeding 0.01%. The procedure followed for the handling of missing data (missing values) is their assessment (imputed rates), based on the trend of current price collection of the units that provide the same or similar services.
The turnover of each service in a 6-digit CPA analysis was provided from the results of an Ad hoc statistical survey of the enterprises (=units) from the Statistical Business Register (SBR) of ELSTAT in year 2021.
The selection of the enterprises of the sample was done with the application of purposive sampling from ELSTAT's SBR in year 2021, so as: a) to produce the services that were selected and b) their turnover in services to be significantly high in relation to the total turnover in the respective division of economic activity which are classified.
From the results of the above survey, we calculated the weighting coefficients (in 6-digit CPA analysis), that were used on calculation of the indices in every respective sector of economic activity, with the reduction to the available total turnover of 2-digit, 3-digit and 4-digit of NACE Rev. 2, as existed in the data of ELSTAT's SBR in year 2021.
The data are collected from a sample that contains 450 enterprises, while the total number of observations (prices in the middle of the reference quarter) is approximately 3,000. For the compilation of SPPIs are recorded the transactions that reflect the prices received by the producers for services actually sold to purchasers, including discounts, rebates or other charges. The collected prices are the basic prices for services sold. i.e. prices excluding VAT and other similar deductible taxes directly linked to turnover and also excluding all other taxes on products-services but including any existed subsidies.
The Services Producer Price Indices are disseminated on a quarterly basis.
The indices are published 90 days (t+90) after the end of the reference quarter.
The Regulation (EU) No 2019/2152 and the STS basic methodological guidelines are implemented for the compilation of the indices, thus ensuring a good comparability between the Greek SPPI and the other national and European statistics, taking always into account any special conditions prevailing in each country, which may dictate minor methodological deviations.
15.1.1 Assymetry for mirror flows statistics – coefficient
For the SPPI there are no mirror-flows statistics among EU Member States.
The time series of the index with base year 2021=100.0 is considered fully comparable over time.
These time series are available from January 2010 onwards (except the Aggregated Sections, the H to N (excl. K, M701, M72 and M75) Sections and the Divisions H49, H50, I55, I56, J58, J59, J60, L68, M74, N77, N79, N81, N82, which are available from 1st quarter 2021).


 , is the general index of the current period (quarter) t, at the highest level of aggregation,
 , is the total index of grouping level i during the current period (quarter) t,
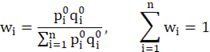
 and
and  are the price and quantity of the product-service (of businesses involved in weighting) in the lowest grouping level i in base period 0, respectively,
 = the turnover of each subcategory i, in base period 0.
 = the turnover in the total level of completion of each subcategory i, in base period 0.
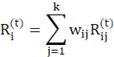 , where:
  ,
, = is the j unit’s turnover in the subcategory i and
  is the index of unit j in the subcategory i, with j = 1, 2… k, units.
  , is done using the arithmetic mean of the relative prices of the m varieties of each service r, in the subcategory i, in j units.
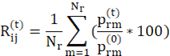 ,
, , is the number of varieties m (when exist in j units), of the service r, from all sources of price collection, m=1,2,3,..,Nr
 , is the number of m variety of the service r, the current period t,
 , is the price of m variety of the service r, in the base period 0.