Reference metadata describe statistical concepts and methodologies used for the collection and generation of data. They provide information on data quality and, since they are strongly content-oriented, assist users in interpreting the data. Reference metadata, unlike structural metadata, can be decoupled from the data.
Litostrojska cesta 54, p.p. 3570, 1000 Ljubljana, Slovenija
1.6. Contact email address
Confidential because of GDPR
1.7. Contact phone number
Confidential because of GDPR
1.8. Contact fax number
Confidential because of GDPR
2.1. Metadata last certified
29 August 2025
2.2. Metadata last posted
29 August 2025
2.3. Metadata last update
29 August 2025
3.1. Data description
The index of services production (ISP) is a business indicator which measures the monthly changes of the price adjusted output of the services industries (excluding financial and public services).
Index of service production measures the volume of sales in selected activities and is derived from turnover at current prices, which is converted into constant prices. Since the intention is to measure changes in the volume of gross output, data on added value from the survey on structural business statistics are used as weights in the calculation of the index of service production.
Turnover comprises the totals invoiced by the observation unit during the reference period, and this corresponds to market sales of goods or services supplied to third parties. Turnover also includes all other charges linked to the buyer, even if these charges are listed separately on the invoice. Turnover excludes VAT and other similar deductible taxes directly linked to turnover as well as all duties and taxes on the goods or services invoiced by the unit. Reduction in prices and discounts must be deducted. The sale for loan is registered in the month of invoicing.
Volume turnover is a turnover at constant prices. The conversion of data from current to constant prices is called deflation. Deflation of turnover in services and trade is carried out using appropriate deflators.
3.5. Statistical unit
The observation unit is an enterprise. Some major enterprises are observed at a more detailed level, i.e. at the level of kind of activity units (KAU). These enterprises divide their turnover among main and one or more secondary activities, which is then included in suitable activity.
3.6. Statistical population
The basis for calculating the production index in service and trade activities is the data of the units that are observed in the surveys Monthly report on service activities, Retail trade, sale and maintenance of motor vehicles and Wholesale. Observation units in these surveys are selected based on threshold coverage. The criteria for the definition of units included in the surveys are the principal registered activity, annual turnover of the enterprise and the number of persons in paid employment according to the Statistical Register of Employment. The surveys cover all enterprises whose main activity is classified into one of the service activities within the sections G, H, I, J, L, M and N of NACE Rev. 2, that:
have annual turnover higher than EUR 180,000 for the units from previous coverage or EUR 300,000 for newly selected units
have annual turnover higher than EUR 90,000 and more than 2 persons in paid employment for the units from previous coverage or EUR 150,000 and more than 2 persons in paid employment for newly selected units
have more than 5 persons in paid employment.
Data on employed persons are obtained from the Statistical Register of Employment (SRDAP). These surveys include approximately 20,750 units.
3.7. Reference area
National teritory of the Republic of Slovenia.
3.8. Coverage - Time
From January 2010 onwards. Until the end of 2024, the length of the series is 180 months. Data for service activities L68, N77 and N81 are available since 2015. The length of the series for these activities is 108 months.
3.9. Base period
2021
Index.
Reference Period: Month.
6.1. Institutional Mandate - legal acts and other agreements
Regulation (EU) 2019/2152 of the European Parliament and of the Council of 27 November 2019 on European business statistics, repealing 10 legal acts in the field of business statistics
Annual Programme of Statistical Surveys
National Statistics Act (OJ RS, No. 45/95 and 9/01)
6.2. Institutional Mandate - data sharing
We do not send data directly to any other data-producing agency except to Eurostat.
7.1. Confidentiality - policy
Regulation (EC) No 223/2009 on European statistics (recital 24 and Article 20 (4)) of 11 March 2009 (OJ L 87,p.164), stipulates the need to establish common principles and guidelines ensuring the confidentiality of data used for the production of European statistics and the access to those confidential data. All data collected and published by the Statistical Office are governed by the National Statistics Act (OJ) RS No. 45/95 and (No. 9/01).
7.2. Confidentiality - data treatment
Only the aggregated data are published, from which the single data values can not be recognized.
8.1. Release calendar
The release calendar with advanced release dates for all months of the reference year is published at the beginnig of the year on a website of the Statistical Office. The release calendar is publicly accessible.
Data of the index of services production (ISP) are published on the release date at 10.30 am on the SURS's website. Simultaneously, data that are more detailed are published in the SiStat Database. None of the users has a prior access to the data. Data are available free of charge. After the release on the same day, data are transmitted to Eurostat.
Monthly.
10.1. Dissemination format - News release
The article called »Index of service and trade production« is issued according to release calendar at 10:30 a.m. on SURS’s website.
10.2. Dissemination format - Publications
SURS on occasions publishes publications, which can contain data of the index of services production.
10.3. Dissemination format - online database
SI-STAT database (Indices of services and trade production). SI STAT database provides a modern way of preparing and exporting data for selected categories.
10.4. Dissemination format - microdata access
In Slovenia, the entities entitled to obtain the statistically protected microdata include the registered research institutions, registered researchers, and the researchers of government offices. Basic instructions concerning the access and the use of statistically protected microdata are availabe on the SURS's website.
10.5. Dissemination format - other
The data on index of services production are transmitted to Eurostat according to STS Requirements under NACE Rev. 2 in order to compile EU aggregates and for the dissemination of national data in Eurostat’s dissemination database.
10.6. Documentation on methodology
Methodological explanations for index of services production data are availabe on the SURS's website – Theme: Trade and Services; Sub-theme: either Trade or Other services; Index of service and trade production. There is an automatic link to the methodological explanations in the electronic version of the First Relase and at the SI-STAT database for the data set on indices of services and trade production.
10.7. Quality management - documentation
Quality reports are available at the SURS's website – Theme: Trade and Services; Sub-theme: either Trade or Other services; Index of service and trade production.
Indices on index of services production are produced in compliance with methodological requirements and standards.
12.1. Relevance - User Needs
The key users of the data are Institute of Macroeconomic Analysis and Development (IMAD), Chamber of Commerce and Industry of Slovenia (CCIS) and Eurostat.
12.2. Relevance - User Satisfaction
The principle users are asked about their needs, wishes and interests at the regular meetings, i.e. at the statistical advisory committee on retail trade and service statistics.
12.3. Completeness
Completeness of statistical results is 100% - all demanded data have been disseminated.
13.1. Accuracy - overall
The over-coverage rate for 2024 is on average:
0.8% for wholesale and retail trade and repair of motor vehicles and motorcycles and
0.9% for service activities.
The under-coverage bias for 2023 is 0.2 for G45, 0.1 for G46, 0.4 for G47 and 0.6 for services (SBR data for 2024 are not available yet) and is a result of the procedure used for determination of frame population. It shows the difference between tha annual indices calculated from data of the Statistical business Register of Slovenia (SBR), taking into account the entire target population and annual indices calculated from SBR data taking into account the surveypopulation (coverage).
The average rate of coherence, measured in terms of the absolute difference of indices for services field units, is 0.2. For service activities, the average unweighted unit non-response rate is 10.4%, while the average weighted unit non-response rate is 3.9%.
Because of two different sources, we can talk also about field unit non-response rate and non-response rate for units whose data we get from the administrative source. In 2024 the non-response rate for field units was 4.8% for services and 2.4% for G. Non-response rate for units whose data we get from the administrative source was 11.0% for services and 5.3% for G.
The average imputation rate for the missing data and data obtained from administrative sources, which were at the stage of automated data editing marked as too prominent, is 10.4% for services, 7.1% for G45, 3.6% for G46 and 7.2% for G47.
13.2. Sampling error
The survey is not conducted on the basis of a random sample, therefore there is no sampling error.
13.3. Non-sampling error
Coverage errors
The over-coverage rate is on average 0.9% for services and 0.8 for G. The units which represent over-coverage can be divided into ineligible units (we include them in coverage because of lack of information, but do not belong there) and units which were at the inclusion in coverage eligible, but became ineligible at the time of survey implementation as a result of demographic changes.
Under-coverage is a result of the procedure used for the determination of frame population. The survey frame is based on Statistical Business Register (SBR). Observation units are chosen at the end of the year for the next year on the basis of threshold coverage. We use the cut-off sample selection; the whole cut-off procedure is carried out in two steps. In the first step the units included in the survey are determined and then in the second step the units for which the data will still be obtained by questionnaire are selected. The enterprise is included in the survey if it fulfils one of the following criteria:
have annual turnover higher than EUR 180,000 for the units from previous coverage or EUR 300,000 for newly selected units
have annual turnover higher than EUR 90,000 and more than 2 persons in paid employment for the units from previous coverage or EUR 150,000 nad more than 2 persons in paid employment for neely selected units
the enterprise has more than 5 persons in paid employment.
The units for which the data will be obtained by questionnaire are determined on the basis of the reported turnover from the previous year. We first sort the units by descending turnover. Then we select a sufficient number of units (largest units) from the beginning of the list so that they exceed the defined share (approximately 60%) of turnover in the total turnover of units covered in the selected activity group. Every year we calculate the under-coverage bias on the basis of SBR data. We compare the annual indices (average of the T year compared to average of the T-1 year). The difference between annual index calculated from data of SBR for services, taking into account the entire population and annual index taking into account the survey population (coverage) for 2023 is 0.6 for services, 0.2 for G45, 0.1 for G46 and 0.4 for G47 (SBR data for 2022 are not avaliable yet). Multiple listings: We haven’t detected yet that the enterprises are present more than once in the frame, since the service survey is based on SBR.
Measurement errors We collect data on turnover directly from the most important observation units with the monthly questionnaire, which is avaliable electronically. The most important reporting units must send full-filed questionnaires to the Statistical Office by the 20th day for services and 8th day for wholesale and retail trade and repair of motor vehicles and motorcycles in the current month with the data for the previous month. The main sources of data on turnover for other units included in the survey are the data which are reported by enterprises to the Financial Administration of the Republic of Slovenia for the purpose of value added tax return (DDV-O form). There are some methodological differences in the definition of turnover between short-term statistics and the VAT database. The comparison of the index series calculated from two different sources (field units and a combination of field and VAT units) in feasibility studies indicate that VAT data can be used as the main source of turnover. For field units for which data are obtained through a questionnaire, we have the data from the VAT database, so that this (sub)population can be compared to the consistency of data from two different sources. The average rate of the coherence in terms of absolute difference of indices for services data for 2024 is 0.2 and 0.1 for G. If the respondents give the erroneous data on monthly turnover they always have the opportunity to report the correct value later on. If the erroneous data are significant then we detect them through the logical controls, otherwise we detect them by coincidence. Fundamentally there is no interviewer impact in the service survey since the data are gathered on electronic or paper questionnaires. The impact of the interviewer is present just in the case when the unit is contacted by phone because of non-response, but we do not evaluate this kind of errors.
Non-response errors Unit non-response rate: The average monthly un-weighted unit non-response rate for 2024 for services is 10.4%. The average monthly weighted unit non-response for services is 3.9%. Variable for calculation of weighted unit non-response is annual turnover of the unit. A significant number of units constituting the category of unit non-response report VAT data on a quarterly, rather than on a monthly basis. For these units we estimate monthly income for the three months of the quarter at the end of the quarter. Without the consideration of estimated monthly VAT data in the category of unit response the average unit non-response rate for 2024 for G is 1.3%. With the consideration of estimated monthly VAT data in the category of unit response the average monthly un-weighted unit non-response rate for 2024 for services is 1.7%. The average monthly weighted unit non-response rate with included quarterly VAT data for services is 1.3% and for G is 0.4%. Because of two different sources, we can talk also about field unit non-response rate and non-response rate for units whose data we get from the administrative source. In 2024 non-response rate for field units is 4.8% for services and 2.4% gor G. Non-response rate for units whose data we get from the administrative source is 11.0% for services and 5.3% for G. Item non-response rate: We monitor only one variable (turnover), so the item non-response rate is equal to the unit non-response rate in general.
Data processing errors For field units for which data are obtained through a questionnaire the control takes place interactively so we do not have the accurate records of the editing rate, but only an estimate. For 2021 we estimate that we checked the data for approximately 10% of field units and actually corrected data for approximately less than 1% of units. For the units for which the data on turnover are obtained from VAT database the automatic data editing is performed, where all adjustments take place through computer applications. The editing rate for automatic adjustments of tax data for services is 1.3%. In the survey we impute (fill in) the missing data and data obtained from administrative sources, which were at the stage of automated data editing marked as too prominent. The average imputation rate for services is 10.4% and 5.1% for G. Weighted imputation rate for G is 0.9%. Impact of coding is not relevant because coding of response data is not used.
Model errors
Model errors are not relevant because no specific models are used in estimation.
14.1. Timeliness
The publication schedule is fixed and announced in advance. The First Release is published 60 days after the end of the reference month. Data are at the same time also loaded into the SI STAT database on a website of the Statistical office of the Republic of Slovenia, created for user friendly free of charge data manipulation. Data are published as provisional and they are revised monthly as the response rate increases. Data are considered as provisional 10 months after the reference period.
14.2. Punctuality
There were two delays in the release of the Index of service and trade production. The January 2024 release, scheduled for 29 March 2024, was published on 5 April 2024 due to technical difficulties in the transition to a changed methodology. The March 2024 release announced for 30 May 2024, was published on 4 June 2024 due to technical difficulties in preparing the data for publication.
15.1. Comparability - geographical
With the Regulation (EU) No 2019/2152 (European Business Statistics Regulation, EBSR) the calculation of monthly indices of services production became mandatory for Member States of the European Union (EU) in 2021. This ensures good comparability of data between countries and good quality of aggregates calculated from these data at the EU level.
15.2. Comparability - over time
Data for most of the activities are available from January 2010. Until the end of 2024, the length of the series is 180 months. Data for activities L68 Real estate activities, N77 Rental and leasing activities, and N81 Services to buildings and landscape activities are available from January 2015, so until the end of 2024, the length of the series for these activities is 120 months.
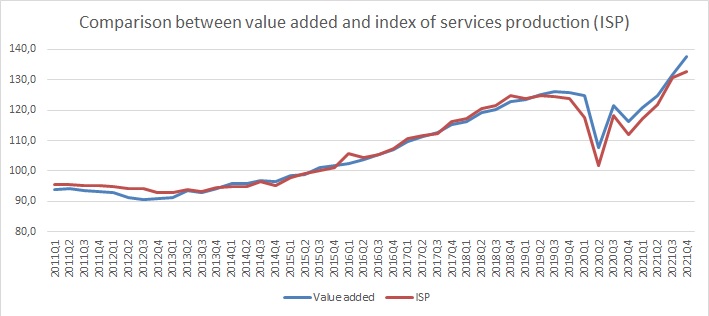
15.3. Coherence - cross domain
Value added data from the quarterly Gross domestic product (GDP) statistical survey are used as a reference source. The sum of value in current prices (seasonally and working-day adjusted) for activities G, H, I, J, L, M and N are recalculated to indices with 2021 average as a base. The index of service production with the 2021 base year (seasonally and working-day adjusted) is recalculated to the quarterly average. The absolute value of the difference between the indices for each quarter is the value of indicator on coherence with the reference source.
15.4. Coherence - internal
Data are internally coherent. Each level of aggregated data is compiled directly from micro data.
Because Index of Service Production (ISP) survey uses the data from other surveys (Turnover in services; Turnover in retail trade, sale and maintenance of motor vehicles; Turnover in wholesale trade), there is no time spent for activities such as selection of enterprises in the sample, preparing the address book and designing, printing and distribution of notification letters. Therefore, the burden compared to other surveys is reduced. Activities such as data verification, calculation of the results and their publication, plus calculation and verification of weights in the beginning of the year took about 820 working hours in 2024.
17.1. Data revision - policy
Types of data revisions in relation to planning:
a) Planned data revision is subject to the following reasons:
due to the needs of users for timely information, data are published that meet the criteria of the quality of official statistical data, but do not meet the quality that can be met with additional statistical procedures. Final data are based on more complete answers about the phenomenon and/or analyses and are published later on
seasonal adjustment and/or elimination of calendar effects
change in methodology and classifications
due to change of base year.
b) Unplanned data revision is not part of the regular statistical process. It appears due to unpredictable changes in the methodology, unpredictable emergence of new and better data, unpredictable changes regarding reporting units that transmit their data to the Office, unpredictable obstacles in data processing and publishing, and errors in data processing and publishing (e.g. a key unit corrects its data for the past few months, an unpredictable change in the administrative data source).
Types of data revisions in relation to time of implementation:
a) Regular revisions: inclusion of a more complete/additional data source or a change in the data source, seasonal adjustment and/or elimination of calendar effects; b) Occasional revisions are a consequence of including a new/more complete/additional data source that becomes the standard in later data releases or a consequence of an unpredictable obstacle in data processing and publishing, and change in methodology.
Types of data revisions in relation to the purpose:
a) Inclusion of a more complete/additional data source or a change in the data source; b) Seasonal adjustment and/or elimination of calendar effects; c) Transition to a new base period; d) Improvement of methodology due to a change in the statistical method or a change in classifications, concepts and definitions; e) Elimination or errors.
Same revision policy is applied nationally and in transmissions to Eurostat.
17.2. Data revision - practice
Data revision of Index of Service Production is planned. Published data do meet the criteria of the quality of official statistical data required by the Council Regulation (EC) No 1165/98 and needs of users for timely information, but do not meet the quality that can be met with additional statistical procedures. Regular revisions of Index of Service Production data include a more complete data source (because of late unit response or updates of data for the previous months or inclusion of VAT data in Turnover in services, Turnover in retail trade, sale and maintenance of motor vehicles and Turnover in wholesale trade) and change of data due to seasonal adjustment and elimination of calendar effects. Data published for the last 10 months are provisional. With each release on a monthly basis the data for the last 10 months can be corrected and supplemented with new data. Due to change of the base year a revision is planned every five years.
Data was last revised due to change of the base year in 2018 (base year = 2015) and in year 2024 (base year = 2021). There is no impact of the base year change since we use a a chain linking in calculation of index. Changes and revisions of methodology are announced in advance in our publications. Before that, the Advisory Committee discusses the proposed methodological changes. In a revision due to an error in data, a new edition with explanatory notes is published as soon as possible. Due to changes in the data of some enterprises, an unplanned revision was carried out in October 2021 regarding the G46 data for the years 2019, 2020, and part of 2021. With the release for January 2024, we transitioned to a new observation unit – the kind of activity unit (KAU). The data were revised up to and including January 2021 and are published at the level of the new observation unit. Data prior to this period differ and are published at the enterprise level. With the release for February 2024, in accordance with Eurostat recommendations, the data for the period before 2021 were recalculated using the average of the base year 2021 at the enterprise level. Previously published data had been calculated using the average of the base year 2021 at the kind of activity unit (KAU) level. The data from 2021 onwards continue to be calculated at the latter level.
Mean Revision (MR) and Mean Absolute Revision (MAR):
ACTIVITY
MR
MAR
GTN_STS
0.18
0.38
G
0.03
0.17
HTNXK
0.34
0.49
Note: The Mean Revision (MR) and Mean Absolute Revision (MAR) are calculated only using data for 2024 since the data for the years 2021 – 2023 were recalculated to the new observation unit (KAU) and released all at once with the first release for January 2024. The calculation of these two indicators using the data prior to 2024 is therefore meaningless.
18.1. Source data
The basis for calculating Index of Service Production are the data of the units that are observed in the statistical surveys on monthly turnover in services and trade. The data are obtained with the statistical surveys: Turnover in services, Turnover in retail trade, sale and maintenance of motor vehicles and Turnover in wholesale trade, namley by use of monthly electronic questionnaires.
18.2. Frequency of data collection
Monthly.
18.3. Data collection
In case of the Turnover in services, Turnover in retail trade, sale and maintenance of motor vehicles and Turnover in wholesale trade statistical surveys, the turnover data for the most units (90%) are collected from the administrative VAT database of the Financial Administration of the Republic of Slovenia. Data for the largest units (10%) are collected by on-line questionnaire.
18.4. Data validation
Plausibility checks are already performed on the statistical surveys: Turnover in services, Turnover in retail trade, sale and maintenance of motor vehicles and Turnover in wholesale trade. After the calculation of indices of service production, checking on a macro level is also done. If corrections are necessary, they are done on previously mentioned surveys, before indices are recalculated.
18.5. Data compilation
The data are obtained with the statistical surveys: Turnover in services, Turnover in retail trade, sale and maintenance of motor vehicles and Turnover in wholesale trade.
The deflation of turnover in services and trade is carried out using appropriate price indices. Deflation is carried out at the micro level, i.e. each data item is individually divided by the appropriate deflator, and thus (in terms of price changes) all data are converted to the same time point.
For each current month compared to the base month (i.e. average of the previous year), individual indices of particular representative NACE Rev. 2 activity group are calculated directly from data on turnover. From individual indices, indices at higher levels (i.e. group, division and section indices of NACE Rev. 2) are calculated with weighted arithmetic mean. Each index is calculated with weights from the same base period. Weights are based on value added at factor cost from structural business statistics. Weights for the reference year T are based on structural business statistics data for year T-2. Monthly base index, which shows turnover changes in the current month compared to the average turnover of 2021, is calculated indirectly from this index using chain linking.
18.6. Adjustment
Seasonal adjustment is the main part of time series analysis. With seasonal adjustment, seasonal effects and calendar effects are removed, if they are significant. In this way, the data are simplified so that they can be more appropriately interpreted, because seasonal fluctuations can blur other important movements. JDemetra+ 2.2.0 software, TRAMO/SEATS method, is used for seasonal adjustment. In seasonal adjustment the guidelines of the European Statistical System are also taken into account. Whenever the original data are changed, the time series is seasonally adjusted once more. Models are revised in detail about once a year, taking into account the period available at that time. Since the COVID-19 pandemic, the models are checked monthly. If the model is changed, we strive to minimize the changes. The results of seasonal adjustment depend on the software, method and model used. In 2016 we started using JDemetra+ instead of Demetra+ 2.2.0 software. Time series models were carefully revised and, if necessary, changed. The entire period was taken into account. Due to software replacement and changed models there were no longer revisions in seasonal adjustment results. Selection of the model is manual, but some automatic tests are used for help (test for transformation, automatic detection of outliers, automatic selection of ARIMA model). For each new release of unadjusted data, the parameters of the models are re-estimated; the models mostly remain the same, but sometimes they are changed (e.g. an outlier at the end of a time series is added). Major changes of the models usually occur every few years. For each new release of unadjusted data, the whole seasonally adjusted time series are revised. Critical value for outlier detection depends on the time series, usually it si between 2.5 and 3.5. Most of the time series don't have the possibility of outlier detection. Filter length is automatically chosen. All the time series are seasonally adjusted directly. Residual seasonality is checked when the model is selected. Afterwards, residual seasonality diagnostics are taken info account. All the time series are seasonally adjusted directly, so seasonally adjusted data of an aggregate are not composed of seasonally adjusted data of its components. When models are selected or changed, connection between an aggregate and its components is taken into account (similar time series have similar models...).
No comment.
The index of services production (ISP) is a business indicator which measures the monthly changes of the price adjusted output of the services industries (excluding financial and public services).
29 August 2025
Index of service production measures the volume of sales in selected activities and is derived from turnover at current prices, which is converted into constant prices. Since the intention is to measure changes in the volume of gross output, data on added value from the survey on structural business statistics are used as weights in the calculation of the index of service production.
Turnover comprises the totals invoiced by the observation unit during the reference period, and this corresponds to market sales of goods or services supplied to third parties. Turnover also includes all other charges linked to the buyer, even if these charges are listed separately on the invoice. Turnover excludes VAT and other similar deductible taxes directly linked to turnover as well as all duties and taxes on the goods or services invoiced by the unit. Reduction in prices and discounts must be deducted. The sale for loan is registered in the month of invoicing.
Volume turnover is a turnover at constant prices. The conversion of data from current to constant prices is called deflation. Deflation of turnover in services and trade is carried out using appropriate deflators.
The observation unit is an enterprise. Some major enterprises are observed at a more detailed level, i.e. at the level of kind of activity units (KAU). These enterprises divide their turnover among main and one or more secondary activities, which is then included in suitable activity.
The basis for calculating the production index in service and trade activities is the data of the units that are observed in the surveys Monthly report on service activities, Retail trade, sale and maintenance of motor vehicles and Wholesale. Observation units in these surveys are selected based on threshold coverage. The criteria for the definition of units included in the surveys are the principal registered activity, annual turnover of the enterprise and the number of persons in paid employment according to the Statistical Register of Employment. The surveys cover all enterprises whose main activity is classified into one of the service activities within the sections G, H, I, J, L, M and N of NACE Rev. 2, that:
have annual turnover higher than EUR 180,000 for the units from previous coverage or EUR 300,000 for newly selected units
have annual turnover higher than EUR 90,000 and more than 2 persons in paid employment for the units from previous coverage or EUR 150,000 and more than 2 persons in paid employment for newly selected units
have more than 5 persons in paid employment.
Data on employed persons are obtained from the Statistical Register of Employment (SRDAP). These surveys include approximately 20,750 units.
National teritory of the Republic of Slovenia.
Reference Period: Month.
The over-coverage rate for 2024 is on average:
0.8% for wholesale and retail trade and repair of motor vehicles and motorcycles and
0.9% for service activities.
The under-coverage bias for 2023 is 0.2 for G45, 0.1 for G46, 0.4 for G47 and 0.6 for services (SBR data for 2024 are not available yet) and is a result of the procedure used for determination of frame population. It shows the difference between tha annual indices calculated from data of the Statistical business Register of Slovenia (SBR), taking into account the entire target population and annual indices calculated from SBR data taking into account the surveypopulation (coverage).
The average rate of coherence, measured in terms of the absolute difference of indices for services field units, is 0.2. For service activities, the average unweighted unit non-response rate is 10.4%, while the average weighted unit non-response rate is 3.9%.
Because of two different sources, we can talk also about field unit non-response rate and non-response rate for units whose data we get from the administrative source. In 2024 the non-response rate for field units was 4.8% for services and 2.4% for G. Non-response rate for units whose data we get from the administrative source was 11.0% for services and 5.3% for G.
The average imputation rate for the missing data and data obtained from administrative sources, which were at the stage of automated data editing marked as too prominent, is 10.4% for services, 7.1% for G45, 3.6% for G46 and 7.2% for G47.
Index.
The data are obtained with the statistical surveys: Turnover in services, Turnover in retail trade, sale and maintenance of motor vehicles and Turnover in wholesale trade.
The deflation of turnover in services and trade is carried out using appropriate price indices. Deflation is carried out at the micro level, i.e. each data item is individually divided by the appropriate deflator, and thus (in terms of price changes) all data are converted to the same time point.
For each current month compared to the base month (i.e. average of the previous year), individual indices of particular representative NACE Rev. 2 activity group are calculated directly from data on turnover. From individual indices, indices at higher levels (i.e. group, division and section indices of NACE Rev. 2) are calculated with weighted arithmetic mean. Each index is calculated with weights from the same base period. Weights are based on value added at factor cost from structural business statistics. Weights for the reference year T are based on structural business statistics data for year T-2. Monthly base index, which shows turnover changes in the current month compared to the average turnover of 2021, is calculated indirectly from this index using chain linking.
The basis for calculating Index of Service Production are the data of the units that are observed in the statistical surveys on monthly turnover in services and trade. The data are obtained with the statistical surveys: Turnover in services, Turnover in retail trade, sale and maintenance of motor vehicles and Turnover in wholesale trade, namley by use of monthly electronic questionnaires.
Monthly.
The publication schedule is fixed and announced in advance. The First Release is published 60 days after the end of the reference month. Data are at the same time also loaded into the SI STAT database on a website of the Statistical office of the Republic of Slovenia, created for user friendly free of charge data manipulation. Data are published as provisional and they are revised monthly as the response rate increases. Data are considered as provisional 10 months after the reference period.
With the Regulation (EU) No 2019/2152 (European Business Statistics Regulation, EBSR) the calculation of monthly indices of services production became mandatory for Member States of the European Union (EU) in 2021. This ensures good comparability of data between countries and good quality of aggregates calculated from these data at the EU level.
Data for most of the activities are available from January 2010. Until the end of 2024, the length of the series is 180 months. Data for activities L68 Real estate activities, N77 Rental and leasing activities, and N81 Services to buildings and landscape activities are available from January 2015, so until the end of 2024, the length of the series for these activities is 120 months.