Reference metadata describe statistical concepts and methodologies used for the collection and generation of data. They provide information on data quality and, since they are strongly content-oriented, assist users in interpreting the data. Reference metadata, unlike structural metadata, can be decoupled from the data.
Statistics Norway P.O.B 2633, St. Hanshaugen NO-0131 Oslo
1.6. Contact email address
Confidential because of GDPR
1.7. Contact phone number
Confidential because of GDPR
1.8. Contact fax number
Confidential because of GDPR
2.1. Metadata last certified
7 August 2025
2.2. Metadata last posted
7 August 2025
2.3. Metadata last update
7 August 2025
3.1. Data description
Name of indicator/ source: Index of industrial production (IIP). The index of industrial production refers to the overall production within extraction of crude oil and natural gas, manufacturing, mining and quarrying, and electricity, gas and steam supply.
3.2. Classification system
From 2008 Statistics Norway uses a revised industrial classification, SIC 2007 (Standard Industrial Classification). The classification corresponds to EU's revised industrial classification, NACE Rev. 2.
3.3. Coverage - sector
The activities covered are (SIC2007): Oil and gas extraction (Division 06, Group 09.1), mining and quarrying (Divisions 05, 07-08, Group 09.9), manufacturing (Section C), electricity and gas supply (Division 35); Annex A.
3.4. Statistical concepts and definitions
List and definition of variables: Monthly production output in quantity within the Divisions 05-17 (excluding Group 09.1 and Division 13-15), Division 19-24, Groups 27.3, 27.5, Division 31, 32 (excluding Group 32.5) and 35. Hours worked for full time workers are used for Group 09.1, Divisions 13-15, Division 18, 25-27 (excluding Groups 27.3, 27.5), 28-30, Group 32.5 and Division 33. The total number of employed persons, including both full time and part time employees is also collected. Numbers of hours worked for contracted workers are collected from 2011. Numbers of hours worked from the officials are collected from 2014. As of 2015 these are included in the reporting and the calculations. In addition, the monthly turnover is also collected. The index aims to follow the monthly changes in the volume of industrial production.
There are no planned changes in information collected.
The production data covers the reference calendar month.
3.5. Statistical unit
The reporting unit is Local Kind of Activity Unit (LKAU) or the Enterprise.
The observation unit is mainly Local Kind of Activity Unit (LKAU), and in some cases the Enterprise.
3.6. Statistical population
The population covers all establishments in mining and quarrying (SIC 05, SIC 07-08, SIC 09.9), oil and gas extraction (SIC 06, 09.1), manufacturing (SIC 10-33) and electricity and gas supply (SIC 35).
The population frame is defined by all active LKAUs in The Central Register of Establishments and Enterprises. The total number of LKAUs in 2018 was about 19600.
3.7. Reference area
The geographical area covered is national level only: Norway including Svalbard and the Norwegian continental shelf.
3.8. Coverage - Time
The index of industrial production has been compiled and published since 1933.
3.9. Base period
The year on which the weights for 2024 are based on, is 2023. The weights are updated annually.
The reference year in the data transmitted to Eurostat is 2021.
The current reference year for national publishing is 2021.
Index.
Long-term indices: The ratio of the production volume for a given month compared with the production volume in the base year.
This will show the growth or drop in the production volume in a given month since the base year.
The reference period of this report is month.
6.1. Institutional Mandate - legal acts and other agreements
Regulation (EU) 2019/2152 of the European Parliament and of the Council on European business statistics, repealing 10 legal acts in the field of business statistics (EBS-Regulation)
Commission Implementing Regulation 2020/1197 laying down technical specifications and arrangements pursuant to Regulation (EU) 2019/2152 of the European Parliament and of the Council on European business statistics repealing 10 legal acts in the field of business statistic (General Implementing Act)
6.2. Institutional Mandate - data sharing
STS data from the industrial production in Norway are transmitted to Eurostat on a regular monthly basis.
7.1. Confidentiality - policy
Confidential micro data: According to § 2-7 of the Statistics Act of 21th June 2019 No. 32, collected data are subject to secrecy and are to be kept or destroyed in a secure manner. Any use of the data must be in accordance with the rules set out by the Data Inspectorate.
Time series that are not to be published: The publication of data is subject to the provisions of § 2-7 of the Statistics Act of 21th June 2019 No. 32. The main rule is that data should not be published if they can be traced back to the respondent, i.e. figures for which less than three respondents make up the foundation for a cell in the table, figures where one respondent represents more than 90 per cent of the total value, or figures where two respondents represent at least 95 per cent of the total value.
7.2. Confidentiality - data treatment
In data transmitted to Eurostat some series are marked as confidential. This applies to the 2-digit NACE Rev. 2 levels: 05, 12 and 19.
In the national dissemination the levels of details are aggregated sufficiently to assure that aggregates are not confidential.
8.1. Release calendar
The publication schedule is pre-released in Statistics Norway's advance release calendar.
Figures for annual changes are published yearly in a separte article. The article is usually published in February the following year, when figures for all 12 month are avaliable.
The figures are published at the 2-digit NACE Rev. 2 level or higher aggregates and for the main industrial groupings.
10.3. Dissemination format - online database
Index of industrial production is available in Statistics Norway’s Statbank (accessible from the statistics home page). The indices are available from January 1990. The series are available as unadjusted (gross), calendar adjusted, seasonally adjusted and trend series (smoothed seasonally adjusted).
10.4. Dissemination format - microdata access
Microdata can be supplied from Statistics Norway’s data collections for research purposes.
10.5. Dissemination format - other
Data are sent to Eurostat to be released as national data.
10.6. Documentation on methodology
Documentation on methodology and sources in preparing statistics are available on: Index of industrial production (About the statistics)
10.7. Quality management - documentation
Documentation on quality management are available on: Index of industrial production (About the statistics and About seasonal adjustment)
There are also some internal quality reports and studies available on the Index industrial production made by Statistics Norway.
11.1. Quality assurance
The statistics is produced according to Statistics Norway’s implementation of the European statistics code of practice ( Overview - Quality - Eurostat (europa.eu) )
Best practice is in use in seasonal adjustment of the index of industrial production in Norway. Self-assessments and some quality checks are being made in the calculation of the index of industrial production in Norway.
11.2. Quality management - assessment
The index of industrial production may possibly have a minor quality problem or deficiencies when hours worked are used as indicator of production.
This is related to the fact that some establishments may report number of hours worked that deviate from regular calendar months.
This is also related to the adjustments of changes in productivity from year to year.
12.1. Relevance - User Needs
The Index of industrial production is used in both the monthly and the quarterly national accounts in Statistics Norway to help calculate the gross domestic product in the industries covered. It is also reported to Eurostat as part of international statistical cooperation.
It is also an important input to forecasts on the industrial production carried out by other authorities and organisations in Norway.
12.2. Relevance - User Satisfaction
The figrures and the quality of the Index of industrial production are discussed with the division of National accounts in Statistics Norway on a quarterly basis.
In addtion, a yearly quality measurement is conuducted with the Division for structural business statistics.
12.3. Completeness
The index of industrial production in Statistics Norway has full compliance according to the STS-regulation in reporting numbers to Eurostat.
13.1. Accuracy - overall
sampling errors:"negligible"
coverage errors:" negligible"
non-response:"small"
measurement errors: "small"
data processingerrors: "negligible"
modelling errors:"small"- For some months it may be difficult to adjust for all the impacts from movable public holidays.
13.2. Sampling error
Sampling errors refer to uncertainties that occur in sample surveys as opposed to full counts. The sample variance equals the expected deviation between a sample survey and a full count. The index of industrial production covers about 80 per cent of the turnover in the population (2012). In order to ensure a high degree of relevance at the lowest cost possible, great effort is put into including all large units in the population in the sample. No calculations of the sampling errors for the survey have been conducted. The survey will normally try to correct for major new enterprises in the population by routine checks.
Coverage errors refer to errors in registers that define the population, in this case the central register of establishments and enterprises; Statistics Norway. As a result of such errors, units may be incorrectly included in or excluded from the population. Other problems are related to delays in the update of the registers and units that are incorrectly classified. From experience, a limited share of the population units is incorrectly classified. This is usually due to misleading or insufficient information at a certain time. No calculations on the size and significance of such errors have been carried out. However, such errors are not considered to be greater than for other quantitative short-term statistics.
13.3. Non-sampling error
Model errors are mainly related to problems with the seasonal adjustment of time series. Such problems are caused by deviation from the conditions that form the basis for the model used. Typical problems are related to public holidays such as Christmas and Easter. X12-ARIMA generates a number of indicators that are used to evaluate the quality of the seasonal adjustment. These indicators have identified a stable seasonal pattern for the main aggregates.
Measurement errors are caused by the questionnaire or the respondent’s internal system for obtaining the data. Examples are ambiguous questions, misunderstood questions or erroneous data from the respondents. In the Production Volume Index, errors in reported figures may originate from misunderstandings of the concept of production or the definition of the main variables used in the survey. Unambiguous guidelines and definitions are therefore emphasised.
Processing errors may occur when Statistics Norway processes the data. However, data from electronic questionnaires are loaded directly into the system. Considerable deviations from previous periods will normally become evident during the editing of the data.
Errors of non-response refer to errors that either occurs due to missing questionnaires or empty boxes in the questionnaire. The response rate after the deadline has expired is around 95 per cent. Critical units, i.e. units that have a considerable impact on the results on a detailed level aggregation (2-digit NACE), are contacted by telephone. Missing questionnaires or empty boxes in the questionnaires are mainly imputed automatically, based on previous reported figures (cold-deck method). No calculations of non-response errors have been made. Non-response error; Updated with weighted non-response for 2024; 0.87 percent.
Unit non-response rate of first estimtaes:
The Norweigan IIP uses a sample survey for the following industries: NACE05, NACE 07-08 and NACE 09.9 ( Mining and Quarrying), NACE 09.1 (Support activites for petroleum extraction) and NACE 10-33 ( Manufacturing).
For NACE 06 ( Oil and gas extraction) and NACE 35 ( Electricty supply) the whole population is covered, and the data is provided by other sources ( see section 18.1 for more information).
The calculation of the unit non-response is only based on the sample survey units. In order to calculate the weighted unit non-response, turnover figures from the annual structual business statistics are used (SBS). The unit non-response rate of first etimates for 2022 is 1.0 per cent.
14.1. Timeliness
The questionnaires are made available electronically to the units at the end of the reference month.The deadline for answering the questionnaire is normally the 15th of the following month. Establishments that fail to return the questionnaire receive a compulsory fine within a week of the deadline, whereupon a new deadline of seven days is set.
The index of industrial production is published approximately 5 weeks after the end of the reference month. The release occurs on the 5th working day each month. All aggregates and variables are released simultaneously.
14.2. Punctuality
All releases delivered on time based on scheduled release dates.
15.1. Comparability - geographical
The same statistical concepts are applied in the entire national territory. There are no major problems in the index of industrial production as far as comparability with countries in the EU is concerned.
The index of industrial production provides no regional data from Norway.
15.2. Comparability - over time
As from January 2009 all results will refer to Standard Industrial Classification 2007 (SIC2007). The historical series are recalculated according to this version of SIC, and results dating back to 1995 and 1990 (totals) are available in the Statbank database.
Historical series based on SIC2002 remain available in the Statbank database under Completed time series. However, as from January 2009, only series based on SIC2007 will be continued.
15.3. Coherence - cross domain
The primary goal of the Index of Industrial Production (IIP) is to monitor the development of added value within oil and gas extraction, manufacturing, mining & quarrying, and electricity supply, and is one of several indicators that monitor the performance of the economy. Figures from the IIP are aslo used as input in the Quarterly national accounts. The correlation with the following statistics is utilized for control purposes:
The Statistics on turnover for Oil and gas extraction, mining and quarrying, manufacturing, electricity and gas supply and the Index of Industrial Production (IIP) have a joint data collection.
15.4. Coherence - internal
There are no major internal inconsistencies in the calculation of unadjusted numbers in index of industrial production in Norway.
For seasonally adjusted data a direct approach where the raw data are aggregated and the aggregates and components are then directly seasonally adjusted using the same approach and software. Any discrepancies across the aggregation structure are not removed. An exception is the overall index which is a formula of extraction and related services, manufacturing, mining and quarrying and electricity, gas and steam supply, which ensures consistency.
There is no updated information about the costs of production of the statistical data in the index of industrial production or the burden of the respondents.
17.1. Data revision - policy
Released figures from the index of industrial production are normally not revised. For seasonally adjusted figures minor revision may occur for earlier releases. The same revision policy is applied both to national releases and in transmissions to Eurostat.
Regular revisions analyses and benchmarking is not carried out, and a revison calendar does not exist.
17.2. Data revision - practice
General:
Information about revisions and advance notice of major changes in methodology is provided. There is also included information in the press release at the time of releasing revised figur.
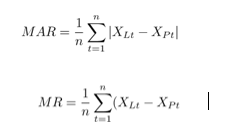
Quality indicators:
The quality indicators used are MAR (Mean Absolute Revision) and MR (Mean Revision). The formulas used to calculate these QIs are defined as:
The computed values for the QIs in 2024 are:
YoY growth rate for unadjusted series:
MR=0 , MAR=0
YoY growth rate for calendar adjusted series:
MR=0.44 , MAR= 0.45
PoP growth rate for seasonally adjusted series:
MR= 0.52 , MAR= 0.88
The calculations of the QIs are conducted in the software programme SAS EG.
18.1. Source data
The survey uses production data collected by questionnaires from the units included in the sample. The sample is based on Statistics Norway’s Central register of establishments and enterprises. This applies for the following industries: NACE 05,NACE 07-08 and NACE 09.9 (Mining and Quarrying), NACE 09.1 (Support activites for petroleum extraction) and NACE 10-33 ( Manufacturing).
Monthly production figures on oil and gas extraction (NACE 06) in Norway are transmitted electronically by the Norwegian Petroleum Directorate. Production figures for electricity supply (NACE 35) are provided by El-Hub, an electronic data- hub developed and operated by Statnett AS ( the Norwegian grid operator).
The sample includes about 1,800 establishments/LKAUs (2018), which includes all establishments with 100 employees or more, or with a turnover of at least 10 per cent of the publishing level. The remaining units are drawn based on stratification and optimal allocation, proportional to the size of the unit measured by the number of employees. The sample does not include establishments with less than ten employees. In addition, the whole population within electricity, gas and steam as well as within extraction of crude petroleum and natural gas is covered. The sample is updated annually.
Strata Proportion %
100 or more persons employed 100
50-99 persons employed 50
29-49 persons employed 33
10-19 persons employed 17
Less than 10 persons employed None
18.2. Frequency of data collection
Data are collected on a monthly basis, and the data refer to the full reference period.
18.3. Data collection
The survey is based on data collected by questionnaires. The questionnaires are returned electronically via Altinn. The questionnaire is made available online at the end of the reference month. The deadline for answering the questionnaire is normally the 15th of the following month. Establishments are notified by SMS or e-mail when the questionnaire is available in Altinn. The establishment's local office fills in the questionnaire. Establishments that fail to return the questionnaire receive a compulsory fine within a week of the deadline, whereupon a new deadline of seven days is set.
The questionnaires are downloaded from Altinn, and the data are automatically checked for duplicates. Where there are significant deviations, the establishment is contacted. In cases of extreme deviations, further editing is carried out. Comparisons with the annual industrial statistics are also carried out.
The Index of Industrial Production (IIP) has a joint data collection with the statistics on Turnover for Oil and gas extraction, mining and quarrying, manufacturing, electricity and gas supply.
18.4. Data validation
The questionnaires are downloaded from Altinn, and the data are automatically checked for duplicates. Where there are significant deviations, the establishment is contacted. In cases of extreme deviations, further revisions are carried out. HB method or the quartile method is in used to control the extreme values for the LKAUs.
The structure of the file and the format of the data transmitted to Eurostat is checked (validation level 0).
Intra-dataset and inter-dataset checks are done in the Index of Industrial production as well as time series checks (validation level 1, 2 ).
Plausibility or consistency checks between domains available in Statistics Norway and the Index of industrial production are carried out (validation level 4).
Plausibility or consistency checks between the index of industrial production and information available outside Statistics Norway are made to some degree (validation level 5).
18.5. Data compilation
Critical units and non-response:
The critical units are contacted to reduce the unit non-response. The non-responses (both partial and unit) are imputed by values based on the observed/imputed values for the previous months for the same unit and the month on month changes and year on year changes within the relevant sector. No grossing is done - the complete or imputed sample is used for compiling the index.
First stage of index compilation:
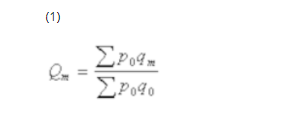
Estimated production values in fixed prices are calculated for the observation units. For the first stage, the indices at group or processing level are estimated by summing up these production values. The values of the reference period are then set in relation to the value of period t-1. The values of period t-1 are estimated average production values from the previous year. This provides the short-term index for the current month.
where
Qm = short term index of production value in fixed prices for month m
p0 = price in the previous year
qm = quantity in reference period
q0 = average monthly quantity in the previous year
The prices in the calculation of the short-term index are derived from statistics of external trade in goods, indicies of volume and price as well as the producer price index of oil and gas, manufacturing, mining and electricity in Norway. Some prices are also collected directly from the relevant enterprises in Norway, if not available in the statistics stated above. The prices are updated yearly.
Production is measured using two types of indicators - reflecting (more or less) the change in gross production/turnover. The indicators are physical output and hours worked. The production is measured by physical output in the following industries (SIC 2007: 05-08, 10-12, 16-17, 19-24, 27.3, 27.5, 31, 32 (ex. 32.5) and 35)). The calculations follow a set of identical observation units over a period of 2 years and an activity classification (SIC 2007). No adjustments are made for quality changes in the relevant products over time.
The production is measured by hours worked in the engineering industries (SIC 2007: 25-27 (ex. 27.3 and 27.5), 28-30, 32.5 and 33)) and in publishing and printing (SIC 2007: 18). The production is also measured by hours worked in support activities from petroleum and natural gas extraction (SIC 2007: 09.1) from 2010 and in manufacturing of textiles, wearing apparel and leather and related products (SIC 2007: 13-15) from 2011.
New projects in industries with hours worked as indicator are intercepted as they start up, as long as the project is carried out by establishments covered by the sample. It is the total number of hours carried out in the survey period that are reported, independent of which project the hours are used on.
Numbers of hours worked from contracted workers are collected from 2011. Numbers of hours worked from contracted workers are included in the calculation of the index of production from 2012. Numbers of hours worked from the officials are collected from 2014. As of 2015 are these included in the reporting and the calculations.
Change in productivity from year to year is taken into account, by fixed factors, when using the work input as basic information for compiling the index. The use of this type of indicator implies that output changes proportionally with input.These factors are updated in 2017 and are based on numbers from Annual final national accounts. Value added per hour worked in basic value, annual change in volume in per cent from the last 5 years are used.
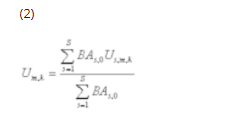
Second stage of index compilation: Index of Industrial Production at higher aggregation levels:
Production indices for the industries at the 4-digit level can be aggregated according to the hierarchical structure of NACE Rev. 1 to indices at higher levels and also to main industrial groupings (See Defenitions). The share of added value of each class in the base year is used for the calculation of the aggregates. Last available value added from structural data are forcasted to base year by numbers from quarterly national accounts. In the case of a chain index, such as the Production Volume Index, the weights are updated annually.
where
Um,k = unadjusted short-term index aggregated over the underlying sectors, month m
BAs,0 = added value at factor cost, sector s, weight-year (t-1)
Us,m,k = unadjusted short-term index of sector k and month m
The calculation applies a Laspeyres formula.
Chaining to long-term indices:
Unadjusted short-term indices will be chained to the long-term index (base 2005) at various levels. This must be done because the bases of the short-term indices and the weights change once a year, and to evaluate the results of the index calculation over time. Chaining to the long-term indices is done using the following formula:
where
Um,k = short-term index, unadjusted, month m
Um,l = long-term index, unadjusted, month m
Ut-1,l = long-term indices, unadjusted, average last year
There are no planned changes in the productions methods.
18.6. Adjustment
Calendar and seasonal adjustment:
Monthly time series are often characterised by considerable seasonal variations. In addtion moving holidays and number of working days may also impact the figures. Hence this might complicate their interpretation. Such time series are therefore subjected to a process of seasonal and calendar adjustment in order to remove the effects of these seasonal fluctuations. Once data have been adjusted for seasonal and calendar effects by X-12-ARIMA or some other seasonal adjustment tool, a clearer picture of the time series and the changes in the time series emerges.
For the index of industrial production calendar and seasonal adjustment are made on the overall index, divisions and groups according to the SIC 2007 as well as indices classified according to EUROSTAT's end-use categories (Main Industrial groupings MIG's). The X12 ARIMA model is used for calendar and seasonal adjustments. The Norwegian calendar is in use. Smoothed seasonal adjusted index (trend) is also calculated as well as three-month moving averages for seasonal adjusted indices.
For more details on seasonal adjustment and quality indicators, please refer to the section About seasonal adjustment.
Updated concepts: 2.1, 2.2 and 2.3
Concept: 3.9 Base period is updated to 2021
Concept: 13. 3 Non-response error; Updated with weighted non-response for 2024; 0.87 per cent
Name of indicator/ source: Index of industrial production (IIP). The index of industrial production refers to the overall production within extraction of crude oil and natural gas, manufacturing, mining and quarrying, and electricity, gas and steam supply.
7 August 2025
List and definition of variables: Monthly production output in quantity within the Divisions 05-17 (excluding Group 09.1 and Division 13-15), Division 19-24, Groups 27.3, 27.5, Division 31, 32 (excluding Group 32.5) and 35. Hours worked for full time workers are used for Group 09.1, Divisions 13-15, Division 18, 25-27 (excluding Groups 27.3, 27.5), 28-30, Group 32.5 and Division 33. The total number of employed persons, including both full time and part time employees is also collected. Numbers of hours worked for contracted workers are collected from 2011. Numbers of hours worked from the officials are collected from 2014. As of 2015 these are included in the reporting and the calculations. In addition, the monthly turnover is also collected. The index aims to follow the monthly changes in the volume of industrial production.
There are no planned changes in information collected.
The production data covers the reference calendar month.
The reporting unit is Local Kind of Activity Unit (LKAU) or the Enterprise.
The observation unit is mainly Local Kind of Activity Unit (LKAU), and in some cases the Enterprise.
The population covers all establishments in mining and quarrying (SIC 05, SIC 07-08, SIC 09.9), oil and gas extraction (SIC 06, 09.1), manufacturing (SIC 10-33) and electricity and gas supply (SIC 35).
The population frame is defined by all active LKAUs in The Central Register of Establishments and Enterprises. The total number of LKAUs in 2018 was about 19600.
The geographical area covered is national level only: Norway including Svalbard and the Norwegian continental shelf.
The reference period of this report is month.
sampling errors:"negligible"
coverage errors:" negligible"
non-response:"small"
measurement errors: "small"
data processingerrors: "negligible"
modelling errors:"small"- For some months it may be difficult to adjust for all the impacts from movable public holidays.
Index.
Long-term indices: The ratio of the production volume for a given month compared with the production volume in the base year.
This will show the growth or drop in the production volume in a given month since the base year.
Critical units and non-response:
The critical units are contacted to reduce the unit non-response. The non-responses (both partial and unit) are imputed by values based on the observed/imputed values for the previous months for the same unit and the month on month changes and year on year changes within the relevant sector. No grossing is done - the complete or imputed sample is used for compiling the index.
First stage of index compilation:
Estimated production values in fixed prices are calculated for the observation units. For the first stage, the indices at group or processing level are estimated by summing up these production values. The values of the reference period are then set in relation to the value of period t-1. The values of period t-1 are estimated average production values from the previous year. This provides the short-term index for the current month.
where
Qm = short term index of production value in fixed prices for month m
p0 = price in the previous year
qm = quantity in reference period
q0 = average monthly quantity in the previous year
The prices in the calculation of the short-term index are derived from statistics of external trade in goods, indicies of volume and price as well as the producer price index of oil and gas, manufacturing, mining and electricity in Norway. Some prices are also collected directly from the relevant enterprises in Norway, if not available in the statistics stated above. The prices are updated yearly.
Production is measured using two types of indicators - reflecting (more or less) the change in gross production/turnover. The indicators are physical output and hours worked. The production is measured by physical output in the following industries (SIC 2007: 05-08, 10-12, 16-17, 19-24, 27.3, 27.5, 31, 32 (ex. 32.5) and 35)). The calculations follow a set of identical observation units over a period of 2 years and an activity classification (SIC 2007). No adjustments are made for quality changes in the relevant products over time.
The production is measured by hours worked in the engineering industries (SIC 2007: 25-27 (ex. 27.3 and 27.5), 28-30, 32.5 and 33)) and in publishing and printing (SIC 2007: 18). The production is also measured by hours worked in support activities from petroleum and natural gas extraction (SIC 2007: 09.1) from 2010 and in manufacturing of textiles, wearing apparel and leather and related products (SIC 2007: 13-15) from 2011.
New projects in industries with hours worked as indicator are intercepted as they start up, as long as the project is carried out by establishments covered by the sample. It is the total number of hours carried out in the survey period that are reported, independent of which project the hours are used on.
Numbers of hours worked from contracted workers are collected from 2011. Numbers of hours worked from contracted workers are included in the calculation of the index of production from 2012. Numbers of hours worked from the officials are collected from 2014. As of 2015 are these included in the reporting and the calculations.
Change in productivity from year to year is taken into account, by fixed factors, when using the work input as basic information for compiling the index. The use of this type of indicator implies that output changes proportionally with input.These factors are updated in 2017 and are based on numbers from Annual final national accounts. Value added per hour worked in basic value, annual change in volume in per cent from the last 5 years are used.
Second stage of index compilation: Index of Industrial Production at higher aggregation levels:
Production indices for the industries at the 4-digit level can be aggregated according to the hierarchical structure of NACE Rev. 1 to indices at higher levels and also to main industrial groupings (See Defenitions). The share of added value of each class in the base year is used for the calculation of the aggregates. Last available value added from structural data are forcasted to base year by numbers from quarterly national accounts. In the case of a chain index, such as the Production Volume Index, the weights are updated annually.
where
Um,k = unadjusted short-term index aggregated over the underlying sectors, month m
BAs,0 = added value at factor cost, sector s, weight-year (t-1)
Us,m,k = unadjusted short-term index of sector k and month m
The calculation applies a Laspeyres formula.
Chaining to long-term indices:
Unadjusted short-term indices will be chained to the long-term index (base 2005) at various levels. This must be done because the bases of the short-term indices and the weights change once a year, and to evaluate the results of the index calculation over time. Chaining to the long-term indices is done using the following formula:
where
Um,k = short-term index, unadjusted, month m
Um,l = long-term index, unadjusted, month m
Ut-1,l = long-term indices, unadjusted, average last year
There are no planned changes in the productions methods.
The survey uses production data collected by questionnaires from the units included in the sample. The sample is based on Statistics Norway’s Central register of establishments and enterprises. This applies for the following industries: NACE 05,NACE 07-08 and NACE 09.9 (Mining and Quarrying), NACE 09.1 (Support activites for petroleum extraction) and NACE 10-33 ( Manufacturing).
Monthly production figures on oil and gas extraction (NACE 06) in Norway are transmitted electronically by the Norwegian Petroleum Directorate. Production figures for electricity supply (NACE 35) are provided by El-Hub, an electronic data- hub developed and operated by Statnett AS ( the Norwegian grid operator).
The sample includes about 1,800 establishments/LKAUs (2018), which includes all establishments with 100 employees or more, or with a turnover of at least 10 per cent of the publishing level. The remaining units are drawn based on stratification and optimal allocation, proportional to the size of the unit measured by the number of employees. The sample does not include establishments with less than ten employees. In addition, the whole population within electricity, gas and steam as well as within extraction of crude petroleum and natural gas is covered. The sample is updated annually.
Strata Proportion %
100 or more persons employed 100
50-99 persons employed 50
29-49 persons employed 33
10-19 persons employed 17
Less than 10 persons employed None
The frequency of national dissemination is monthly.
The frequency of transmission to Eurostat is monthly.
The questionnaires are made available electronically to the units at the end of the reference month.The deadline for answering the questionnaire is normally the 15th of the following month. Establishments that fail to return the questionnaire receive a compulsory fine within a week of the deadline, whereupon a new deadline of seven days is set.
The index of industrial production is published approximately 5 weeks after the end of the reference month. The release occurs on the 5th working day each month. All aggregates and variables are released simultaneously.
The same statistical concepts are applied in the entire national territory. There are no major problems in the index of industrial production as far as comparability with countries in the EU is concerned.
The index of industrial production provides no regional data from Norway.
As from January 2009 all results will refer to Standard Industrial Classification 2007 (SIC2007). The historical series are recalculated according to this version of SIC, and results dating back to 1995 and 1990 (totals) are available in the Statbank database.
Historical series based on SIC2002 remain available in the Statbank database under Completed time series. However, as from January 2009, only series based on SIC2007 will be continued.