Reference metadata describe statistical concepts and methodologies used for the collection and generation of data. They provide information on data quality and, since they are strongly content-oriented, assist users in interpreting the data. Reference metadata, unlike structural metadata, can be decoupled from the data.
Subdirección General de Estadisticas Coyunturales (S.G. Short-Term Statistics).
1.3. Contact name
Confidential because of GDPR
1.4. Contact person function
Confidential because of GDPR
1.5. Contact mail address
Instituto Nacional de Estadistica (INE)
Avenida de Manoteras 50-52
28050 Madrid
Spain
1.6. Contact email address
Confidential because of GDPR
1.7. Contact phone number
Confidential because of GDPR
1.8. Contact fax number
Confidential because of GDPR
2.1. Metadata last certified
8 May 2025
2.2. Metadata last posted
8 May 2025
2.3. Metadata last update
8 May 2025
3.1. Data description
The objective of the Industrial Production Indices (IPI, in Spanish Indice de Producción Industrial) is to show the monthly evolution of value added generated in different industrial activities and their aggregations at different levels of NACE rev 2 and in Main Industrial Groupings (MIG).
The results of this statistical operation are presented as indices that allow to measure variations taking as reference the base year 2021.
Indices and variation rates (monthly, annual, year-to-date average) are published monthly for the following breakdown:
Different levels of disaggregation for activities classified using the National Classification of Economic Activities (CNAE-2009): sections, divisions, groups and classes. CNAE-2009 is the Spanish version of the Statistical Classification of Economic Activities in the European Community (NACE Rev.2) and has been compiled according to the conditions set out in the Regulation establishing NACE Rev.2.
Main Industrial Groupings (MIGs): consumer goods (total and broken down in durable consumer goods and non-durable consumer goods), capital goods, intermediate goods and energy.
Autonomous Communities (NUTS2 except ES63 and ES64).
Most of the information previously mentioned is published, not only unadjusted, but also calendar adjusted and seasonally and calendar adjusted.
3.2. Classification system
For activities used the National Classification of Economic Activities CNAE-2009, which is the national version of NACE Rev. 2.0. at level fo Sections, Divisions, Groups and Classes.
For products, the Community Production Classification (PRODCOM) is used.
For disseminating data it is also used the Main Industrial Groupings classification (MIGs).
The geographical classification used is NUTS, at NUTS 2 level, for national stratification and dissemination.
3.3. Coverage - sector
Activities covered:
NACE Rev. 2 Sections B, C, D and division 36: "Water collection, treatment and supply" of section E. For sections B, C and D, indices are calculated at the level of Divisions, Groups and Classes or NACE Rev2.
Size classes covered:
There is no threshold, for any variable, in the register. In the IPI, cut-off sampling on the basis of production value for basket products of index is used and the sampled units cover for each product around 90% of the total value of that product according to the Annual Industrial Products Survey (PRODCOM) for the base year.
3.4. Statistical concepts and definitions
List and definition of variables:
The production indices are Laspeyres indices with a fixed base year.
The indices compiled for NACE clasification levels are weighted on the basis of gross value added at factor cost.
For selected basket industrial products the indices are weighted by the value of production. Each 4-digit activity -Class NACE- is represented by a basket of products selected from the PRODCOM list from base year.
The monthly production index aims to represent the evolution of gross value added at constant prices. For activities that represented 78% of industrial value added, the elementary indices are based on the volume of quantities produced. For 21% of the elementary indices, deflated values are used, and for the remaining 1% of the activities, the elementary indices are based on the number of hours worked.
The surveyed units represent 95% of the industrial value added. Every month around 12,000 local units surveyed provide the Spanish Statistical Office about 25,000 monthly basic data inputs. We calculate the indexes for basket products with this elementary data.
We calculate NACE indexes and other agreggates like weighted addition.
This statistic uses the definitions and procedures stablish by COMMISSION IMPLEMENTING REGULATION (EU) 2020/1197 of 30 July 2020 laying down technical specifications and arrangements pursuant to Regulation (EU) 2019/2152 of the European Parliament and of the Council on European business statistics repealing 10 legal acts in the field of business statistics.
3.5. Statistical unit
The Annex II of the EBS-Regulation (Regulation (EU) 2019/2152 of the European Parliament and of the Council on European business statistics, repealing 10 legal acts in the field of business statistics), requires the use of KAU (kind of activity unit) as observation units for indicators in the industry.
However, given the lack of an appropriate framework for these units, Spain collects the information from local units rather than from KAUs.
The reporting unit and the observation unit is the same.
3.6. Statistical population
The target population is all local units which manufacture industrial products in Spain.
The frame is the Annual Industrial Products Survey (PRODCOM) that have a sample of more than 38.000 industrial establishments.
According to Structural Business Statistics: Industrial Sector, in Spain, there were, in 2021, 194.308 companies which manufactured industrial products.
The sample size is approximately 12,000 local units
3.7. Reference area
This indicator provides data of the Spanish territory at a national level and by Autonomous Communities, excluding the Autonomous Cities of Ceuta and Melilla, where the industrial activity is non significant.
3.8. Coverage - Time
The time period covered by this indicator ranges from 1975 to the present.
Some activities started the indices after January, 1975, when INE started their analisys.
When the changes in the base year of the indices have occurred, indices of a greater number of NACE activities have been calculated.
3.9. Base period
The COMMISSION IMPLEMENTING REGULATION (EU) 2020/1197 of 30 July 2020 laying down technical specifications and arrangements pursuant to Regulation (EU) 2019/2152 of the European Parliament and of the Council on European business statistics repealing 10 legal acts in the field of business statistics, in the ANNEX VII establish the rules for Change of weightings and base year and transitional arrangements for the domain ‘short term business statistics’
In point 2 of Annex VII it establishes:
2. The first base year is 2015, the second base year is 2021 and the third base year is 2025. From thereon, every five years, Member States shall rebase the indices using as base years the years ending with a 0 or a 5. All indices must be rebased on the new base year within three years after the end of this new base year.
For this reason as from 2024 the data was disseminated in base 2021. For this base we have:
Base year, weights' reference year: 2021.
Reference year, year where the indices have as average 100: 2021.
The base and reference year are the same at national level and for the data transmitted to Eurostat.
The switching date for changing the base year to 2021 was January 2024.
Indices, percentage changes (%)
The reference period is the month.
6.1. Institutional Mandate - legal acts and other agreements
The legal basis for the Industrial Production index is:
Regulation (EU) 2019/2152 of the European Parliament and of the Council on European business statistics, repealing 10 legal acts in the field of business statistics (EBS-Regulation)
Commission Implementing Regulation 2020/1197 laying down technical specifications and arrangements pursuant to Regulation (EU) 2019/2152 of the European Parliament and of the Council on European business statistics repealing 10 legal acts in the field of business statistic (General Implementing Act)
The classification by main industrial groupings (MIGS) is set out in Annex II of Reg. 2020/1197
Before this legal base the rules for STS indicators was Council Regulation No 1165/98 of 19 May 1998 concerning short-term statistics, amended by Regulation No 1158/2005 of 6 July 2005 concerning short-term statistics. The Article 25.3 of Regulation (EU) 2019/2152 say Regulation (EC) No 1165/98 is repealed with effect from 1 January 2024
According to the Spanish legislation Industrial Production Index is a compulsory statistic.
The compilation and dissemination of data are governed by the Statistical Law No 12/1989 "Public Statistical Function" of 9 May 1989, and Law No 4/1990 of 29 June 1990 on "National Budget of State for the year 1990" amended by Law No 13/1996 "Fiscal, administrative and social measures" of 30 December 1996, makes compulsory all statistics included in the National Statistics Plan. The Plan contains the statistics that must be developed in the four year period by the State General Administration's services or any other entity dependent on it. All statistics included in the National Statistics Plan are statistics for state purposes and are obligatory. The National Statistics Plan 2021-2024, approved by Royal Decree 1110/2020, of 15 December 2020, is the Plan currently implemented. This statistical operation has governmental purposes, and it is included in the National Statistics Plan 2021-2024, which is available in the following webistes:
Industrial Production Indices are transmitted to Eurostat monthly, in order to produce the aggregates for the European Union and the Monetary Union.
They are transmitted quaterly to Industrial and Energy Statistics Section of UN Statistics Division.
The exchanges of information between the INE and the rest of the State statistical offices (Ministerial Departments, independent bodies and administrative bodies depending on the State General Administration), or between these offices and the Autonomous Communities Statistical Offices, are regulated in the Statistical Law No 12/1989 "Public Statistical Function". This law also regulates the mechanisms of statistical coordination and cooperation agreements between the different offices when necessary.
Other organisations or users can obtein the data from ine website:
The compilation and dissemination of the data are governed by the Statistical Law No. 12/1989 “Ley de la Función Estadística Pública” of 9 May 1989, and Law No. 13/1996 “Medidas Fiscales, Administrativas y del Orden Social” of 30 December 1996.
INE Spain Confidentiality Policy can be found in the following website:
Regulation (EC) No 223/2009 of the European Parliament and of the Council of 11 March 2009 on European statistics , of 11 March 2009, on the transmission of data subject to statistical confidentiality to the Statistical Office of the European Communities.
In accordance with the European Statistics Code of Practice, all users have access to the same statistical information at the same time, and any privileged pre-release access to any outside user must be limited, controlled and made public.
In this sense, a few hours before its official publication, some statistical information of the INE is transmitted, under embargo, to the appointed body, the Secretariat of State for Economic of the Ministry of Economy, for the purpose of providing sufficient time for their responsible parties to prepare answers to any possible questions that journalists might ask them.
Likewise, by virtue of the signing of the Multilateral Working Agreement for the development of a statistics partnership between the INE and the Central Statistics Offices of the Autonomous Communities (OCECA), sixteen OCECA receive information under embargo, relating to both their territory (at Autonomous Community level) and the national total (on a national scale), for the purpose of compiling and publishing, in parallel to the INE, press releases relating to their respective territorial scopes. As with the INE, the OCECA are governed by the Laws and regulations that guarantee statistical confidentiality.
The release policy doesn't determine the time at which data are disseminated. The dissemination policy is available in the following link: Statistical dissemination policy
The same release policy is applied to national releases and to transmissions to Eurostat.
Data are transmitted in SDMX-ML format to Eurostat at the moment of the national release. When the release of the data in Spain exceeds 40 days from the end of the reference month, we send the indices to EUROSTAT under embargo until the date of official release in Spain.
Monthly.
10.1. Dissemination format - News release
Monthly news releases are published at 9 a.m. at INE website.
The press release contains information about MIGs, sections B , C and D, and yours divisions, and division 36: "Water collection, treatment and supply" of section E. Unadjusted data, calendar adjusted data and seasonally and calendar adjusted data are disseminated,
The press release contais too the unadjusted indices for Autonomus Communities (NUTS2).
News release of last data published is available in the link:
The data are released simultaneously to all interested parties by issuing the press release “Indices de Producción Industrial”, which is posted on the INE’s website almost immediately after the press release is issued.
The news release “Indices de Producción Industrial” publishes detailed data for the reference month showing:
30 indices for the branches of the CNAE (NACE rev2) (sections, divisions)
6 indices for Main Industrial Groupings (MIGs) broken down according to the economic use of the goods (consumer goods, durable and non durable consumer goods, intermediary goods, equipment goods and energy)
the general index and the MIG calendar effects adjusted
the general index and the MIG seasonal and calendar effects adjusted
the general index by autonomous communities (Spain's regions)
The INE's TEMPUS database disseminates monthly time series data for the period since January 1975. For the Industrial Production Index, the TEMPUS data base contains the indices of NACE Sections (1 letter), Divisions (2-digits) and Groups (3-digits), and indices of MIGs. For these series the calendar effects, and the seasonal and calendar effects adjusted indices are also published. For Autonomous Communities the general index and the MIGs indices are published. The production index data can be accessed, free of charge, through the INE’s website.
Data are transmitted to Eurostat as soon as they are published nationally. When the release of the data in Spain exceeds 40 days from the end of the reference month, we send the indices to EUROSTAT under embargo until the date of official release in Spain.
The transmission to Eurostat is done via eDAMIS and in SDMX format.
10.6. Documentation on methodology
Documentation on methodology are published on the INE's website.
The Industrial Production Indices (IPI) is carried put according to the quality policy set out by INE Spain. This quality policy is in line with the European Code of Practice.
The quality guidelines followed at INE Spain can be found in the link:
The quality assurance framework for INE statistics is based on the ESCOP, the European Statistics Code of Practice. The ESCOP consists of 16 principles, grouped into three areas: Institutional Environment, Process and Products. Each principle is associated with a number of indicators to measure. In order to assess quality, different tools provided by Eurostat are used: the indicators mentioned above, the self-assessment, peer review, quality audits and user satisfaction surveys
The general quality assurance framework at INE Spain is available in the link:
The Industrial Production Indices (IPI) have a process designed to control and validate data quality throughout the entire process. There are validation controls in the electronic questionnaire, a data checking process in collection units and a control from the developer unit to ensure the quality of the statistic.
To reduce the non-response rate the sampled units are contacted by mail and/or telephone during the data collection period. Sampled units can be fined if they don't fulfil their statistical obligations.
Once the data is collected a selective editing phase takes place at microdata level.
11.2. Quality management - assessment
IPI are indicators of high statistical quality that meet all the criteria of consistency, comparability, accuracy and timeliness. The methodology follows the international recommendations of United Nations (UN), Eurostat and International Monetary Fund (IMF)
The entry into force of the Base 2021, in January 2024, has been a methodological improvement as it has actualiced the coverage of the branches studied and the basket of products; additionally, the weights have been updated to improve representativeness.
12.1. Relevance - User Needs
Among the main users it is worth noting:
Ministries and other public organisms;
Autonomous Communities;
Companies;
Researchers and universities;
Press;
EUROSTAT and other international organizations (ONU, OCDE, FMI,...).
It is used too as an indicator for the analysis of the economic activity. It provides information in order to know the activity short term behaviour of different industrial branches and their consequences for global economy.
12.2. Relevance - User Satisfaction
INE has conducted general surveys of user satisfaction in 2007, 2010, 2013, 2016 and 2019 and plans to continue doing so every three years. The purpose is to know the perception of users regarding the quality of the information they use and if their needs are covered.
The users’ specific needs are taken into account when methodological revisions are carried out in order to tailor the content of the survey to the specific requirements of its users, thereby increasing their levels of satisfaction.
In the Industrial Production Index base 2021, the requests of information made by users has been taken into account.
The results of the user satisfaction surveys can be found at:
Moreover, people in charge of the survey stay in contact with the main users and respondents in order to attend any specific needs of information.
12.3. Completeness
Industrial Production Indices (IPI) provide all the information required by the national and international regulations related to this statistical operation, so the rate of available statistics is R1=100%.
IPI covers all the relevant economic activities in Spain.
The IPI series start in January 1975.
13.1. Accuracy - overall
The accuracy is tackled at national and Community Autonomous (regions) levels by eliminating non-sampling errors as much as possible and studying and analyzing revisions.
The survey units group is designed with the cut-off method and therefore, there are no sampling errors. The main source of error is probably non-response. There is no evidence that the response rate is distributed in a way that generates a bias in the index or its evolution. As for non-sampling errors, different processes are directed to eliminate or reduce as far as possible such errors, both in the collection phase (response rate and debugging control) and subsequent editing and imputation. In addition, steps are taken to improve the updating of the survey units group, replacing, in a more agile way, units that have left the sample for others.
Due to the timeliness of the survey in the provisional data release the size-weighted non-response rate is around 7%. The questionnaires keep being required two months after the end of the reference month. If the respondent doesn't send it back by then he is fined. This way new questionnaires are recorded after the first publication of the results and the size-weighted non-response rate falls below to 3%. Another consequence is that the published results are updated monthly including both new or edited data.
Data editing consists on several phases throughout the process. The first one is microediting and takes place during the data collection. The e-questionnaire contains workflows and several hard and soft edits. It makes possible that the data are cleaned by the respondent and there is no need to recontact. Next step is a selective editing phase, where a set of units will be flagged in order to carry out an interactive editing just with these units. Finally the macroediting phase occurs, for the purpose of checking the results to be published.
During the whole data collection process the response rate is checked and attention is paid to get the data of the more influential units
All the processes are designed for reduce the bias and to achieve maxim accuracy.
13.2. Sampling error
Since a non-probability sampling is used (cut-off method), it is not possible to obtain sampling errors.
The sample is based on the cutoff method, which, given the nature of the sector, is considered the most appropriate. From a population of around 200,000 local units, a sample of approximately 12,000 are included in the sample.
The sample is updated monthly in order to include the new relevant units and delete the duplicated ones and also the final closures.
13.3. Non-sampling error
Different controls of non-sampling errors are carried out throughout the whole process.
Coverage: survey framework contains local units whose main activity is included in sections B, C, D or E of CNAE-2009. Revisions are made periodically with the aim of reaching 90% of coverage in industrial product volume in each class (4 digits level activity of CNAE-2009) as compared to the total estimated industrial product volume in the Industrial Companies Survey.
Survey instrument, respondent (and interviewer)
Our survey use simple questionnaires where it appears a contact person who could resolve any doubts about it. These contact persons work in INE during a long time and they are prepared to answer any questions.
Besides, we use various ways of collecting questionnaire. Mainly, the survey is collected by web and, secondly, by email or fax. Collection by phone or mail is residual. We use selective editing in web questionnaires, for it most of them have passed several editing controls and respondents should correct them or give us an explanation about their data.
When we received all data, these are revised using selective editing too. If an important error is detected we recontact with respondent again and we correct it.
Methods of collecting questionnaires:
Web: 92%.
Others: 8%.
Non-response:
Total non-response: Total size-weighted non-response rate is around 7% at the time of the initial release. The measures taken to reduce the non-response rate are: e-mail recontact to those informants who have not answered 7, 12 and 17 days after the end of reference month, increasing the period of data collection (without delaying the period of dissemination), sending specific information to those local units that provide information through the web questionnaire and request it and carrying out a more thorough follow up of the most influential units during the collection phase (these units are highlighted in the data collection application). The list of influential units is updated according to the weight of each local unit in the elementary aggregate it belongs to, in terms of production volume.
Partial non-response: non exist partial non-response at the time of the initial release. Previously, we recontact to those informants and questionnaire is completed.
Imputation: monthly productions of the units filling in the questionnaire in each elementary aggregate are imputed to those units of the same elementary aggregate that did not answer in the reference period. The size-weighted imputation rate is around 5%. Those are edited and estimated based on previous information from the same informant using automated calculation procedures. At the time of the initial release, size-weighted non-response and non-imputate rate is around 2%
Data editing: a first editing phase, at micro-data level takes place when the respondent fills in the e-questionnaire. During the data collection another micro-data level editing phase occurs including all data collection methods questionnaires. After that the selective editing is carried out. Finally the macro-data editing phase takes place.
Coding: no coding is necessary after the data collection phase. Identification variables are obtained from the survey frame and are automatically coding in the cuestionaire according to the CNAE-2009.
Impact of specific models used in estimation
In order to ensure the quality of the data adjusted, INE validates the data using the INE Standard quality measures: absence of auto-correlation, verify the appropriateness of the decomposition (specification) through the diagnoses provided by the SEATS program, verify the absence of residual seasonality in the deseasonalised series, verify the absence of residual calendar effects of the deseasonalised series.
Response rate or data availability
At the time of the initial release, the size-weighted response rate is around 93 %. Throughout the two subsequent publications continues to work on reducing non-response and analysis of imputations.
14.1. Timeliness
The Industrial Production Index is published 35 days after the end of the reference month, except for the reference months of July and November when they may be published up to 40 days after the end of the reference month.
Timetable of data collection:
On the last day of the reference month the identification number and its corresponding password are sent by e-mail to the sampled units so they can answer through the web questionnaire. Respondents asking to answer using other data collection method are provided with the electronic or paper questionnaire on demand.
Afterwards, the Central Office receive two data dispatches (around 15 and 25 days after the end of the reference month), in order to compile, edit, validate and disseminate the data around 35 days after the end of the reference month.
14.2. Punctuality
Results are published in accordance with the release calendar for short-term business statistics (see calendar).
The Industrial Production Index has always been published on the pre-announced release dates.
15.1. Comparability - geographical
Comparability among EU countries is ensured by the EBS-Regulation (Regulation (EU) 2019/2152 of the European Parliament and of the Council on European business statistics, repealing 10 legal acts in the field of business statistics) and its General Implementing Act (Commission Implementing Regulation 2020/1197 laying down technical specifications and arrangements pursuant to Regulation (EU) 2019/2152 of the European Parliament and of the Council on European business statistics repealing 10 legal acts in the field of business statistic). They provide these statistics with homogeneity regarding the rest of European Union countries, which disseminate the same information on their respective industrial sectors.
Their comparability within Spain is guaranteed since the survey is designed in a homogenous way for the whole geographical area and therefore its methodology, design, process of data collecting and data editing are the same. The same concepts are applied in the entire national territory and in all the economic activites.
15.2. Comparability - over time
The Industrial Production Indices were published for the first time in 1975. Since then there have been changes in the used classification as well as changes in the base year.
Since January 2009, the Statistical Classification of Economic Activities in the European Community, Rev. 2 (NACE-Rev. 2) is used. Indices are available since the beginning of the series with the new classification.
The changes of base have led to changes of some of the methodological aspects in the survey, which have led to a breach in the series which has been suitably treated to provide linked series from the first year of publication of the survey to the present date. Thus, the time series are comparable since their beginning.
For General index, MIG's and many NACE activities the series star in January, 1975 and there aren't breaks for these series.
15.3. Coherence - cross domain
The Structural Business Statistics: Industrial Sector is used in order to obtain the weights at NACE level.
The Industrial Products Survey (PRODCOM) is also used to select the basket of products which represent each NACE activity and to choose the surveyed units with a cut-off sampling method.
The data from this survey are confronted with the results of the Structural Business Statistics: Industrial Sector and the Industrial Products Survey (PRODCOM) in relation to their evolution and we analyse and try to explain the differences between them.
The surveyed units for Industrial Turnover Index are mostly the same as for the IPI and in the editing phase we check microdata in both surveys.
15.4. Coherence - internal
The Industrial Production Indices (IPI) are internally coherent. Higher level aggregations are derived from detailed indices like weight adds.
The estimated to produce this survey in 2024 is 1,330.53 thousand euros.
In order to significantly reduce the burden on respondents, large companies that complete multiple surveys in one year are assisted from a special unit which coordinates all their questionnaires.
The companies respondents can complete the questionaires in the web site of INE.
The statistical burden on reporting units is taken into account when changes are performed on the sample, in order to avoid overloading the time dedicated to its completion.
These cost and burden are due not only for STS needs, but also for national needs as well.
17.1. Data revision - policy
The general revision policy adopted by our organization and the data disseminated is published in our web site. You can find it in the following link:
The same revision policy applies to data disseminated nationally and to Eurostat.
Normally, the indixes of one month released would be revised for the next two months release.
The changes in indixes values after first release are due to new information received after the first release and in some occasions can be due to errors or modifications of original data
We keep indixes’ files with the different releases of this statistic (first and different versions) that permit study the magnitude of changes and the moment that they occur.
Major revisions are performed on the occasion of rebasing or methodological changes like changes in definitions and classifications as well as legal changes like those due to new Regulations or updates in the already existing.
The revision policy regarding seasonally adjusted data comprises two types of revisions:
- Concurrent adjustment: partially concurrent adjustment is carried out monthly. With the new data received:
Both the parameters of the ARIMA model and the parameters of the regressors for the correction of calendar effects and of the intervention variables of the outliers are re-estimated.
The filters to obtain the seasonally adjusted series are re-calculated.
- Current adjustment: annually the model (including the intervention variables of the outliers and the regressors for the correction of calendar effects) is identified, the parameters (of the ARIMA, of the regressors for the correction of calendar effects and of the intervention variables of the outliers) are estimated and the filters are calculated and set.
Regarding the revision for seasonally adjusted data is available in the following link:
Normally, the indices of one month released would be revised for the next two months release.
The size of media revisions for the last 36 monthly (starting in January 2022 and finishing in December 2024) of General IPI Index is 0.1602
The data are provisional when first released and are indicated as such. Although there is no regular revision policy, the data may be updated after the receipt of additional information from sampled enterprises. The revised data are disseminated on the INE's website and TEMPUS database, but there in no notification of when the data become final. The major changes in the methodology are announced in advance by the Annual Work Program which specifies the work for one year and is approved by Royal Decree in December of the previous year, but the new methodology in detail is disseminated only at the same time that the new data are released.
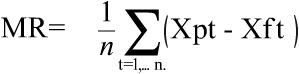
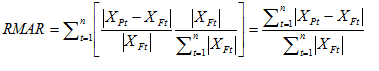
The Quality Indicators used in the data revision practice are: MAR (Mean Absolute Revision), RMAR (Relative Mean Absolute Revision) and MR (Mean Revision).
The mathematic expression for these QI are:
Where Xpt is the correpondent value at the moment of first release and Xft is the value of the same variable at the final release of the indices (last version).
The computed values for the last 36 monthly (starting in January 2022 and finishing in December 2024) General IPI Index are:
Growth rates for unadjusted data series (YoY):
MAR = 0.2938, RMAR =0.0828, MR = 0.0595.
Growth rates for calendar/working day adjusted (YoY):
MAR = 0.3008, RMAR = 0.1395, MR = - 0.0041.
18.1. Source data
The Industrial Production Indices are directed to local units whose main activity is included in Sections B, C, D or Division E36 of CNAE-2009.
The survey frame is the Central Directory of Enterprises, DIRCE (INE’s Business Register) and local units, generated from administrative records and updated with other information which comes from the ordinary statistical operations of the INE (e.g.: PRODCOM and SBS), has been used as the frame of the Survey.
The surveyed units represent 95% of the industrial value added. Every month around 12,000 local units surveyed provide the Spanish Statistical Office about 25,000 monthly basic data inputs.
The sample is updated continuously with closures and start ups. With this the sample maintains its size and coverage.
18.2. Frequency of data collection
Data are collected monthly. These data refer to the full month
18.3. Data collection
One specific questionnaire, the “Encuesta para la elaboración de los Indices de Producción Industrial" is used.
Data are collected by web questionnaire (around 92%), postal questionnaire, by electronic mail, by phone or by fax.
Data management is based on a relational database that allows automatic updating of the information concerning each enterprise in the panel as well as the output it is producing.
18.4. Data validation
In each collection unit all information requested in the questionnaire is checked and all incidents related to enterprises, establishments and productions completed are properly justified and explained. Next, a centralized data cleaning is done, in order to detect possible errors or unjustified prodcutions changes.
For these processes use specific software tools.
18.5. Data compilation
Missing data are estimated using available information for the same local unit in previous periods (previous month and same month of the previous year).
The production index is a Laspeyres index with a fixed base year.
The indices compiled by NACE are weighted on the basis of gross value added at factor cost. For selected industrial products the indices are weighted by the value of production. Each 4-digit activity is represented by a basket of products from the PRODCOM list.
18.6. Adjustment
For the seasonal adjustment of the series of the Industrial Production Indices, INE Spain has followed the established standard to adjust figures for seasonal and calendar effects. This standard is the result of the working group for seasonal adjustment created at INE in May 2012, and follows the recommendations included in ESS guidelines in seasonal adjustment. The link to INE standard is available in the following link:
Calendar effects are defined as the impact that occurs in the time series of a variable due to the different structures presented in the months (or quarters) of different years (both in length and composition), if maintained constant the other factors influencing this variable.
To overcome this problem and obtain comparable turnover series, these series are adjusted taking into account the following effects: working days, Easter and leap years. To collect these effects RegARIMA models with four centred variables of intervention for calendar effects have been used.
Once the calendar effects have been removed, indices are adjusted for seasonal effects. Seasonal fluctuations are movements that occur with similar intensity every month, every quarter or every season of the year and are expected to sustain over time.
Series adjusted for seasonal and calendar effects provide an estimate of the "new effects" in the series (changes in trend, cycle and irregular component).
Since base 2010, to complete the analysis of the situation, most series are disseminated not only unadjusted but also calendar adjusted and seasonally and calendar adjusted.
The software used for seasonal adjustment is JDemetra+ 2.2.2. And the method used is TRAMO/SEATS.
The models are revised annually and the regression coefficients are recalculated annually. The parameters and components are re-estimated monthly. The adjusted series are calculated on a monthly basis and the whole length of the time series is revised.
The direct adjustment is used, so there is no consistency amongst the different breakdown.
To assess the performance of the seasonal and calendar effect the following methods are applied:
Check the absence of residual correlation in the model residuals.
Check the decomposition through JDemetra+ diagnose.
Check the absence of residual seasonality and calendar effects.
Check the absence of residual calendar effects in the seasonal adjusted time series.
To assess the effects of the Covid crisis, the war in Ukraine and/or other unexpected situations, monthly automatic AOs are included in the models. Annually during the model analysis some of these AOs are changed to LS or TC.
More information about the seasonal adjustment (regressors, ARIMA models used, outliers, etc.) is available at INE Spain website in the section 18.6 of the following link:
The objective of the Industrial Production Indices (IPI, in Spanish Indice de Producción Industrial) is to show the monthly evolution of value added generated in different industrial activities and their aggregations at different levels of NACE rev 2 and in Main Industrial Groupings (MIG).
The results of this statistical operation are presented as indices that allow to measure variations taking as reference the base year 2021.
Indices and variation rates (monthly, annual, year-to-date average) are published monthly for the following breakdown:
Different levels of disaggregation for activities classified using the National Classification of Economic Activities (CNAE-2009): sections, divisions, groups and classes. CNAE-2009 is the Spanish version of the Statistical Classification of Economic Activities in the European Community (NACE Rev.2) and has been compiled according to the conditions set out in the Regulation establishing NACE Rev.2.
Main Industrial Groupings (MIGs): consumer goods (total and broken down in durable consumer goods and non-durable consumer goods), capital goods, intermediate goods and energy.
Autonomous Communities (NUTS2 except ES63 and ES64).
Most of the information previously mentioned is published, not only unadjusted, but also calendar adjusted and seasonally and calendar adjusted.
8 May 2025
List and definition of variables:
The production indices are Laspeyres indices with a fixed base year.
The indices compiled for NACE clasification levels are weighted on the basis of gross value added at factor cost.
For selected basket industrial products the indices are weighted by the value of production. Each 4-digit activity -Class NACE- is represented by a basket of products selected from the PRODCOM list from base year.
The monthly production index aims to represent the evolution of gross value added at constant prices. For activities that represented 78% of industrial value added, the elementary indices are based on the volume of quantities produced. For 21% of the elementary indices, deflated values are used, and for the remaining 1% of the activities, the elementary indices are based on the number of hours worked.
The surveyed units represent 95% of the industrial value added. Every month around 12,000 local units surveyed provide the Spanish Statistical Office about 25,000 monthly basic data inputs. We calculate the indexes for basket products with this elementary data.
We calculate NACE indexes and other agreggates like weighted addition.
This statistic uses the definitions and procedures stablish by COMMISSION IMPLEMENTING REGULATION (EU) 2020/1197 of 30 July 2020 laying down technical specifications and arrangements pursuant to Regulation (EU) 2019/2152 of the European Parliament and of the Council on European business statistics repealing 10 legal acts in the field of business statistics.
The Annex II of the EBS-Regulation (Regulation (EU) 2019/2152 of the European Parliament and of the Council on European business statistics, repealing 10 legal acts in the field of business statistics), requires the use of KAU (kind of activity unit) as observation units for indicators in the industry.
However, given the lack of an appropriate framework for these units, Spain collects the information from local units rather than from KAUs.
The reporting unit and the observation unit is the same.
The target population is all local units which manufacture industrial products in Spain.
The frame is the Annual Industrial Products Survey (PRODCOM) that have a sample of more than 38.000 industrial establishments.
According to Structural Business Statistics: Industrial Sector, in Spain, there were, in 2021, 194.308 companies which manufactured industrial products.
The sample size is approximately 12,000 local units
This indicator provides data of the Spanish territory at a national level and by Autonomous Communities, excluding the Autonomous Cities of Ceuta and Melilla, where the industrial activity is non significant.
The reference period is the month.
The accuracy is tackled at national and Community Autonomous (regions) levels by eliminating non-sampling errors as much as possible and studying and analyzing revisions.
The survey units group is designed with the cut-off method and therefore, there are no sampling errors. The main source of error is probably non-response. There is no evidence that the response rate is distributed in a way that generates a bias in the index or its evolution. As for non-sampling errors, different processes are directed to eliminate or reduce as far as possible such errors, both in the collection phase (response rate and debugging control) and subsequent editing and imputation. In addition, steps are taken to improve the updating of the survey units group, replacing, in a more agile way, units that have left the sample for others.
Due to the timeliness of the survey in the provisional data release the size-weighted non-response rate is around 7%. The questionnaires keep being required two months after the end of the reference month. If the respondent doesn't send it back by then he is fined. This way new questionnaires are recorded after the first publication of the results and the size-weighted non-response rate falls below to 3%. Another consequence is that the published results are updated monthly including both new or edited data.
Data editing consists on several phases throughout the process. The first one is microediting and takes place during the data collection. The e-questionnaire contains workflows and several hard and soft edits. It makes possible that the data are cleaned by the respondent and there is no need to recontact. Next step is a selective editing phase, where a set of units will be flagged in order to carry out an interactive editing just with these units. Finally the macroediting phase occurs, for the purpose of checking the results to be published.
During the whole data collection process the response rate is checked and attention is paid to get the data of the more influential units
All the processes are designed for reduce the bias and to achieve maxim accuracy.
Indices, percentage changes (%)
Missing data are estimated using available information for the same local unit in previous periods (previous month and same month of the previous year).
The production index is a Laspeyres index with a fixed base year.
The indices compiled by NACE are weighted on the basis of gross value added at factor cost. For selected industrial products the indices are weighted by the value of production. Each 4-digit activity is represented by a basket of products from the PRODCOM list.
The Industrial Production Indices are directed to local units whose main activity is included in Sections B, C, D or Division E36 of CNAE-2009.
The survey frame is the Central Directory of Enterprises, DIRCE (INE’s Business Register) and local units, generated from administrative records and updated with other information which comes from the ordinary statistical operations of the INE (e.g.: PRODCOM and SBS), has been used as the frame of the Survey.
The surveyed units represent 95% of the industrial value added. Every month around 12,000 local units surveyed provide the Spanish Statistical Office about 25,000 monthly basic data inputs.
The sample is updated continuously with closures and start ups. With this the sample maintains its size and coverage.
Monthly.
The Industrial Production Index is published 35 days after the end of the reference month, except for the reference months of July and November when they may be published up to 40 days after the end of the reference month.
Timetable of data collection:
On the last day of the reference month the identification number and its corresponding password are sent by e-mail to the sampled units so they can answer through the web questionnaire. Respondents asking to answer using other data collection method are provided with the electronic or paper questionnaire on demand.
Afterwards, the Central Office receive two data dispatches (around 15 and 25 days after the end of the reference month), in order to compile, edit, validate and disseminate the data around 35 days after the end of the reference month.
Comparability among EU countries is ensured by the EBS-Regulation (Regulation (EU) 2019/2152 of the European Parliament and of the Council on European business statistics, repealing 10 legal acts in the field of business statistics) and its General Implementing Act (Commission Implementing Regulation 2020/1197 laying down technical specifications and arrangements pursuant to Regulation (EU) 2019/2152 of the European Parliament and of the Council on European business statistics repealing 10 legal acts in the field of business statistic). They provide these statistics with homogeneity regarding the rest of European Union countries, which disseminate the same information on their respective industrial sectors.
Their comparability within Spain is guaranteed since the survey is designed in a homogenous way for the whole geographical area and therefore its methodology, design, process of data collecting and data editing are the same. The same concepts are applied in the entire national territory and in all the economic activites.
The Industrial Production Indices were published for the first time in 1975. Since then there have been changes in the used classification as well as changes in the base year.
Since January 2009, the Statistical Classification of Economic Activities in the European Community, Rev. 2 (NACE-Rev. 2) is used. Indices are available since the beginning of the series with the new classification.
The changes of base have led to changes of some of the methodological aspects in the survey, which have led to a breach in the series which has been suitably treated to provide linked series from the first year of publication of the survey to the present date. Thus, the time series are comparable since their beginning.
For General index, MIG's and many NACE activities the series star in January, 1975 and there aren't breaks for these series.