Reference metadata describe statistical concepts and methodologies used for the collection and generation of data. They provide information on data quality and, since they are strongly content-oriented, assist users in interpreting the data. Reference metadata, unlike structural metadata, can be decoupled from the data.
Name of indicator/source: Production index for construction
3.2. Classification system
The classification is based on NACE Rev. 2 and Classification of of types of construction (CC).
3.3. Coverage - sector
Activities covered : The index measures the activity of establishments in section F of NACE Rev. 2.
Size classes covered : All establishments within section F are covered, excluded self-employed. However, self-employed with more than one employees are included.
3.4. Statistical concepts and definitions
List and definition of variables: Hours worked: calculation of hours worked is estimated according to a formula from Statistics Norway’s Labour Accounts. The formula is used to calculate quantities for hours worked in the national accounts. The hours are calculated for each active employment. The hours are then aggregated on establishments and then on industry subclasses where the lowest level is 4-digit NACE. Hours worked by labour hired from employment agencies or employees on holiday, on strike, ill or laid off are not included.
Planned changes in information collected: None
Accounting conventions: The reference period is the month of the year
3.5. Statistical unit
Reporting unit : Establishment. An establishment is defined as a locally limited functional unit that mainly conducts business within a specific industry group (Standard for industry groupings).
Observation unit(s) : Establishments.
3.6. Statistical population
The Statistical population covers all activity in the construction industry section F. The observation unit is establishments.
3.7. Reference area
All regions of Norway are covered.
3.8. Coverage - Time
Date of first use as a source: The index goes back to the 1st quarter 1995 and was first published in 1996. The production index for construction changed frequency from quarterly to monthly publications from the statistical month January 2022 and onwards.
3.9. Base period
Base (reference) year : 2021
The production index is based on estimated hours worked in the construction sector as an input variable. The construction total index is calculated on the basis of an estimate of total hours worked. Monthly calculated hours worked in year t are compared with calculated hours in year t-1. This provides a basis for calculating the short-term index for the industry. An unadjusted short-term index of 105 then shows an increase of 5 percent compared to an average of last year's calculated hours.
In order for the aggregate indices to be able to absorb changes in the relative relationship between the industries, aggregated indices are calculated by weighing the short-term indices at the lowest level (4-digit NACE) together. Value added at factor prices from the statistics Structural business statistics for year t-3, is used as weights. The weights are updated annually.
The short-term index is chained to the average long-term index from the previous year. This must be done to be able to compare the indices over time. Chained indices are calculated with reference year 2015 for industry section F
Month
6.1. Institutional Mandate - legal acts and other agreements
Regulation (EU) 2019/2152 of the European Parliament and of the Council on European business statistics, repealing 10 legal acts in the field of business statistics (EBS-Regulation)
Commission Implementing Regulation 2020/1197 laying down technical specifications and arrangements pursuant to Regulation (EU) 2019/2152 of the European Parliament and of the Council on European business statistics repealing 10 legal acts in the field of business statistic (General Implementing Act)
6.2. Institutional Mandate - data sharing
Not available.
7.1. Confidentiality - policy
Dissemination of terms and conditions under which official statistics are produced, including confidentiality of individual responses: Information about how the statistics are produced is given as "About the statistics" at the website. This applies to - among other things - information about collection methods, explanation of terms and information about sources of errors.
7.2. Confidentiality - data treatment
Not relevant.
8.1. Release calendar
Advance dissemination of release calendar:The publication schedule is pre-released in Statistics Norway's Advance Release Calendar. See 8.2
Simultaneous release to all interested parties:Statistics Norway releases statistics at its website, ssb.no. The statistics are released at 08.00 h on the date of publication in both Norwegian and English
Identification of internal government access to data before release: No other governmental or non-governmental bodies have prior access to data before its release
Transmission to Eurostat and further use of the statistics: The data is transmitted to Eurostat immediately after the time of national publication
The frequency of dissemination is monthly.
10.1. Dissemination format - News release
Identification of ministerial commentary on the occasion of statistical releases : Example of a statistical release with commentaries see link in 10.2
The index is published monthly for the construction activity as a whole and breakdown at nace 2- and 3- digit level.
10.3. Dissemination format - online database
On the webpage of the statisticlal release there is also a link to the statbank (the SN statistical databse)
10.4. Dissemination format - microdata access
Microdata is stored on Linux, the archive database. For access to microdata an authorization from the Division for Business Cycle Statistics is needed.
10.5. Dissemination format - other
Other dissemination methods:Transmission to Eurostat and contribution to Eurostat tables for Production in construction
10.6. Documentation on methodology
Dissemination of documentation on methodology and sources used in preparing statistics:Documentation on methodology and sources used in preparing statistics are published at Production index for construction – Statistics Norway (SSB) ("About the Statistics")
10.7. Quality management - documentation
The standard operational procedures for making the statistics are reported in a documentation note for internal use.
11.1. Quality assurance
The quality assurance framwork for in Statistics Norway is the The European Statistics Code of practice. It consists of 15 principles with a set of indicators of good practice. In addition to quality criteria for products and processes, the Code contains requirements for institutions that produce official statistics. Requirements of independence, objectivity and protection of respondents (confidentiality) are central.
Summary description of quality criteria calculated for national purposes : The number of employees and estimated hours are compared against corresponding values in previous months. Establishments going in or out of the population are examined and industry changes are controlled.
12.1. Relevance - User Needs
Users of the statistics include the Ministry of Finance, the Central Bank, Statistics Norway's national accounts division, international users, as Eurostat, and the construction industry.
12.2. Relevance - User Satisfaction
Not available.
12.3. Completeness
The requirements in timeseries in Statistics Norway and Eurostat are fulfilled
13.1. Accuracy - overall
Measurement errors in reporting to the A-ordningen are caused by the respondent’s internal system for obtaining the data. Examples are misunderstandings in the completion of the A-ordningen or errors in the data of the respondent. To avoid this, great emphasis has been placed on clarity in the guidance to the A-ordningen and controls in the reporting solution.
Processing errors may occur when Statistics Norway processes the data. This may be due to technical errors in the programs used to produce the statistics or in the connection of various data sources. We have a comprehensive control system to avoid processing errors.
Errors of non-response refer to error that is either due to unit dropout, i.e. that the unit has failed to answer, or partial dropout, i.e. that the unit has failed to answer at least one of the questions in the survey. In the production of the index it can occur that some companies do not meet deadlines for reporting to the A-ordningen. To reduce the effect of this, the previous month will be revised with a newer version of the reporting which also includes any missing units in the first version. To correct this the first version of A-ordningen is adjusted by factors calculated between the first and second versions of data from the same month the year before on the 4-digit NACE.
Coverage errors refer to errors in registers that define the population, in this case the Central Register of Establishments and Enterprises. As a result of such errors, units may be incorrectly included in or excluded from the population. Other problems are related to delays in the update of the registers and units that are incorrectly classified. From experience, a limited share of the population units is incorrectly classified. This is usually due to misleading or insufficient information at a certain time. No calculations on the size and significance of such errors have been carried out. However, such errors are not considered to be greater than for other quantitative short-term statistics.
Modelling errors are mainly related to problems with the seasonal adjustment of time series. Such problems are caused by deviation from the conditions that form the basis for the model used. Typical problems are related to movable public holidays such as Easter and Pentecost. X13-ARIMA generates a number of indicators that are used to evaluate the quality of the seasonal adjustment. These indicators have identified a stable seasonal pattern.
13.2. Sampling error
Not relevant
13.3. Non-sampling error
Response rate: Not relevant
Weighted response rate: Not relevant
Actions to speed up or increase the rate of response: Not relevant
14.1. Timeliness
Timeliness: The statistics are published 30 days after the end of the month
Timetable of data collection: not relevant
14.2. Punctuality
The Production index for Construction is published within 30 days after the end of the month, and the puctuality is usally good.
15.1. Comparability - geographical
There are no geographical considerations. The figures are published on national level.
15.2. Comparability - over time
From 1995 to 1998 the index for new buildings were calculated from a model based on new buildings started from the building register in the Matrikkel (official registert of property), and the rest was based on employment figures. In 1999 the Matrikkel was not used because of reporting delay in register. The calculation method was changed in 2000. From the 1st quarter of 2000 the calcualtion of the production index is based on measuring the number of hours worked. Earlier, it was based on employment figures. The quarterly figures calculated after 1999 are therefore not directly comparable with the figures before the 1st quarter of 2000.
Before the second quarter of 2004, contracted labour was not included. From the second quarter of 2004 labour hired from emplyment egencies was included. This was however reversed in 2011 as it often occured that the companies did not include labour hired from employment agencies when estimating hours worked in construction industry.
The production index for construction changed frequency from quarterly to monthly publications from the statistical month January 2022 and onwards. Additional changes are introduced at the publication levels. This means that one shifts from publishing by type of building and construction activity (CC code) to industry section F using the Standard industrial classification (SIC2007). Publication will be detailed at the level industry group (3-digit NACE). The change is a result of the introduction of a new European regulation for business statistics called European Business Statistics (EBS). Simultaneously both the data source and the calculation method will change. The new production index is based on estimated hours worked from A-ordningen in combination with weights from the statistics Structural business statistics.
15.3. Coherence - cross domain
Dissemination of information that support statistical cross-checks and provide assurance of reasonableness: None
Confrontation with other data sets: Results are compared with relevant sources.The development of the production index is compared with the turnover in the annually structural business statistics.
15.4. Coherence - internal
Results are compared with last month and same month last year.
Not available.
17.1. Data revision - policy
General revision policy for Statistics Norway is based on guidelines from European Code of Practice - (CoP) with its «Quality Assurance Framework - QAF». It is also based on the revision policy specified in «Principal European Economic Indicators - PEEI».
Published figures are final and no preliminary figures are released. Revised /corrected figures are only published in case of errors.
As a basis for the index the reference year is put to 2021=100.
There regularity in changing the reference year is not established, but the lates years the change has occured every 5 years. A change can be initialized by users needs and the need of comparability to other indexes.
Since the Production Index of Construction has no preliminary figures there is no database of unrevised figures.
If however a timeseries is revised in the case of errors, the unrevised series are not saved. A footnote whit information to the users is necessary.
The same revision policy is applied nationally and in transmissions to Eurostat.
17.2. Data revision - practice
Provision of information about revision and advance notice of major changes in methodology: Revisions are announced simultaneously with the release of the indices
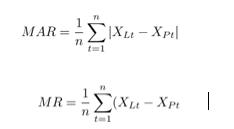
Quality indicators:
The quality indicators used are MAR (Mean Absolute Revision) and MR (Mean Revision). The formulas used to calculate these QIs are defined as:
The computed values for the QIs in 2023 are:
YoY growth rate for unadjusted series:
MR=0.038, MAR=0.276
YoY growth rate for calendar adjusted series:
MR=0.056, MAR=0.273
The reference periods used in the calculations for 2023 are shorter than 36 months. This is because Statistics Norway has recently started to build up these quality indicators. The calculations of the QIs are conducted in the software programme SAS EG.
18.1. Source data
Type of source: Administrative data.
Frame on which the source is based: Statistics Norway receives monthly registry data concerning jobs, remunerations, and taxes (including payroll taxes) through a-ordningen, which was established in 2015. This is a mandatory electronic reporting system for anyone who has employees or who pays salary, pension, or other benefits. The Central Register of Establishments and Enterprises is used to defne the population.
Sample or census: Census
Criteria for stratification: Not relevant
Threshold values and percentages: Not relevant
Frequency of updating the sample: Not relevant
18.2. Frequency of data collection
Monthly.
18.3. Data collection
Data are collected through administrative register. Statistics Norway recives datafiles from the Norwegian Tax Administration.
18.4. Data validation
The Eurostat tables are processed in SAS EG, and validated in the PCaxis wiewer to control that the figures are correct before transmission.
18.5. Data compilation
Estimates for non-response: No
Estimates for grossing-up to population levels: Not relevant
Type of index: Calculated according to Laspeyres formula
Method of weighting and chaining: The short-term index is chained to the average long-term index from the previous year. This must be done to be able to compare the indices over time.
Chained indices are calculated with reference year 2021 for industry section F, at industry divsion (2-digit NACE), and at industry group (3-digit NACE).
18.6. Adjustment
WDA, SA and other calculations : The index is seasonally adjusted back to 2005. In addition the index is working day adjusted back to 2005.
The production index for construction changed frequency from quarterly to monthly publications from the statistical month January 2022 and onwards. The statistics is based on administrative register data.
Name of indicator/source: Production index for construction
15 May 2025
List and definition of variables: Hours worked: calculation of hours worked is estimated according to a formula from Statistics Norway’s Labour Accounts. The formula is used to calculate quantities for hours worked in the national accounts. The hours are calculated for each active employment. The hours are then aggregated on establishments and then on industry subclasses where the lowest level is 4-digit NACE. Hours worked by labour hired from employment agencies or employees on holiday, on strike, ill or laid off are not included.
Planned changes in information collected: None
Accounting conventions: The reference period is the month of the year
Reporting unit : Establishment. An establishment is defined as a locally limited functional unit that mainly conducts business within a specific industry group (Standard for industry groupings).
Observation unit(s) : Establishments.
The Statistical population covers all activity in the construction industry section F. The observation unit is establishments.
All regions of Norway are covered.
Month
Measurement errors in reporting to the A-ordningen are caused by the respondent’s internal system for obtaining the data. Examples are misunderstandings in the completion of the A-ordningen or errors in the data of the respondent. To avoid this, great emphasis has been placed on clarity in the guidance to the A-ordningen and controls in the reporting solution.
Processing errors may occur when Statistics Norway processes the data. This may be due to technical errors in the programs used to produce the statistics or in the connection of various data sources. We have a comprehensive control system to avoid processing errors.
Errors of non-response refer to error that is either due to unit dropout, i.e. that the unit has failed to answer, or partial dropout, i.e. that the unit has failed to answer at least one of the questions in the survey. In the production of the index it can occur that some companies do not meet deadlines for reporting to the A-ordningen. To reduce the effect of this, the previous month will be revised with a newer version of the reporting which also includes any missing units in the first version. To correct this the first version of A-ordningen is adjusted by factors calculated between the first and second versions of data from the same month the year before on the 4-digit NACE.
Coverage errors refer to errors in registers that define the population, in this case the Central Register of Establishments and Enterprises. As a result of such errors, units may be incorrectly included in or excluded from the population. Other problems are related to delays in the update of the registers and units that are incorrectly classified. From experience, a limited share of the population units is incorrectly classified. This is usually due to misleading or insufficient information at a certain time. No calculations on the size and significance of such errors have been carried out. However, such errors are not considered to be greater than for other quantitative short-term statistics.
Modelling errors are mainly related to problems with the seasonal adjustment of time series. Such problems are caused by deviation from the conditions that form the basis for the model used. Typical problems are related to movable public holidays such as Easter and Pentecost. X13-ARIMA generates a number of indicators that are used to evaluate the quality of the seasonal adjustment. These indicators have identified a stable seasonal pattern.
The production index is based on estimated hours worked in the construction sector as an input variable. The construction total index is calculated on the basis of an estimate of total hours worked. Monthly calculated hours worked in year t are compared with calculated hours in year t-1. This provides a basis for calculating the short-term index for the industry. An unadjusted short-term index of 105 then shows an increase of 5 percent compared to an average of last year's calculated hours.
In order for the aggregate indices to be able to absorb changes in the relative relationship between the industries, aggregated indices are calculated by weighing the short-term indices at the lowest level (4-digit NACE) together. Value added at factor prices from the statistics Structural business statistics for year t-3, is used as weights. The weights are updated annually.
The short-term index is chained to the average long-term index from the previous year. This must be done to be able to compare the indices over time. Chained indices are calculated with reference year 2015 for industry section F
Estimates for non-response: No
Estimates for grossing-up to population levels: Not relevant
Type of index: Calculated according to Laspeyres formula
Method of weighting and chaining: The short-term index is chained to the average long-term index from the previous year. This must be done to be able to compare the indices over time.
Chained indices are calculated with reference year 2021 for industry section F, at industry divsion (2-digit NACE), and at industry group (3-digit NACE).
Type of source: Administrative data.
Frame on which the source is based: Statistics Norway receives monthly registry data concerning jobs, remunerations, and taxes (including payroll taxes) through a-ordningen, which was established in 2015. This is a mandatory electronic reporting system for anyone who has employees or who pays salary, pension, or other benefits. The Central Register of Establishments and Enterprises is used to defne the population.
Sample or census: Census
Criteria for stratification: Not relevant
Threshold values and percentages: Not relevant
Frequency of updating the sample: Not relevant
The frequency of dissemination is monthly.
Timeliness: The statistics are published 30 days after the end of the month
Timetable of data collection: not relevant
There are no geographical considerations. The figures are published on national level.
From 1995 to 1998 the index for new buildings were calculated from a model based on new buildings started from the building register in the Matrikkel (official registert of property), and the rest was based on employment figures. In 1999 the Matrikkel was not used because of reporting delay in register. The calculation method was changed in 2000. From the 1st quarter of 2000 the calcualtion of the production index is based on measuring the number of hours worked. Earlier, it was based on employment figures. The quarterly figures calculated after 1999 are therefore not directly comparable with the figures before the 1st quarter of 2000.
Before the second quarter of 2004, contracted labour was not included. From the second quarter of 2004 labour hired from emplyment egencies was included. This was however reversed in 2011 as it often occured that the companies did not include labour hired from employment agencies when estimating hours worked in construction industry.
The production index for construction changed frequency from quarterly to monthly publications from the statistical month January 2022 and onwards. Additional changes are introduced at the publication levels. This means that one shifts from publishing by type of building and construction activity (CC code) to industry section F using the Standard industrial classification (SIC2007). Publication will be detailed at the level industry group (3-digit NACE). The change is a result of the introduction of a new European regulation for business statistics called European Business Statistics (EBS). Simultaneously both the data source and the calculation method will change. The new production index is based on estimated hours worked from A-ordningen in combination with weights from the statistics Structural business statistics.