Reference metadata describe statistical concepts and methodologies used for the collection and generation of data. They provide information on data quality and, since they are strongly content-oriented, assist users in interpreting the data. Reference metadata, unlike structural metadata, can be decoupled from the data.
Building permits for resdential and non-residential buildings.
Number of dwellings and gross floor area m2
The purpose of the statistics is that, together with other statistics on eg employment and industrial turnover shall be an economic indicator for the construction sector.
3.2. Classification system
NACE Rev. 2 / CPA buildings
3.3. Coverage - sector
NACE Rev 2. Division 41.2
Building Permits for new construction or extension of residential and non-residential buildings
Extensions of non-residential buildings of less than 50 square meters are excluded.
3.4. Statistical concepts and definitions
Residential building:
one- or two-dwelling buildings;
three or more dwelling buildings;
buildings for special residence (includes housing for elderly, sheltered housing but also student housing);
second homes (buildings for seasonal and secondary use).
Non-residential building:
office buildings;
wholesale and retail trade buildings;
hotels, restaurants, etc;
industrial buildings and warehouses;
schools, universities, other research premises;
museums, libraries and public entertainment buildings;
hospitals or institutional care buildings;
garage buildings and traffic and communication buildings;
other non-residential buildings.
Number of dwellings is collected for Residential buildings.
For all types of buildings there is information on the Gross residential area and the Gross non-residential area.
The reference period is the calender month.
No changes planned.
3.5. Statistical unit
Reporting units are all of Swedens 290 municipalities.
Observation unit(s) are granted buildings permits for residential and non-residential buildings.
3.6. Statistical population
New construction and major extension of buildings requiring a building permit
3.7. Reference area
All regions of Sweden are covered for all variables.
No coverage outside the borders.
3.8. Coverage - Time
Since 1996
3.9. Base period
Not relevant
Sums e.g. sum of dwellings in residential buildings, sum of gross floor area
Reference periods are month and quarter.
Data to Eurostat is by month and data in national publications by quarter.
6.1. Institutional Mandate - legal acts and other agreements
Unites are obliged to provide data. The legal basis under which the data are collected is specified in the Official Statistics Act (SFS 2001:99) and according to the Statute of Statistics Sweden (SCB-FS 2021:15).
No planned changes.
6.2. Institutional Mandate - data sharing
No data are shared with other international organisation other than Eurostat.
7.1. Confidentiality - policy
The data from respondents are regarded as confidential according to chapter 24 §8 of the Swedish Official Secrets Act (SFS 2009:400).
There is no prior access to data for public administration (or Government) other than the statistical office.
De-identified data may be provided for research purpose.
7.2. Confidentiality - data treatment
The data from respondents are regarded as confidential according to chapter 9 §4 of the Swedish Official Secrets Act (SFS 1980:100).
Aggregated data is published, never data concering individual persons.
8.1. Release calendar
Release dates are transmitted to Eurostat.
Release dates are published on Statistics Sweden's webside.
Advance notice of released dates can be found on the Internet at publishing calender
No preferential access to data is given before official release.
The statistics are published quarterly.
10.1. Dissemination format - News release
Not relevant.
10.2. Dissemination format - Publications
Electronic data is available quaterly in Statistic Swedens's Statistical database and tables and graphs
10.3. Dissemination format - online database
Data is available quaterly in Statistic Swedens's Statistical database.
Data is transmitted to Eurostat monthly.
10.4. Dissemination format - microdata access
Not available.
10.5. Dissemination format - other
No other dissemination form than online database and data deliveries to Eurostat and other larger data users.
10.6. Documentation on methodology
A description in Swedish of the survey is available on the Statistic Sweden’s website.
10.7. Quality management - documentation
Not available.
11.1. Quality assurance
A yearly report about the survey is produced and includes a quality description. It can be found on the Statistics Sweden’s website.
The statistics produced by Statistics Sweden are of high quality, which means they are adapted to their intended use. The same applies to deliveries of data.
Statistics Sweden also complies with the European Statistics Code of Practice and is assessed in this respect through regular peer reviews.
The users council answers for the users needs. The council consist of some of the larger users of construction and building statistics. Among these user are The Swedish National Board of Housing,County Administrative Boards and other governmental agencies and trade associations.
Eurostat is another user.
12.2. Relevance - User Satisfaction
The users council discuss the users questions and satisfaction.
12.3. Completeness
Longer time series on a national level are available. The data is underestimated at its initial release and therefore revised continuously.
13.1. Accuracy - overall
The overall accuracy is good but data may be underestimated at the initial release due to delays in reports from municipalities. Data are revised as new information becomes available. The Major revisions being for the previous two quarters, but earlier periods may also be revised.
De-identified micro-data may be issued for research purpose.
13.2. Sampling error
No sampling error.
For the national publication the number of dwellings and square meters in granted building permits are enumerated for the latest period due to underestimation at the initial release.
These variables are not enumerated in deliveries to Eurostat.
13.3. Non-sampling error
All new construction of residential and non-residential buildings that requires building permits are covered. However, residential buildings that do not require building permits will not be included in the measurement. Neither will new residential and non-residential buildings due to conversion or changed usage.
The occurrence of duplicate objects may be possible but are to be considered very rare and are corrected on discovery.
Building types may be wrongly classified e.g. residential buildings for communities may be wrongly classified as non-residential health buildings. There are a continuously contact with municipalities and builders to get the information correct. Someverification against administrative records is also possible. Misclassifications may also happen in the statistical processing when this information are missing from the municipalities.
The largest accuracy problem is the initial underestimation. See 17. Data revision
The questionnaires (Both paper and web) has been reviewed by experts on questionnaire methodology. All future change will be reviewed. To reduce non-responses, inquiries goes out to every municipality monthly. Planned building in the municipalities according to the National Board of Housing, Building and Planning are also used to verify that no permits are omitted.
14.1. Timeliness
Production time is about 6 weeks.
Data collection is carried out continuously.
14.2. Punctuality
The results are regularly published according to plan.
15.1. Comparability - geographical
All 290 municipalities deliver building permit data in similar ways.
15.2. Comparability - over time
Building permit data have been collected in a similar way since 1996.
15.3. Coherence - cross domain
There are no other sorces for building permits at a national level. Some municipalities keep their own statistics on granted building permits. Construction statistics (Based on the building permits) may be compared to the number of complete dwellings in the Real estate tax assessments and the national Dwelling Register. Such a comparison show a small underestimate in new construction (and therefore in building permits data) particularly for one- or two dwelling buildings. If this is the result of missing building permits or the information of missing building starts are not known at this time.
Building permits for residential buildings are the base for the construction statistics. The statistics for building permits should show coherence with the construction statistics.
Construction statistics (started and completed dwellings) is the main indicator for building activity in Sweden. Construction statistics (started and completed dwellings) is the main component in the national accounts and not building permit data.
15.4. Coherence - internal
Gross floor area is coherent for all types of buildings. For number of dwellings buildings for seasonal and secondary use are included in number of dwellings variable for one dwelling residential buildings. Dwellings in those may not have the same living standard as regular residential buildings.
An estimate of the cost and burden for the municipalities delivering data and the cost of production is transmitted to Eurostat. 8 850 building permits were reported in 2024. The estimated cost (In hours) for this was 2 000 for statistic Sweden and 1 800 for the respondents.
17.1. Data revision - policy
For building permit data the results for the latest period published are underestimated and therefor revised during time as new data becomed available.
There is no official policy for routine revisions, but routine revisions are carried out every month as new data becomes available from the reporting municipalities. Revised data are then transmitted to Eurostat and other major users monthly and officially published quarterly. This is stated in the official documentation. Dates for transmission to Eurostat and national publication can be seen in the concept 8.1.
There is a national official policy for non-scheduled data revisions (Revisions due to errors). This policy handles national releases, statistics producerad by commission and international transmissions (like Eurostat). The policy states that all users should get the same information at the same time when non-scheduled revisions occurs. The information about the revision will among other things include which data has been corrected and when. The policy document is only available in swedish, find it attached.
There are no other statistics available for benchmarking Therefore no revisions are carried out due to benchmarking with other statistics.
A vintage database is not officially available, the micro data for each delivery to Eurostat are however stored so they could be produced again.
At the time of the initially delivery the data may be underestimated by up to 50 percent. Therefor revisions are carried out every month. The data are complete in about a year. This fact is available publicly through the documentation.
E.g. the total gross floor area in building permits (F_CC11) in January 2021 (as of february 2021) where revised upwards by 6 % the month after its initial release and had been revised by a total of 37 % by the time of the final release.
For the quarterly national publication of the statistics the average underestimate in the initial release for the period is calculated and published on the productweb page. There is no official policy for non-scheduled data revisions.
The fact that revisions are carried out continuously are stated in the official documentation. Major users gets transmissions of data for every with every revision. No major revisions are carried out except in case of errors. Non-scheduled revisions of this type are communicated according to national revision policy. Data should be corrected and users should be informed as fast as possible after the discovery.
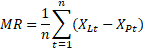
A number of quality indicators can be used to evaluate the revisions. The indicators for revision are here all based on the first released observation compared to the final value of this observation in the period of 1997 to 2021.
The computed Mean Revision (MR) for the Gross floor area indicator in building permits for the period 1997 – 2021 are 153007.05 m2
The building permits data reported are the actual values reported from municipalities and not estimates, at the time all permits are not yet reported, they are therefore at the time of its initial release underestimated, and all revisions are therefore upwards. Because of this the mean revision equals the absolute mean revision (MR=MAR)
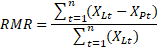
Since there are large variations in the number of granted building permit during the period a better measure may be the Relative mean revision (RMR). The final value relative to the initial value.
The computed RMR for the period is 0.2183. In average the final value is about 22 percent higher compared to the initial value.
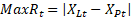
Another relevant measure is the max revision.
The max revise for the period is 534685 (or relative to the initial release (0, 5262). The value is of May 2011, Looking at the revisions over time the trend is that the revisions are decreasing and becomes smaller in later years.
As of 2024, there are no possibility to present the MR and RMR for seasonal adjusted or calendar corrected data. These are however estimates of the original data series, so what’s applies to the original series may apply to those series also.
Granted building permits that are later revoked will not be excluded from the data in an future release.
Any major methodological changes would be announced in advanced.
18.1. Source data
The source is a statistical survey. All 290 municipalities deliver data for all their granted building permits(the survey is carried out exhaustively).
18.2. Frequency of data collection
Data are collected continuously as it becomes available.
The municipalities reports granted building permits.
18.3. Data collection
There is a standard questionnaire (Web or paper) for all municipalities. Some sends a copy of the original administrative form used for applications of a building permit. The data are registered manually and stored in a data base.
18.4. Data validation
Data are extracted from the database using two different tools for every delivery to Eurostat and other users. The results are compared and should be identical. Tools used are sql and the statistical programs SAS.
Some municipalities may keep their own statistics to compare against.Results are also compared with earlier periods and major deviations are checked up with municipalities.
Statistics of started and completed dwellings can also give some validation of granted building permits.
18.5. Data compilation
Non-response is not treated.
Census data, no weights or estimates.
18.6. Adjustment
Seasonally adjustment and working day adjustment are transmitted to Eurostat monthly. These are produced for Eurostat only and are not published as part of the national official statistics. Manipulations are made on aggregated data with ARIMA-X-12. The indirect method is used; the series at higher levels are aggregations of adjusted data at the lower levels.
The calendar used is based on the national number of working days per month. There are no moving holiday or leap year effects included in the model. Calendar adjustment is implemented as regression covariates
Detection and replacement of outliers is performed according to X12 default and automatic outlier options. (OUTLIER SPAN= ..., TYPE= ...;) Outliers types can be AO, TC and LS. Before year 2011, some fixed outliers have been defined. From year 2012, the outliers are free to vary freely. No economic reasoning has been applied to outlier specification.
SAS 9.3, with the X12 procedur and automatic X12 default filter is used. The models are re-estimated every time, but the model structure (Arima parameters and similar) is held constant. Every year the model structure is reevaluated. The decomposition is usually multiplicative.
Proc X12 default are used for critical values, filter lengths and the date of seasonal breaks.
The series (Seasonal adjusted and working day adjusted) are revised monthly as new data becomes available. The revision goes back as far as necessary (Usually about a year). Residual seasonality is checked for in each series individually.
No comment
Building permits for resdential and non-residential buildings.
Number of dwellings and gross floor area m2
The purpose of the statistics is that, together with other statistics on eg employment and industrial turnover shall be an economic indicator for the construction sector.
23 May 2025
Residential building:
one- or two-dwelling buildings;
three or more dwelling buildings;
buildings for special residence (includes housing for elderly, sheltered housing but also student housing);
second homes (buildings for seasonal and secondary use).
Non-residential building:
office buildings;
wholesale and retail trade buildings;
hotels, restaurants, etc;
industrial buildings and warehouses;
schools, universities, other research premises;
museums, libraries and public entertainment buildings;
hospitals or institutional care buildings;
garage buildings and traffic and communication buildings;
other non-residential buildings.
Number of dwellings is collected for Residential buildings.
For all types of buildings there is information on the Gross residential area and the Gross non-residential area.
The reference period is the calender month.
No changes planned.
Reporting units are all of Swedens 290 municipalities.
Observation unit(s) are granted buildings permits for residential and non-residential buildings.
New construction and major extension of buildings requiring a building permit
All regions of Sweden are covered for all variables.
No coverage outside the borders.
Reference periods are month and quarter.
Data to Eurostat is by month and data in national publications by quarter.
The overall accuracy is good but data may be underestimated at the initial release due to delays in reports from municipalities. Data are revised as new information becomes available. The Major revisions being for the previous two quarters, but earlier periods may also be revised.
De-identified micro-data may be issued for research purpose.
Sums e.g. sum of dwellings in residential buildings, sum of gross floor area
Non-response is not treated.
Census data, no weights or estimates.
The source is a statistical survey. All 290 municipalities deliver data for all their granted building permits(the survey is carried out exhaustively).
The statistics are published quarterly.
Production time is about 6 weeks.
Data collection is carried out continuously.
All 290 municipalities deliver building permit data in similar ways.
Building permit data have been collected in a similar way since 1996.