


1.1. Contact organisation
Statistics Sweden
1.2. Contact organisation unit
Economic Statistics and Analysis
Innovation, Business sector production and Research
1.3. Contact name
Confidential because of GDPR
1.4. Contact person function
Confidential because of GDPR
1.5. Contact mail address
Statistics Sweden
Att. Nils Adriansson
ESA/NUP/INF
Solna strandväg 86, Solna
SWEDEN
1.6. Contact email address
Confidential because of GDPR
1.7. Contact phone number
Confidential because of GDPR
1.8. Contact fax number
Confidential because of GDPR
2.1. Metadata last certified
14 August 2023
2.2. Metadata last posted
14 August 2023
2.3. Metadata last update
14 August 2023
3.1. Data description
Statistics on Private non-profit R&D (PNPRD) measure research and experimental development (R&D) performed in the private non-profit sector, i.e. R&D expenditure and R&D personnel. In line with this objective the target population for the national R&D survey of the private non-profit sector should consist of all R&D performing units (including all R&D performers – occasional and continuous, known and unknown - in all branches and size classes) belonging to this sector.
The main concepts and definitions used for the production of R&D statistics are given by the OECD (2015), Frascati Manual 2015: Guidelines for Collecting and Reporting Data on Research and Experimental Development, The Measurement of Scientific, Technological and Innovation Activities, which is the internationally recognised standard methodology for collecting R&D statistics and by Eurostat’s European Business Statistics Methodological Manual on R&D Statistics (EBS Methodological Manual on R&D Statistics).
Since the beginning of 2021, the collection of R&D statistics is based on Commission Implementing Regulation (EU) No 2020/1197 of 30 July 2020. The Regulation sets the framework for the collection of R&D statistics and specifies the main variables of interest and their breakdowns at predefined level of detail. Statistics on science, technology and innovation were collected until the end of 2020 based on the Commission Implementing Regulation (EU) No 2012/995 concerning the production and development of Community statistics on science and technology.
3.2. Classification system
- The distribution of principal economic activity and by product field is based on Statistical classification of economic activities in the European Community (NACE Rev. 2);
- The local units for the statistics are compiled at regional level according to NUTS 2 – Nomenclature of Territorial Units for Statistics;
- The distribution by socioeconomic objectives (SEO) is based on Nomenclature for the Analysis and Comparisons of Scientific Programmes and Budgets (NABS);
- The fields of research and development based on Classification and distribution by Fields of Research and Development (FORD).
3.2.1. Additional classifications
Not applicable, not breakdown by classifications available for the Private non-profit sector.
3.3. Coverage - sector
See below.
3.3.1. General coverage
| Definition of R&D | No deviations. |
| Fields of Research and Development (FORD) | No breakdown by FORD is availble for the Private non-profit sector. |
| Socioeconomic objective (SEO) | No breakdown by socioeconomic objective is availble for the Private non-profit sector. |
3.3.2. Sector institutional coverage
| Private non-profit sector | The national definition of the Private non-profit sector does not deviate from the definition in FM15. All private non-profit institutions serving households as well as households and individuals are included in the sector. Private non-profit organisations serving the Government sector or the Business enterprise sector are exluded, as well as private non-profit insitutions classified as belonging to the Higher education institution. |
| Inclusion of units that primarily do not belong to GOV | No units included that do not belong to PNP. |
3.3.3. R&D variable coverage
| R&D administration and other support activities | Included, no deviations from FM15. |
| External R&D personnel | Not included, no data is available on externa R&D personnel. |
| Clinical trials | Clinical trials funded by the Private non-profit sector are included. |
3.3.4. International R&D transactions
| Receipts from rest of the world by sector - availability | Not available, no data on source of funds is published for the Private non-profit sector. |
| Payments to rest of the world by sector - availability | Not available, no data on expenditures for extramural R&D is published for the Private non-profit sector. |
3.3.5. Extramural R&D expenditures
According to the Frascati Manual, expenditure on extramural R&D (i.e. R&D performed outside the statistical unit) is not included in intramural R&D performance totals (FM, §4.12).
| Data collection on extramural R&D expenditure (Yes/No) | No. |
| Method for separating extramural R&D expenditure from intramural R&D expenditure | Data on extramural and intramural R&D for the Private non-profit sector was collected seperatly until 2017. Using this data to extrapolate R&D expenditure it is possible to separate extramural R&D expenditure from intramural R&D expenditure. |
| Difficulties to distinguish intramural from extramural R&D expenditure | Since data from 2017 is used to extrapolate R&D expenditure, changes in the composition of R&D expenditure and its allocation to intramural versus extramural R&D are not captured. |
3.4. Statistical concepts and definitions
See below.
3.4.1. R&D expenditure
| Coverage of years | Calendar year. |
| Source of funds | No breakdown by source of funds is available for the Private non-profit sector. |
| Type of R&D | No divergence from FM15. |
| Type of costs | No breakdown by type of costs is available for the Private non-profit sector. |
| Defence R&D - method for obtaining data on R&D expenditure | No method is available to identify defence R&D in the Private non-profit sector. |
3.4.2. R&D personnel
See below.
3.4.2.1. R&D personnel – Head Counts (HC)
| Coverage of years | Calendar year. |
| Function | No breakdown by function is available for the Private non-profit sector. |
| Qualification | No breakdown by qualification is available for the Private non-profit sector. |
| Age | No breakdown by age is available for the Private non-profit sector. |
| Citizenship | No breakdown by citizenship is available for the Private non-profit sector. |
3.4.2.2. R&D personnel – Full Time Equivalent (FTE)
| Coverage of years | Calendar year. |
| Function | No breakdown by function is available for the Private non-profit sector. |
| Qualification | No breakdown by qualification is available for the Private non-profit sector. |
| Age | No breakdown by age is available for the Private non-profit sector. |
| Citizenship | No breakdown by citizenship is available for the Private non-profit sector. |
3.4.2.3. FTE calculation
R&D full-time equivalents are estimated by extrapolation based on data collected by questionnaire concerning 2017. The method of extrapolation is a moving average based on data for government agencies. Analysis of historical data has shown that the development of R&D personnel in the Private non-profit sector closely ressembles that of government agencies, why data on the development among government agancies is assumed to be an adequate proxy for the development in the Private non-profit sector.
3.4.2.4. R&D personnel - Cross-classification by function and qualification
| Cross-classification | Unit | Frequency |
3.5. Statistical unit
The statistical unit is the institutional unit as defined by Council Regulation (EEC) No 1993/696 of 15 March 1993.
3.6. Statistical population
See below.
3.6.1. National target population
The target population is the population for which inferences are made. The frame (or frames, as sometimes several frames are used) is a device that permits access to population units. The frame population is the set of population units which can be accessed through the frame and the survey data really refer to this population of institutional units.
The objective of the European R&D statistics is to cover all intramural R&D activities. In line with this objective, the target population for the national R&D survey of the PNP Sector should consist of all R&D performing units (including known R&D performers or assumed to perform R&D). In practise however, countries in their R&D surveys might have difficulty in identifying R&D activities at the municipality level.
| Target population when sample/census survey is used for collection of raw data | Target population when administrative data or pre-compiled statistics are used | |
| Definition of the national target population | Not applicable, no collecation of raw data is performed for the Private non-profit sector. | The target population consists of all private non-profit organisations not belonging to another insititutional sector that are known or believed to perform or finance R&D. |
| Estimation of the target population size | Not applicable, no collecation of raw data is performed for the Private non-profit sector. | 1 600 insititutional units. |
3.7. Reference area
Not requested. R&D statistics cover national and regional data.
3.8. Coverage - Time
Not requested. See point 3.4.
3.9. Base period
Not requested. The base year for the unit Purchasing Power Standard (PPS) and PPS per inhabitant at constant prices is currently 2005. All calculations of non-basic unit (national currencies) are done by Eurostat.
National currency in thousands and full-time equivalents.
2021
6.1. Institutional Mandate - legal acts and other agreements
See below.
6.1.1. European legislation
| Legal acts / agreements | Since the beginning of 2021, the collection of R&D statistics is based on Commission Implementing Regulation (EU) No 2020/1197 of 30 July 2020 laying down technical specifications and arrangements pursuant to Regulation (EU) 2019/2152 of the European Parliament and of the Council on European business statistics repealing 10 legal acts in the field of business statistics. The Regulation sets the framework for the collection of R&D statistics and specifies the main variables of interest and their breakdowns at predefined level of detail. Commission Implementing Regulation (EU) No 2012/995 concerning the production and development of Community statistics on science and technology was in force until the end of 2020. |
| Nature of the “obligations” of responsible national organisations to produce statistics and report to international organisations |
6.1.2. National legislation
| Existence of R&D specific statistical legislation | No R&D specific legislation at the national level. |
| Legal acts | All statistical data collection and production of official statistics is regulated by the Official Statistics Act (2001:99) and the Official Statistics Ordinance (2001:100). Confidentiality is regulated by the Public Access to Information and Secrecy Act (2009:400). In addition to this, Statistics Sweden has a mandate to regulate on the obligation to provide raw data and administrative data for business enterprises and government units (including higher education institutions). |
| Obligation of responsible organisations to produce statistics (as derived from the legal acts) | Yes. |
| Right of responsible organisations to collect data – obligation of (natural / legal) persons to provide raw and administrative data (as derived from the legal acts) | Units belonging to the Private non-profit sector are not obligated to provide raw and administrative data. |
| Obligation of responsible organisations to protect confidential information from disclosure (as derived from the legal acts) | Yes. |
| Rights of access of third organisations / persons to data and statistics (as derived from the legal acts) | Microdata is available for research or statistical purposes. An application must be made in which the research project is described and the use of the microdata specified. The system for researchers to access microdata stored at Statistics Sweden is called Microdata Online Access (MONA). Access is only granted if the confidentiality of data can be ensured by the recieving party. |
| Planned changes of legislation | No planned changes of legislation. |
6.1.3. Standards and manuals
- Frascati Manual 2015, Guidelines for Collecting and Reporting Data on Research and Experimental Development
- European Business Statistics Methodological Manual on R&D
6.2. Institutional Mandate - data sharing
Not requested.
7.1. Confidentiality - policy
Confidentiality, being one of the process quality components, concerns the privacy of data providers (households, enterprises, administrations and other respondents), the confidentiality of the information they provide and the extent of its use for statistical purposes.
A property of data indicating the extent to which their unauthorised disclosure could be prejudicial or harmful to the interest of the source or other relevant parties.
a) Confidentiality protection required by law:
The major policy in place to ensure confidentiality and prevent unauthorised disclosure of data that identify a person or economic entity is the Public Access to Information and Secrecy Act (2009:400). There are also specific conditions concerning the confidentiality of official statistics in the Official Statistics Act (2001:99).
b) Confidentiality commitments of survey staff:
Statistics Sweden has a confidentiality policy to which all survey staff must adhere. It contains guidance on the practical application of the legal acts stated above.
Annexes:
Statistics Sweden's confidentiality policy (available in Swedish only)
7.2. Confidentiality - data treatment
For aggregate outputs, primary cell suppression is used as a general rule to ensure no confidential information is disclosed. To ensure that the information cannot be calculated using data in other cells, secondary cell suppression is used.
Any disclosure of microdata must be tried. It can be disclosed only for research or statistical purposes and only to such entities that are deemed able to ensure confidentiality protection of the data.
8.1. Release calendar
The release policy and the release calendar are publicly available at Statistics Sweden's website.
8.2. Release calendar access
The publication calendar is available on Statistics Sweden's website.
Annexes:
Release calendar
8.3. Release policy - user access
Statistics Sweden's release policy states that all statistics must be made available to all users equally and at the same time. Statistics are always released at 8.00 am on weekdays. Users are also informed of the availability of new statistics by news releases on Statistics Sweden's website. It is possible for users to subscribe to get e-mail notifications when new statistics within a certain subject area are released. Statistics are released by being made available in the statistical database. The release policy is available on Statistics Sweden's website.
Annually.
10.1. Dissemination format - News release
See below.
10.1.1. Availability of the releases
| Availability (Y/N)1 | Content, format, links, ... | |
| Regular releases | Y. | The statistical database is updated and a news release is published on Statistics Sweden's website in October. This is followed by online articles on R&D statistics. All content is made publicly available, free of charge. |
| Ad-hoc releases | N. |
1) Y - Yes, N – No
10.2. Dissemination format - Publications
See below.
10.2.1. Availability of means of dissemination
| Means of dissemination | Availability (Y/N)1 | Content, format, links, ... |
| General publication/article (paper, online) |
Y. | The general publication on R&D in Sweden consists of statistical database tables and a news release. The variables reported in the database tables are total R&D expenditure and R&D personnel in full-time equivalents. All publications are made available online only. |
| Specific paper publication (e.g. sectoral provided to enterprises) (paper, online) |
N. |
1) Y – Yes, N - No
10.3. Dissemination format - online database
An online statistical database is available on Statistics Sweden's website (see link in Annex). During 2022, the R&D tables in the database were accessed 3 431 times.
Annexes:
Statistical database, R&D in Sweden
10.3.1. Data tables - consultations
Not requested.
10.4. Dissemination format - microdata access
See below.
10.4.1. Provisions affecting the access
| Access rights to the information | Microdata is available for research or statistical purposes. An application must be made in which the research project is described and the use of the microdata specified. The system for researchers to access microdata stored at Statistics Sweden is called Microdata Online Access (MONA). Access is only granted if the confidentiality of data can be ensured by the recieving party. |
| Access cost policy | Statistics Sweden applies the principle of full cost coverage, i.e. the charge covers the actual cost of processing and producing the microdata requested. |
| Micro-data anonymisation rules | All microdata is anonymised. Statistics Sweden can use a common anonymisation key when microdata from several sources is requested at the same time. |
10.5. Dissemination format - other
See below.
10.5.1. Metadata - consultations
Not requested.
10.5.2. Availability of other dissemination means
| Dissemination means | Availability (Y/N)1 | Micro-data / Aggregate figures | Comments |
| Internet: main results available on the national statistical authority’s website | Y. | Aggregate figures. | Data are available in the online statistical database on Statistic Sweden’s website. |
| Data prepared for individual ad hoc requests | Y. | Micro-data and aggregate figures. | Access to microdata is only granted for research or statistical purposes. All ad hoc requests are priced at full cost coverage. |
| Other | N. |
1) Y – Yes, N - No
10.6. Documentation on methodology
The main documentation on methodology is titled Statistikens framställning (translates to Statistical production) which is updated when new statistics are published. There is a common document covering all sectors for the R&D statistics in which the specific methodology for each sector is described. This documentation is only available in Swedish.
Annexes:
Methodology documentation (available in Swedish only)
10.6.1. Metadata completeness - rate
Not requested.
10.7. Quality management - documentation
See below.
10.7.1. Documentation and users’ requests
| Type(s) of data accompanying information available (metadata, graphs, quality reports, etc.) | Statistical data is always accompanied by a quality report and a methodolgy report. These reports are available online on Statistics Sweden's website and follows a common standard for all official statistics in Sweden. Statistical database tables also contain footnotes in case there is important information about the data that users need to be aware of when using the data. |
| Request on further clarification, most problematic issues | Very few users give feedback on clarity. The user survey conducted 2012 did emphasize better clarity both regarding metadata and the published statistics. |
| Measure to increase clarity | Statistics Sweden works continuosly with improving the clarity in the documentation. |
| Impression of users on the clarity of the accompanying information to the data | The overall impression of users is that clarity is good. |
11.1. Quality assurance
Statistics Sweden is certified according to ISO 20252:2012 for market, opinion and social research surveys. The certification confirms that we fulfil the fundamental quality requirements in the production of statistics.
11.2. Quality management - assessment
The quality of the statistics is assessed regularly, and the R&D statistics meet the quality requirements. Measurement error is considered the most important source of error in the statistics as a result of the relatively complex concepts involved in R&D statistics and that respondents are required to report on. Yet, the quality is considered appropriate in relation to such legal requirements and user needs as have been identified. For the time-use survey, object non-response is also a mounting challange. Statistics Sweden has faced declining response rates for several years which has a negative effect on the quality of the statistics. For the survey on R&D expenditure however, there are no non-response issues. As it is a census there are neither any issues concerning sampling or coverage. Results are presented in more detail in sections 12 to 15 below.
12.1. Relevance - User Needs
See below.
12.1.1. Needs at national level
| Users’ class1 | Description of users | Users’ needs |
| 1 - Institutions | Among the most important users in this class are the European Commission (through Eurostat), the Ministry of Enterprise and Innovation, the Ministry of Education, the Swedish Higher Education Authority and the Swedish Research Council. Regional and local government, as well as higher education institutions are also users of R&D statistics concerning the Higher education sector. | Comparability over time is one of the most important requirements. The Ministry of Education in particular also require a high degree of timeliness as the statistics are used when formulating the state budget. Comparability between R&D statistics concerning the Higher education sector and other statistics regarding higher education is also required by users. This requires coherence and coordination in the use of classifications between Statistics Sweden and the Swedish Higher Education Authority. For the European Commission, comparability between member states is a priority. |
| 2 - Social actors | Trade associations such as Teknikföretagen (a trade association for the Swedish industry sector) and the Swedish Association of Local Authorities and Regions are identified as some of the most important users in this class. | Comparability between groups is an important quality aspect for these users. They tend to have specific interests and want to be able to compare the development in those industries or sectors that they represent with other industries or sectors. Breakdown by region is the most requested by this group of users. |
| 3 - Media | Trade media is considered to be the most important users in this class. | Timeliness and accessibility are important aspects to this group of users. Press releases containing citations from experts on the statistics at the time of publication is one measure taken to better accommodate the needs of the news media. |
| 4- Researchers and students | Researchers and students at higher education institutions and research institutes such as RISE and the Research Institute of Industrial Economics are the most important users in this class. | Accuracy is an important quality aspect for this user class as well as comparability both over time, between groups and with other statistics. This is also a group of users who request detailed data and often microdata. Access to microdata and the possibility to make ad-hoc requests for data on other breakdowns than those that are openly available is therefore important to this group. |
| 5 - Enterprises or businesses | No mapping has been done to identify the most important users among enterprises and businesses. | |
| 6 - Other | Other important users are the public. | Clarity is among the most important aspects for the general public. This user class cannot be expected to have a detailed knowledge about the concepts and definitions used in the R&D statistics which makes clarity in the documentation and in other publications important. |
1) Users' class codification
1- Institutions:
• European level: Commission (DGs, Secretariat General), Council, European Parliament, ECB, other European agencies etc.
• in Member States, at the national or regional level: Ministries of Economy or Finance, other ministries (for sectoral comparisons), National Statistical Institutes and other statistical agencies (norms, training, etc.), and
• International organisations: OECD, UN, IMF, ILO, etc.
2- Social actors: Employers’ associations, trade unions, lobbies, among others, at the European, national or regional level.
3- Media: International or regional media – specialized or for the general public – interested both in figures and analyses or comments. The media are the main channels of statistics to the general public.
4- Researchers and students (Researchers and students need statistics, analyses, ad hoc services, access to specific data.)
5- Enterprises or businesses (Either for their own market analysis, their marketing strategy (large enterprises) or because they offer consultancy services)
6- Other (User class defined for national purposes, different from the previous classes.)
12.2. Relevance - User Satisfaction
The views and opinions from users are primarily collected through the User council for statistics on research and development which meets twice yearly. The user council consists of representatives from the Ministry of Enterprise, the Ministry of Education, the Swedish Higher Education Authority, the Swedish Research Council, Vinnova (Sweden's innovation agency), RISE, the Swedish Association of Local Authorities and Regions, the Swedish Agency for Growth Policy Analysis, the Research Institute of Industrial Economics, Lund University and Teknikföretagen (the trade association for the Swedish industry sector). Minutes from the last meeting of the user council are available in Swedish at Statistics Sweden's website.
12.2.1. National Surveys and feedback
| Conduction of a user satisfaction survey or any other type of monitoring user satisfaction | No user satisfaction survey has been conducted. User satisfaction is mainly monitored through user councils. |
| User satisfaction survey specific for R&D statistics | No specific user satisfaction survey for R&D statistics has been conducted. There is, however, a specific user council for R&D statistics. |
| Short description of the feedback received | Overall user satisfacation is high. One issue that has recently been discussed is that comparability over time is very important, espacially in the light of the upcoming implementation of the statistical unit "enterprise". |
12.3. Completeness
See below.
12.3.1. Data completeness - rate
2 percent (6 percent for mandatory variables and 0 percent for voluntary variables).
12.3.2. Data availability
Share of PNP R&D expenditure in GERD (Gross Domestic Expenditure on R&D): 0,1 percent.
12.3.2.1. Incorporation of PNP sector in another sector
| Incorporation of PNP in another sector | The Private non-profit sector is reported seperately. |
| Reasons for not producing separate R&D statistics for the PNP sector | Not applicable, the Private non-profit sector is reported seperately. |
| Share of PNP expenditure in the total expenditure of the other sector | Not applicable, the Private non-profit sector is reported seperately. |
| Share of PNP R&D Personnel in the respective figure of the other sector | Not applicable, the Private non-profit sector is reported seperately. |
12.3.2.2. Non-collection of R&D data for the PNP sector
| Reasons for not compiling R&D statistics for the PNP sector | Not applicable, R&D statistics are produced for the Private non-profit sector. |
| PNP R&D expenditure/ GERD*100) | 0,1 percent. |
| Share of PNP R&D Personnel in the respective figure of the total national economy | 0,1 percent. |
12.3.2.3. Data availability on more detail level
| Additional dimension/variable available at national level1) | Availability2 | Frequency of data collection | Breakdown variables |
Combinations of breakdown variables | Level of detail |
1) This question is optional. It refers to variables and breakdowns NOT asked by the Commission Implementing Regulation (EU) No 2020/1197 (neither as 'optional').
2) Y-start year
13.1. Accuracy - overall
Accuracy in the statistical sense denotes the closeness of computations or estimates to the exact or true values. Statistics are not equal with the true values because of variability (the statistics change from implementation to implementation of the survey due to random effects) and bias (the average of the possible values of the statistics from implementation to implementation is not equal to the true value due to systematic effects).
Several types of statistical errors occur during the survey process. The following typology of errors has been adopted:
1. Sampling errors. These only affect sample surveys. They are due to the fact that only a subset of the population, usually randomly selected, is enumerated.
2. Non-sampling errors. Non-sampling errors affect sample surveys and complete enumerations alike and comprise:
a) Coverage errors,
b) Measurement errors,
c) Non response errors and
d) Processing errors.
Model assumption errors should be treated under the heading of the respective error they are trying to reduce.
13.2. Sampling error
That part of the difference between a population value and an estimate thereof, derived from a random sample, which is due to the fact that only a subset of the population is enumerated.
13.2.1. Sampling error - indicators
The main indicator used to measure sampling errors is the coefficient of variation (CV).
Definition of coefficient of variation:
CV= (Square root of the estimate of the sampling variance) / (Estimated value)
Coefficient of variation for Total R&D expenditure: Not applicable, no sample survey is used for the Private non-profit sector.
Coefficient of variation for Total R&D personnel (FTE): Not applicable, no sample survey is used for the Private non-profit sector.
13.3. Non-sampling error
Non-sampling errors occur in all phases of a survey. They add to the sampling errors (if present) and contribute to decreasing overall accuracy. It is important to assess their relative weight in the total error and devote appropriate resources for their control and assessment.
a) Extent of non-sampling errors:
Because figures for the Private non-profit sector are calculated using extrapolation, the main source of potential non-sampling errors is model assumptions.
b) Measures taken to reduce the extent of non-sampling errors:
An analysis of historical data has been conducted to validate the reasonableness of the model assumption that the development of R&D in government agencies can be used as a proxy for the development in the Private non-profit sector.
c) Methods used in order to correct / adjust for such errors:
There are no methods in place to correct or ajust for non-sampling errors.
13.3.1. Coverage error
Coverage errors are due to divergences between the target population and the frame population. The frame population is the set of target population members that has a chance to be selected into the survey sample. It is a listing of all items in the population from which the sample is drawn that contains contact details as well as sufficient information to perform stratification and sampling.
13.3.1.1. Over-coverage - rate
Not requested.
13.3.1.2. Common units - proportion
Not requested.
13.3.2. Measurement error
Not requested.
13.3.3. Non response error
Not requested.
13.3.3.1. Unit non-response - rate
Not requested.
13.3.3.2. Item non-response - rate
Not requested.
13.3.4. Processing error
Not requested.
13.3.5. Model assumption error
Not requested.
14.1. Timeliness
Timeliness and punctuality refer to time and dates, but in a different manner: the timeliness of statistics reflects the length of time between their availability and the event or phenomenon they describe. Punctuality refers to the time lag between the release date of the data and the target date on which they should have been delivered, with reference to dates announced in the official release calendar.
14.1.1. Time lag - first result
Time lag between the end of reference period and the release date of the results:
Indicator: (Release date of provisional/ first results) - (Date of reference for the data)
a) End of reference period: 2021-12-31
b) Date of first release of national data: 2022-07-14
c) Lag (days): 195
14.1.2. Time lag - final result
a) End of reference period: 2021-12-31
b) Date of first release of national data: 2022-10-27
c) Lag (days): 300
14.2. Punctuality
Punctuality refers to the time lag between the release date of data and the target date on which they were scheduled for release as announced officially.
14.2.1. Punctuality - delivery and publication
Punctuality of time schedule of data release = (Actual date of the data release) - (Scheduled date of the data release)
14.2.1.1. Deadline and date of data transmission
| Transmission of provisional data | Transmission of final data | |
| Legally defined deadline of data transmission (T+_ months) | 10 | 18 |
| Actual date of transmission of the data (T+x months) | 10 | 18 |
| Delay (days) | 0 | 0 |
| Reasoning for delay |
15.1. Comparability - geographical
See below.
15.1.1. Asymmetry for mirror flow statistics - coefficient
Not requested.
15.1.2. General issues of comparability
International comparability is generelly deemed to be poor. The main issue for comparability is missing values. Due to difficulties with accuracy only a small number of variables are available for the private non-profit sector.
15.1.3. Survey Concepts Issues
The following table lists a number of key survey concepts and conceptual issues; it gives reference to the Commission Implementing Regulation (EU) No 2020/1197 or Frascati manual paragraphs and the EBS Methodological Manual on R&D Statistics with recommendations about these concepts / issues.
| Concept / Issues | Reference to recommendations | Deviation from recommendations | Comments on national definition / Treatment – deviations from recommendations |
| R&D personnel | FM2015 Chapter 5 (mainly paragraph 5.2). | No deviation. | |
| Researcher | FM2015, § 5.35-5.39. | Not applicable. | Breakdown by function is not available for the Private non-profit sector. |
| Approach to obtaining Headcount (HC) data | FM2015, § 5.58-5.61 (in combination with Eurostat's EBS Methodological Manual on R&D Statistics). | Not applicable. | Headcount data are not available for the Private non-profit sector. |
| Reporting data according to formula: Total R&D personnel = Internal R&D personnel + External R&D personnel | FM2015, §5.25 | Yes. | No data available on external personnel. National definition of total personnel for the Private non-profit sector is therefore reported according to the formula: Total R&D personnel = Internal R&D personnel. |
| Approach to obtaining FTE data | FM2015, § 5.49-5.57 (in combination with Eurostat's EBS Methodological Manual on R&D Statistics). | No deviation. | |
| Intramural R&D expenditure | FM2015,Chapter 4 (mainly paragraph 4.2). | No deviation. | |
| Statistical unit | FM2015, § 10.40-10.42 (in combination with Eurostat's EBS Methodological Manual on R&D Statistics). | No deviation. | |
| Target population | FM2015, § 10.40-10.42 ((in combination with Eurostat's EBS Methodological Manual on R&D Statistics). | No deviation. | |
| Sector coverage | FM2015, § 10.2-10.8 ((in combination with Eurostat's EBS Methodological Manual on R&D Statistics). | No deviation. | |
| Reference period for the main data | Reg. 2020/1197: Annex 1, Table 18 | No deviation. | |
| Reference period for all data | Reg. 2020/1197: Annex 1, Table 18 | No deviation. |
15.1.4. Deviations from recommendations
The following table lists a number of key methodological issues, which may affect the international comparability of national R&D statistics. The table gives the references in the Frascati manual, where related recommendations are made. Countries are asked to report on the existence of any deviations from existing recommendations and comment upon.
| Methodological issues | Deviation from recommendations | Comments on national treatment / treatment deviations from recommendations |
| Data collection method | Not applicable. | No data collection is conducted for the Private non-profit sector. |
| Survey questionnaire / data collection form | Not applicable. | No data collection is conducted for the Private non-profit sector. |
| Cooperation with respondents | Not applicable. | No data collection is conducted for the Private non-profit sector. |
| Data processing methods | Not applicable. | No data collection is conducted for the Private non-profit sector. |
| Treatment of non-response | Not applicable. | No data collection is conducted for the Private non-profit sector. |
| Data compilation of final and preliminary data | No deviation. | Both preliminary and final data are compiled on the main indicators annually. |
15.2. Comparability - over time
See below.
15.2.1. Length of comparable time series
See below.
15.2.2. Breaks in time series
| Length of comparable time series | Break years1 | Nature of the breaks | |
| R&D personnel (HC) | 2011-2017 | 2017, 2013, 2011, 2009, 1997, 1995 |
2017: New variable estimation method resulting in this variable no longer being estimated. Direct data collection is no longer performed, estimations are instead calculated by using a simple moving average. 2013: Institutions are asked to report on head counts according to two, not three occupations: researchers and other staff. Other staff include technicians and equivalent staff and other supporting staff. 2011: New sample method. 2009: New sample method, sharp decrease in R&D personnel. 1997: The sharp decrease in R&D personnel in the PNP sector is partially due to modification of the national questionnaire. 1995: A number of institutions in the PNP sector are reclassified mainly in the business enterprise sector. |
| Function | 2011-2017 | 2017, 2013, 2011, 2009, 1997, 1995 | 2017: New variable estimation method resulting in this variable no longer being estimated. Direct data collection is no longer performed, estimations are instead calculated by using a simple moving average. 2013: Institutions are asked to report on head counts according to two, not three occupations: researchers and other staff. Other staff include technicians and equivalent staff and other supporting staff. 2011: New sample method. 2009: New sample method, sharp decrease in R&D personnel. 1997: The sharp decrease in R&D personnel in the PNP sector is partially due to modification of the national questionnaire. 1995: A number of institutions in the PNP sector are reclassified mainly in the business enterprise sector. |
| Qualification | |||
| R&D personnel (FTE) | 2017-2021 | 2017, 2013, 2011, 2009, 1997, 1995 | 2017: New variable estimation method resulting in this variable no longer being estimated. Direct data collection is no longer performed, estimations are instead calculated by using a simple moving average. 2013: Institutions are asked to report on head counts according to two, not three occupations: researchers and other staff. Other staff include technicians and equivalent staff and other supporting staff. 2011: New sample method. 2009: New sample method. 1997: The sharp decrease in R&D personnel in the PNP sector is partially due to modification of the national questionnaire. 1995: A number of institutions in the PNP sector are reclassified mainly in the business enterprise sector. |
| Function | 2013-2017 | 2017, 2013, 2011, 2009, 1997, 1995 | 2017: New variable estimation method resulting in this variable no longer being estimated. Direct data collection is no longer performed, estimations are instead calculated by using a simple moving average. 2013: Institutions are asked to report on head counts according to two, not three occupations: researchers and other staff. Other staff include technicians and equivalent staff and other supporting staff. 2011: New sample method. 2009: New sample method. 1997: The sharp decrease in R&D personnel in the PNP sector is partially due to modification of the national questionnaire. 1995: A number of institutions in the PNP sector are reclassified mainly in the business enterprise sector. |
| Qualification | |||
| R&D expenditure | 2017-2021 | 2017, 2013, 2011, 2009, 1995, 1993 | 2017: New variable estimation method. Direct data collection is no longer performed, estimations are instead calculated by using a simple moving average. 2011: New sample method. 2009: New sample method, sharp decrease in R&D expenditure. 1995: A number of institutions in the PNP sector are reclassified mainly in the business enterprise sector. 1993: SSH R&D was included in the PNP sector, resulting in a break in series. |
| Source of funds | 2011-2017 | 2017, 2011, 2009, 1997 | 2017: New variable estimation method. Direct data collection is no longer performed, estimations are instead calculated by using a simple moving average. 2011: New sample method. 2009: New sample method. 1997: Due to a change in statute, the funding from Public Research Foundations previously considered as funding from the PNP sector has been reclassified as funding from the Government sector. Consequently, 1997 data on R&D funding from Government and PNP sectors are not comparable to those for previous years. |
| Type of costs | 2011-2017 | 2017, 2011, 2009 | 2017: New variable estimation method. Direct data collection is no longer performed, estimations are instead calculated by using a simple moving average. 2011: New sample method. 2009: New sample method. |
| Type of R&D | 2017-2021 | 2017, 2013 | 2017: New variable estimation method. Direct data collection is no longer performed, estimations are instead calculated by using a simple moving average. 2013: New question. |
| Other |
1) Breaks years are years for which data are not fully comparable to the previous period.
15.2.3. Collection of data in the even years
Statistics are produced in the same way for all reference years.
15.3. Coherence - cross domain
See below.
15.3.1. Coherence - sub annual and annual statistics
Not requested.
15.3.2. Coherence - National Accounts
Not available, no analysis of coherence with the National Accounts has been conducted.
15.4. Coherence - internal
See below.
15.4.1. Comparison between preliminary and final data
This part compares key R&D variables as preliminary and final data.
| Total PNP R&D expenditure (in 1000 of national currency) | Total PNP R&D personnel (in FTEs) | Total number of PNP researchers (in FTEs) | |
| Preliminary data (delivered at T+10) | 212 000 | 109 | Not available, data on researchers are not reported for the Private non-profit sector. |
| Final data (delivered T+18) | 213 000 | 109 | Not available, data on researchers are not reported for the Private non-profit sector. |
| Difference (of final data) | 1 000 | 0 | Not available, data on researchers are not reported for the Private non-profit sector. |
15.4.2. Consistency between R&D personnel and expenditure
| Average remuneration (cost in national currency) | |
| Consistency between FTEs of internal R&D personnel and R&D labour costs (1) | Not applicable, no breakdown by type of cost is available for the Private non-profit sector. |
| Consistency between FTEs of external R&D personnel and other current costs for external R&D personnel (2) | Not applicable, no breakdown by type of cost or data on external R&D personnel are available for the Private non-profit sector. |
(1) Calculate the average remuneration (cost) of individuals belonging to the internal R&D personnel, excluding those who are only formally ‘employees’ (university students, grant holders, etc.).
(2) Calculate the average remuneration (cost) of individuals belonging to the external R&D personnel (FTEs/other current R&D costs for external R&D personnel).
The assessment of costs associated with a statistical product is a rather complicated task since there must exist a mechanism for appointing portions of shared costs (for instance shared IT resources and dissemination channels) and overheads (office space, utility bills etc). The assessment must become detailed and clear enough so that international comparisons among agencies of different structures are feasible.
16.1. Costs summary
| Costs for the statistical authority (in national currency) | % sub-contracted1) | |
| Staff costs | ||
| Data collection costs | ||
| Other costs | ||
| Total costs | ||
| Comments on costs | ||
| Not available, costs are not reported on such detailed level. | ||
1) The shares of the figures given in the first column that are accounted for by payments to private firms or other Government agencies.
16.2. Components of burden and description of how these estimates were reached
| Value | Computation method | |
| Number of Respondents (R) | Not applicable, no data collection conducted for the Private non-profit sector. | |
| Average Time required to complete the questionnaire in hours (T)1 | Not applicable, no data collection conducted for the Private non-profit sector. | |
| Average hourly cost (in national currency) of a respondent (C) | Not applicable, no data collection conducted for the Private non-profit sector. | |
| Total cost | Not applicable, no data collection conducted for the Private non-profit sector. |
1) T = the time required to provide the information, including time spent assembling information prior to completing a form or taking part in interview and the time taken up by any subsequent contacts after receipt of the questionnaire (‘Re-contact time’)
17.1. Data revision - policy
Not requested.
17.2. Data revision - practice
Not requested.
17.2.1. Data revision - average size
Not requested.
18.1. Source data
Several separate activities are used for the collection of raw data or pre-compiled administrative data and statistics related to R&D. For simplicity, we call them surveys irrespective of whether they are sample surveys, censuses, collections of administrative data/pre-compiled statistics. This section presents the names of the surveys by sector of performance as well as methodological information for each survey. Depending on the type of survey and sector of performance, only the sections corresponding to that survey and sector are filled in.
18.1.1. Data source – general information
| Survey name | R&D in the Private non-profit sector. |
| Type of survey | Model based extrapolation. |
| Combination of sample survey and census data | Not applicable, no combination of sample survey and census data is used for the compilation of R&D statistics for the Private non-profit sector. |
| Combination of dedicated R&D and other survey(s) | Not applicable, no combination of dedicated R&D and other surveys is used for the compilation of R&D statistics for the Private non-profit sector. |
| Sub-population A (covered by sampling) | Not applicable, no sample survey is used for the compilation of R&D statistics for the Private non-profit sector. |
| Sub-population B (covered by census) | Not applicable, no census survey is used for the compilation of R&D statistics for the Private non-profit sector. |
| Variables the survey contributes to | The survey contributes to intramural R&D expenditure and internal R&D personnel. |
| Survey timetable-most recent implementation | September - October. |
18.1.2. Sample/census survey information
| Stage 1 | Stage 2 | Stage 3 | |
| Sampling unit | Not applicable, no sample or census survey is used for the compilation of R&D statistics for the Private non-profit sector. | ||
| Stratification variables (if any - for sample surveys only) | Not applicable, no sample or census survey is used for the compilation of R&D statistics for the Private non-profit sector. | ||
| Stratification variable classes | Not applicable, no sample or census survey is used for the compilation of R&D statistics for the Private non-profit sector. | ||
| Population size | 1 600 institutional units. | ||
| Planned sample size | Not applicable, no sample or census survey is used for the compilation of R&D statistics for the Private non-profit sector. | ||
| Sample selection mechanism (for sample surveys only) | Not applicable, no sample or census survey is used for the compilation of R&D statistics for the Private non-profit sector. | ||
| Survey frame | Not applicable, no sample or census survey is used for the compilation of R&D statistics for the Private non-profit sector. | ||
| Sample design | Not applicable, no sample or census survey is used for the compilation of R&D statistics for the Private non-profit sector. | ||
| Sample size | Not applicable, no sample or census survey is used for the compilation of R&D statistics for the Private non-profit sector. | ||
| Survey frame quality | Not applicable, no sample or census survey is used for the compilation of R&D statistics for the Private non-profit sector. |
18.1.3. Information on collection of administrative data or of pre-compiled statistics
| Source | R&D in the Government Sector. |
| Description of collected data / statistics | Data on internal R&D personnel in full-time equivalents and total intramural R&D exenditure for government agencies between for the reference year and three reference periods previously. |
| Reference period, in relation to the variables the survey contributes to | 2018-2021. |
18.2. Frequency of data collection
Pre-compiled statistics from R&D in the Govenment sector are collected annually.
18.3. Data collection
See below.
18.3.1. Data collection overview
| Information provider | Statistics Sweden provides pre-compiled statistics. |
| Description of collected information | The collected information consists of data on internal R&D personnel in full-time equivalents and total intramural R&D exenditure for government agencies between for the reference year and three reference periods previously. |
| Data collection method | Data is accessed from an internal database at Statistics Sweden. |
| Time-use surveys for the calculation of R&D coefficients | Not applicable, no time-use survey is conducted for the Private non-profit sector. |
| Realised sample size (per stratum) | Not applicable, no sample survey is conducted for the Private non-profit sector. |
| Mode of data collection (face-to-face interviews; telephone interviews; postal surveys, etc.) | See description of data collection method above. |
| Incentives used for increasing response | Not applicable, because only pre-compiled statistics are collected there are no issues with non-response. |
| Follow-up of non-respondents | Not applicable, because only pre-compiled statistics are collected there are no issues with non-response. |
| Replacement of non-respondents (e.g. if proxy interviewing is employed) | Not applicable, because only pre-compiled statistics are collected there are no issues with non-response. |
| Response rate (ratio of completed "interviews" over total number of eligible enterprises or enterprises of unknown eligibility) | Not applicable, because only pre-compiled statistics are collected there are no issues with non-response. |
| Non-response analysis (if applicable -- also see section 18.5. Data compilation - Weighting and Estimation methods) | Not applicable, because only pre-compiled statistics are collected there are no issues with non-response. |
18.3.2. Questionnaire and other documents
| Annex | Name of the file |
| R&D national questionnaire and explanatory notes in English: | Not applicable, no quesionnaire is used for the compilation of R&D statistics for the Private non-profit sector. |
| R&D national questionnaire and explanatory notes in the national language: | Not applicable, no quesionnaire is used for the compilation of R&D statistics for the Private non-profit sector. |
| Other relevant documentation of national methodology in English: | No documentation available in English. |
| Other relevant documentation of national methodology in the national language: | Methodology documentation. |
Annexes:
Methodology documentation (available in Swedish only)
18.4. Data validation
Not applicable, no raw or administrative data collected. For information on data validation for R&D in the Governement sector, see the documentation for that sector.
18.5. Data compilation
See below.
18.5.1. Imputation - rate
Not applicable, imputation is not used for the Private non-profit sector.
18.5.2. Data compilation methods
| Data compilation method - Final data (between the survey years) | Data are compiled annually for the Private non-profit sector. For information on data compilation between the survey years for the Government sector, see the documentation for that sector. |
| Data compilation method - Preliminary data | Preliminary data and final data are compiled using the same method for the Private non-profit sector. For information on data compilation of priliminary data for the Government sector, see the documentation for that sector. |
18.5.3. Measurement issues
| Method of derivation of regional data | Not applicable, no breakdown by region is available for the Private non-profit sector. |
| Coefficients used for estimation of the R&D share of more general expenditure items | Not applicable, R&D coefficients are not used for the Private non-profit sector. |
| Inclusion or exclusion of VAT and provisions for depreciation in the measurement of expenditures | VAT is included in intramural R&D expenditure while depreciations are excluded. |
| Differences between national and Frascati Manual classifications not mentioned above and impact on national statistics | No additional differences. |
18.5.4. Weighting and estimation methods
| Description of weighting method | Not applicable, weighting is not used. |
| Description of the estimation method | The estimation method used is a simple moving average according to the following formula: 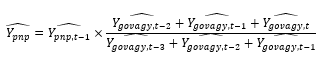
Where;
Ypnp is the variable to be estimated for the Private non-profit sector,
Ygovagy is the value for the variable for government agencies, and
t is the reference year for the variable Y.
|
18.6. Adjustment
Not requested.
18.6.1. Seasonal adjustment
Not requested.
Statistics on Private non-profit R&D (PNPRD) measure research and experimental development (R&D) performed in the private non-profit sector, i.e. R&D expenditure and R&D personnel. In line with this objective the target population for the national R&D survey of the private non-profit sector should consist of all R&D performing units (including all R&D performers – occasional and continuous, known and unknown - in all branches and size classes) belonging to this sector.
The main concepts and definitions used for the production of R&D statistics are given by the OECD (2015), Frascati Manual 2015: Guidelines for Collecting and Reporting Data on Research and Experimental Development, The Measurement of Scientific, Technological and Innovation Activities, which is the internationally recognised standard methodology for collecting R&D statistics and by Eurostat’s European Business Statistics Methodological Manual on R&D Statistics (EBS Methodological Manual on R&D Statistics).
Since the beginning of 2021, the collection of R&D statistics is based on Commission Implementing Regulation (EU) No 2020/1197 of 30 July 2020. The Regulation sets the framework for the collection of R&D statistics and specifies the main variables of interest and their breakdowns at predefined level of detail. Statistics on science, technology and innovation were collected until the end of 2020 based on the Commission Implementing Regulation (EU) No 2012/995 concerning the production and development of Community statistics on science and technology.
14 August 2023
See below.
The statistical unit is the institutional unit as defined by Council Regulation (EEC) No 1993/696 of 15 March 1993.
See below.
Not requested. R&D statistics cover national and regional data.
2021
Accuracy in the statistical sense denotes the closeness of computations or estimates to the exact or true values. Statistics are not equal with the true values because of variability (the statistics change from implementation to implementation of the survey due to random effects) and bias (the average of the possible values of the statistics from implementation to implementation is not equal to the true value due to systematic effects).
Several types of statistical errors occur during the survey process. The following typology of errors has been adopted:
1. Sampling errors. These only affect sample surveys. They are due to the fact that only a subset of the population, usually randomly selected, is enumerated.
2. Non-sampling errors. Non-sampling errors affect sample surveys and complete enumerations alike and comprise:
a) Coverage errors,
b) Measurement errors,
c) Non response errors and
d) Processing errors.
Model assumption errors should be treated under the heading of the respective error they are trying to reduce.
National currency in thousands and full-time equivalents.
See below.
Several separate activities are used for the collection of raw data or pre-compiled administrative data and statistics related to R&D. For simplicity, we call them surveys irrespective of whether they are sample surveys, censuses, collections of administrative data/pre-compiled statistics. This section presents the names of the surveys by sector of performance as well as methodological information for each survey. Depending on the type of survey and sector of performance, only the sections corresponding to that survey and sector are filled in.
Annually.
Timeliness and punctuality refer to time and dates, but in a different manner: the timeliness of statistics reflects the length of time between their availability and the event or phenomenon they describe. Punctuality refers to the time lag between the release date of the data and the target date on which they should have been delivered, with reference to dates announced in the official release calendar.
See below.
See below.
