


1.1. Contact organisation
European Commission - Eurostat
1.2. Contact organisation unit
Unit E.5: Energy
1.3. Contact name
Confidential because of GDPR
1.4. Contact person function
Confidential because of GDPR
1.5. Contact mail address
European Commission - Eurostat
Unit ESTAT.E.5: Energy
L-2920 Luxembourg
1.6. Contact email address
Confidential because of GDPR
1.7. Contact phone number
Confidential because of GDPR
1.8. Contact fax number
Confidential because of GDPR
2.1. Metadata last certified
29 January 20242.2. Metadata last posted
29 January 20242.3. Metadata last update
29 January 2024Diversity index shows in one figure how varied energy sources used in a country are – the composition of energy sources in the energy mix. It is based on the Herfindahl-Hirschman index principle. This indicator can reach values only between 0 and 1. Lower values of this index means more varied sources (fuel mix); higher values means less variation (tendency towards a limites set of dominant fuels).
This indicator can help to see how diversified the fuel mix is and how easily a single event can affect it, be it drought (hydro power shortage), excessive prices (natural gas, electricity) or any other event.
4.1. Data description
Diversity index is caluclated from data in energy balances. It is calulated for overall supply (primary production + recovered & recycled products + imports + stock draw) and for sectors/categories of final energy consumption.
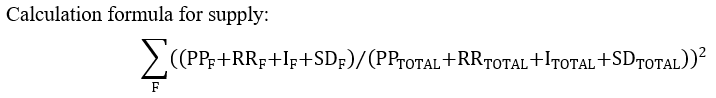
In the calculation above, PP= primary production, RR = recovered & recycled products, I = imports, SD = stock draw, F means fuel and all availabel fuels of energy balance are used.
Resulting calculations are rounded to 4 decimal places.
4.2. Unit of measure
[INX] Index
4.3. Reference Period
The calendar year (January - December)
4.4. Accuracy - overall
The indicator is produced according to the high-level quality standards of European Statistical System. While indirect indicators suggest overall accuracy of energy balance should be in general high, quantitative assessment of accuracy was not performed by Eurostat. Please see Related metadata for details on accuracy of the source datasets used to calculate this indicator.
4.5. Source data
4.5.1. Source data - Organisation
European Commission - Eurostat
4.5.2. Source data - Comment
Please see Related metadata for specific information on source data used to calculate this indicator.
5.1. Frequency of dissemination
5.1.1. Frequency of dissemination - Grade
Every year5.1.2. Frequency of dissemination - Comment
Revisions several time per year are possible.
5.2. Timeliness
5.2.1. Timeliness - Grade
T+2 years5.2.2. Timeliness - Comment
6.1. Reference area
6.1.1. Reference Area - Grade
All EU MS6.1.2. Reference Area - Comment
Data are presented for all EU Member States
6.2. Comparability - geographical
6.2.1. Comparability - geographical - Grade
All EU MS6.2.2. Comparability - geographical - Comment
Data are comparable between all EU Member States and between other presented countries.
6.3. Coverage - Time
6.3.1. Time Coverage - Grade
> 10 years6.3.2. Time Coverage - Comment
All EU Member States have long time series
6.4. Comparability - over time
6.4.1. Comparability - over time - Grade
> 4 data points6.4.2. Comparability - over time - Comment
Comparability over time is ensured with a solid methodology harmonised on international level that is stable over long periods. Occasional breaks in time series are present due to the developments of statistical systems on national level and the level of detailed information (micro data) available at national level.
In general comparability is very high in last 10 years and for older periods slowly decreasing. In addition, introduction of new statistical information in the most recent data collections can lead to breaks in series until information is compiled and provided by reporting countries.
7.1. Dissemination format - Publications
https://ec.europa.eu/eurostat/web/energy/publications
Paper publications have been abolished.
7.2. Dissemination format - online database
Dissemination is maintained on Eurostat's database: https://ec.europa.eu/eurostat/web/energy/database
7.3. Dissemination format - other
Information not available. Redissemination of this indicator is not monitored.
No flags are used in this indicator, please refer to source datasets for all specificities and particularities.
This dataset is not dynamicaly linked to source data and consequently data revisions are not immediately applied.
