 |
|
 |
|
| For any question on data and metadata, please contact: Eurostat user support |
|
|||
| 1.1. Contact organisation | National Statistical Institute, Republic of Bulgaria |
||
| 1.2. Contact organisation unit | Statistics on Labour Unit Business Statistics Department |
||
| 1.5. Contact mail address | 2, P. Volov Str. 1038 Sofia Bulgaria |
||
|
|||
| 2.1. Data description | |||
The Labour Cost Survey was carried out for the fifth time by the National Statistical Institute of Bulgaria under the requirements of Council Regulation (EC) No 530/1999, the Commission Regulation (EC) No 1726/1999 and the Commission Regulation (EC) No 1737/2005. The source used for obtaining the Labour Cost Survey data was the national Annual Enterprises’ Survey on Labour (AES), which is an exhaustive survey amongst all economically active enterprises in the reference year. For the LCS’2016, as it was for the 2012 round, a number of additional variables were added to its questionnaire in order to obtain compliance with the CR 1737/2005. This quality report is prepared in accordance with the Commission Regulation No 698/2006 of 5 May 2006 implementing Council Regulation (EC) No. 530/1999 concerning quality evaluation of structural statistics on labour costs and earnings. Following the structure of the Commission Regulation, the document provides information on the six dimensions of the European Statistical System quality definition, namely relevance, accuracy, timeliness and punctuality, accessibility and clarity, comparability and coherence. |
|||
| 2.2. Classification system | |||
Classification of economic activities 2008 - comparable with NACE Rev.2. |
|||
| 2.3. Coverage - sector | |||
Covered are enterprises (local units) from all economic activities except „Agriculture, hunting, forestry and fishing”. |
|||
| 2.4. Statistical concepts and definitions | |||
Employees are all persons who have a labour contract (fixed or permanent; full-time or part-time) with their employer by virtue of the Labour Code or the Civil Servants Act and who receive remuneration in cash or in kind for certain quality and quantity of work done. Number of employees excludes:
Full-time employees are those whose regular working hours are the same as collectively agreed or customary hours worked in the observed local unit or for certain occupational groups. Part-time employees (half-day, half-week, half-month) are those whose regular working hours (daily, weekly, monthly) is less then collectively agreed or customary hours for the observed local unit or occupational group. Days worked – the total number of days worked by all employees under labour contract during the reference year. For a day worked is considered every day spent on work irrespective of the number of actual hours spent. Days not worked but nevertheless paid byt he employer– the number of days not worked due to annual holydays/vacation, absence due to sickness (if it is paid by the employer), public holydays and other paid but not work days. Hour actually worked - the total number of hours worked by all employees during the year. Hours actually worked are defined as the sum of all periods spent on direct and ancillary activities to produce goods and services. Total Labour Costs includes wages and salaries paid by the employer in cash or in kind, employers’ actual and imputed social contribution, taxes regarded as labour costs, vocational training costs and other labour costs.
Gross annual wages and salaries are the remunerations paid regularly to the employees by the employers before the deduction of any tax and social security contributions payable by the employees and withheld by the employers.
Gross wages and salaries comprise of:
Employers' statutory social-security contributions.These consist of payments made compulsory by law and payable by employers for the benefit of their employees to social-security institutions. They include contributions to insurance schemes for retirement pension, sickness, maternity and disability, to unemployment insurance schemes, to insurance schemes for occupational accidents and diseases etc.
Collectively agreed, contractual and voluntary social-security contributions payable by the employer These are all contributions paid by the employer to social-security schemes which are supplementary to those which are compulsory by law. They include supplementary pension sickness and unemployment insurance schemes.
Employers’ imputed social contributions these are payments madedirectly by employers to their employees or former employees without involving a social-security fund. Instead, the benefits are paid out of the own resources of the employers. Examples for such payments are: guaranteed remuneration in the event of sickness (for the first three days), payments to employees leaving the enterprise, payments made to employees on retirement etc.
Social expenses and benefits (payments in kind) - this variable refers to an estimate of the value of all goods and services made available to employees through the employer. It includes, meal vouchers, company products, staff housing, covering transport expenses between home and work place, company cars, etc.
Vocational training costs paid by the employer - these include: expenditure on vocational-training services and facilities small repairs and maintenance of buildings and installations, excluding staff costs; expenditure on participation in courses; the fees of instructors from outside the enterprise; expenditure on teaching aids and tools used for training; sums paid by the enterprise to vocational-training organizations, etc. Other expenditure paid by the employer - this includes in particular: recruitment costs (these are the sums paid to recruitment agencies, expenditure on job advertisements in the press, travel expenses paid to candidates called for interview, installation allowances paid to newly recruited staff, and working clothes provided by the employer.
|
|||
| 2.5. Statistical unit | |||
The observation units are enterprises – companies, ministries, departments, political, religious, public and other organizations, that perform economical activities in Republic of Bulgaria during the reference year.
|
|||
| 2.6. Statistical population | |||
The labour costs statistics is based on the survey on the employees, wages and salaries and other labour costs, which is an exhaustive for all public and private sector enterprises irrespective of their economic activity and the legislation according to which they are founded. |
|||
| 2.7. Reference area | |||
The whole country is covered. |
|||
| 2.8. Coverage - Time | |||
2008,2012,2016 |
|||
| 2.9. Base period | |||
Not relevant |
|||
|
||||||||||||||||||||||||||||||||||||||||||||||||||||||||||||||||||||||||||||||||||||||||||||||||||||||||||||||||||||||||||||||||||||||||||||||||||||||||||||||||||||||||||||||||||||||||||||||||||||||||||||||||||||||||||||||||||||||||||||||||||||||||||||||||||||||||||||||||||||||||||||||||||||||||||||||||||||||||||||||||||||||||||||||
- |
||||||||||||||||||||||||||||||||||||||||||||||||||||||||||||||||||||||||||||||||||||||||||||||||||||||||||||||||||||||||||||||||||||||||||||||||||||||||||||||||||||||||||||||||||||||||||||||||||||||||||||||||||||||||||||||||||||||||||||||||||||||||||||||||||||||||||||||||||||||||||||||||||||||||||||||||||||||||||||||||||||||||||||||
| 3.1. Source data | ||||||||||||||||||||||||||||||||||||||||||||||||||||||||||||||||||||||||||||||||||||||||||||||||||||||||||||||||||||||||||||||||||||||||||||||||||||||||||||||||||||||||||||||||||||||||||||||||||||||||||||||||||||||||||||||||||||||||||||||||||||||||||||||||||||||||||||||||||||||||||||||||||||||||||||||||||||||||||||||||||||||||||||||
As no dedicated Labour Costs Survey was conducted for obtaining the 2016 data, but the exhaustive AES was used as a basis and extended with new variables, this section of the quality report is not relevant. All enterprises that perform economic activity in Bulgaria are obliged under the acting legislation to submit to the National Statistical Institute and National Revenue Agency (NRA) an annual activity report (incl. the statistical form on labour costs). Therefore in the 2016 as in 2012 the number of local units, sample (E.2) is equal to the number of local units, universe (E.1). For the reference year 2016 around 224 thousand enterprises/local units submitted information on employment and labour costs to the NSI. Nearly 83% of them are in the small size class (between 1 to 9 employees), covering 19% of the employees. In the structure of local units by economic activities the biggest relative share was in NACE section G - “Wholesale and retail trade; repair of motor vehicles and motorcycles” (35%) and section C - “Manufacturing” (10%). The two following tables present the break down of the surveyed population by economic activities (NACE Rev.2 Sections) and size classes.
Table 1. Number of local units in the population
Table 2. Total number of employees
.. Confidential data
|
||||||||||||||||||||||||||||||||||||||||||||||||||||||||||||||||||||||||||||||||||||||||||||||||||||||||||||||||||||||||||||||||||||||||||||||||||||||||||||||||||||||||||||||||||||||||||||||||||||||||||||||||||||||||||||||||||||||||||||||||||||||||||||||||||||||||||||||||||||||||||||||||||||||||||||||||||||||||||||||||||||||||||||||
| 3.2. Frequency of data collection | ||||||||||||||||||||||||||||||||||||||||||||||||||||||||||||||||||||||||||||||||||||||||||||||||||||||||||||||||||||||||||||||||||||||||||||||||||||||||||||||||||||||||||||||||||||||||||||||||||||||||||||||||||||||||||||||||||||||||||||||||||||||||||||||||||||||||||||||||||||||||||||||||||||||||||||||||||||||||||||||||||||||||||||||
Four-yearly. |
||||||||||||||||||||||||||||||||||||||||||||||||||||||||||||||||||||||||||||||||||||||||||||||||||||||||||||||||||||||||||||||||||||||||||||||||||||||||||||||||||||||||||||||||||||||||||||||||||||||||||||||||||||||||||||||||||||||||||||||||||||||||||||||||||||||||||||||||||||||||||||||||||||||||||||||||||||||||||||||||||||||||||||||
| 3.3. Data collection | ||||||||||||||||||||||||||||||||||||||||||||||||||||||||||||||||||||||||||||||||||||||||||||||||||||||||||||||||||||||||||||||||||||||||||||||||||||||||||||||||||||||||||||||||||||||||||||||||||||||||||||||||||||||||||||||||||||||||||||||||||||||||||||||||||||||||||||||||||||||||||||||||||||||||||||||||||||||||||||||||||||||||||||||
The survey is exhaustive for all public and private sector enterprises. |
||||||||||||||||||||||||||||||||||||||||||||||||||||||||||||||||||||||||||||||||||||||||||||||||||||||||||||||||||||||||||||||||||||||||||||||||||||||||||||||||||||||||||||||||||||||||||||||||||||||||||||||||||||||||||||||||||||||||||||||||||||||||||||||||||||||||||||||||||||||||||||||||||||||||||||||||||||||||||||||||||||||||||||||
| 3.4. Data validation | ||||||||||||||||||||||||||||||||||||||||||||||||||||||||||||||||||||||||||||||||||||||||||||||||||||||||||||||||||||||||||||||||||||||||||||||||||||||||||||||||||||||||||||||||||||||||||||||||||||||||||||||||||||||||||||||||||||||||||||||||||||||||||||||||||||||||||||||||||||||||||||||||||||||||||||||||||||||||||||||||||||||||||||||
For the statistical form on employment, time worked and labour costs there were total 100 plausibility checks, 25 of them were warnings (indicating a plausible outlier) allowing the respondent to continue and 75 were absolute ones that must be corrected in order NSI to consider the data accepted. The most important probability checks were as follows:
|
||||||||||||||||||||||||||||||||||||||||||||||||||||||||||||||||||||||||||||||||||||||||||||||||||||||||||||||||||||||||||||||||||||||||||||||||||||||||||||||||||||||||||||||||||||||||||||||||||||||||||||||||||||||||||||||||||||||||||||||||||||||||||||||||||||||||||||||||||||||||||||||||||||||||||||||||||||||||||||||||||||||||||||||
| 3.5. Data compilation | ||||||||||||||||||||||||||||||||||||||||||||||||||||||||||||||||||||||||||||||||||||||||||||||||||||||||||||||||||||||||||||||||||||||||||||||||||||||||||||||||||||||||||||||||||||||||||||||||||||||||||||||||||||||||||||||||||||||||||||||||||||||||||||||||||||||||||||||||||||||||||||||||||||||||||||||||||||||||||||||||||||||||||||||
The data processing goes through the following stages:
|
||||||||||||||||||||||||||||||||||||||||||||||||||||||||||||||||||||||||||||||||||||||||||||||||||||||||||||||||||||||||||||||||||||||||||||||||||||||||||||||||||||||||||||||||||||||||||||||||||||||||||||||||||||||||||||||||||||||||||||||||||||||||||||||||||||||||||||||||||||||||||||||||||||||||||||||||||||||||||||||||||||||||||||||
| 3.6. Adjustment | ||||||||||||||||||||||||||||||||||||||||||||||||||||||||||||||||||||||||||||||||||||||||||||||||||||||||||||||||||||||||||||||||||||||||||||||||||||||||||||||||||||||||||||||||||||||||||||||||||||||||||||||||||||||||||||||||||||||||||||||||||||||||||||||||||||||||||||||||||||||||||||||||||||||||||||||||||||||||||||||||||||||||||||||
not applicable |
||||||||||||||||||||||||||||||||||||||||||||||||||||||||||||||||||||||||||||||||||||||||||||||||||||||||||||||||||||||||||||||||||||||||||||||||||||||||||||||||||||||||||||||||||||||||||||||||||||||||||||||||||||||||||||||||||||||||||||||||||||||||||||||||||||||||||||||||||||||||||||||||||||||||||||||||||||||||||||||||||||||||||||||
|
|||
| 4.1. Quality assurance | |||
According to Article 2, point 3 from the Law on Statistics the statistical information shall be produced in compliance with the following criteria for quality: adequacy, accuracy, timeliness, punctuality, accessibility and clarity, comparability and logical consistency. According to Article 10 from Council Regulation (EC) No 530/1999 of 9 March 1999 concerning structural statistics on earnings and on labour costs the national authorities shall ensure that the results reflect the true situation of the total population of units with a sufficient degree of representativity. The national authorities shall forward to Eurostat at its request after each reference period a report containing all relevant information relating to the implementation of the Regulation in the Member State concerned, to enable the quality of the statistics to be evaluated. |
|||
| 4.2. Quality management - assessment | |||
[Not requested] |
|||
|
|||
- |
|||
| 5.1. Relevance - User Needs | |||
The user groups are defined on the base of the data requests received by NSI. The customers of the LCS results can be classified as follows:
|
|||
| 5.2. Relevance - User Satisfaction | |||
The LCS 2016 satisfies the data needs of the European Commission in terms of coverage – all size classes of enterprises are covered as well all economic activities. |
|||
| 5.3. Completeness | |||
The survey covers all mandatory variables (except those related to the apprentices and payments to employees’ saving schemes). |
|||
| 5.3.1. Data completeness - rate | |||
[Not requested] |
|||
|
||||||||||||||||||||||||||||||||||||||||||||||||||||||||||||||||||||||||||||||||||||||||||||||||||||||||||||||||
- |
||||||||||||||||||||||||||||||||||||||||||||||||||||||||||||||||||||||||||||||||||||||||||||||||||||||||||||||||
| 6.1. Accuracy - overall | ||||||||||||||||||||||||||||||||||||||||||||||||||||||||||||||||||||||||||||||||||||||||||||||||||||||||||||||||
[Not requested] |
||||||||||||||||||||||||||||||||||||||||||||||||||||||||||||||||||||||||||||||||||||||||||||||||||||||||||||||||
| 6.2. Sampling error | ||||||||||||||||||||||||||||||||||||||||||||||||||||||||||||||||||||||||||||||||||||||||||||||||||||||||||||||||
|
As no dedicated Labour Costs Survey was conducted for obtaining the 2016 data, but the exhaustive AES was used as a basis and extended with new variables, this section of the quality report is not relevant.
|
||||||||||||||||||||||||||||||||||||||||||||||||||||||||||||||||||||||||||||||||||||||||||||||||||||||||||||||||
| 6.2.1. Sampling error - indicators | ||||||||||||||||||||||||||||||||||||||||||||||||||||||||||||||||||||||||||||||||||||||||||||||||||||||||||||||||
Not Relevant |
||||||||||||||||||||||||||||||||||||||||||||||||||||||||||||||||||||||||||||||||||||||||||||||||||||||||||||||||
| 6.3. Non-sampling error | ||||||||||||||||||||||||||||||||||||||||||||||||||||||||||||||||||||||||||||||||||||||||||||||||||||||||||||||||
not applicable |
||||||||||||||||||||||||||||||||||||||||||||||||||||||||||||||||||||||||||||||||||||||||||||||||||||||||||||||||
| 6.3.1. Coverage error | ||||||||||||||||||||||||||||||||||||||||||||||||||||||||||||||||||||||||||||||||||||||||||||||||||||||||||||||||
not applicable |
||||||||||||||||||||||||||||||||||||||||||||||||||||||||||||||||||||||||||||||||||||||||||||||||||||||||||||||||
| 6.3.1.1. Over-coverage - rate | ||||||||||||||||||||||||||||||||||||||||||||||||||||||||||||||||||||||||||||||||||||||||||||||||||||||||||||||||
In the case of exhaustive survey, as over-coverage errors have been considered only the cases when the data for a single unit has been entered twice. This could happen when the unit has submitted its information using both available options for data delivery (on paper and by electronic way). These errors were captured and removed by computer program. Under coverage errors coincide with non-response when a unit has not reported its activity in front of the tax and statistical authorities. |
||||||||||||||||||||||||||||||||||||||||||||||||||||||||||||||||||||||||||||||||||||||||||||||||||||||||||||||||
| 6.3.1.2. Common units - proportion | ||||||||||||||||||||||||||||||||||||||||||||||||||||||||||||||||||||||||||||||||||||||||||||||||||||||||||||||||
[Not requested] |
||||||||||||||||||||||||||||||||||||||||||||||||||||||||||||||||||||||||||||||||||||||||||||||||||||||||||||||||
| 6.3.2. Measurement error | ||||||||||||||||||||||||||||||||||||||||||||||||||||||||||||||||||||||||||||||||||||||||||||||||||||||||||||||||
For the 2016 LCS, respondents were able to choose between two data collection modes. They could submit the requested statistical data on paper or via internet through Information System “Business Statistics”. The system was developed as a web-based, user oriented application including logical and arithmetic checks for all statistical forms that a part of it. |
||||||||||||||||||||||||||||||||||||||||||||||||||||||||||||||||||||||||||||||||||||||||||||||||||||||||||||||||
| 6.3.3. Non response error | ||||||||||||||||||||||||||||||||||||||||||||||||||||||||||||||||||||||||||||||||||||||||||||||||||||||||||||||||
Two different methods were used to deal with the non-responding units. First a comparison of employment data between the current and previous year were made by regional level (NUTS3) and by economic activities (NACE 2-digit level). Where significant drop or increase of employment was detected an explanation was required by the corresponding Regional Statistical Office. In most of the cases the differences were due to structural changes (closing down, merging with other units), but in some cases missing reports were identified and requested by the respondents. The second method was the use of administrative data. The National Social Security Institute has granted access to the NSI to the administrative register of insured persons. The register contains data for all insured persons (employees and self-employed) and identity code of insurer (legal or natural person), which is unique and used as well in the NSI data bases. By linking both databases we were able to identify units that had insured employees, but had not submitted their annual report to NSI. A list of those units was sent to the Regional Statistical Offices for follow up contacts and collecting of the missing reports. |
||||||||||||||||||||||||||||||||||||||||||||||||||||||||||||||||||||||||||||||||||||||||||||||||||||||||||||||||
| 6.3.3.1. Unit non-response - rate | ||||||||||||||||||||||||||||||||||||||||||||||||||||||||||||||||||||||||||||||||||||||||||||||||||||||||||||||||
[Not requested] |
||||||||||||||||||||||||||||||||||||||||||||||||||||||||||||||||||||||||||||||||||||||||||||||||||||||||||||||||
| 6.3.3.2. Item non-response - rate | ||||||||||||||||||||||||||||||||||||||||||||||||||||||||||||||||||||||||||||||||||||||||||||||||||||||||||||||||
[Not requested] |
||||||||||||||||||||||||||||||||||||||||||||||||||||||||||||||||||||||||||||||||||||||||||||||||||||||||||||||||
| 6.3.4. Processing error | ||||||||||||||||||||||||||||||||||||||||||||||||||||||||||||||||||||||||||||||||||||||||||||||||||||||||||||||||
Based on the consultations during the data collection period and on the data validation process, the variables which were more difficult for respondents were the number of part-time employees converted into full-time equivalents; collectively agreed, contractual and voluntary social security contributions; other expenditures paid by the employer and subsidies. Another difficulty is the requirement to be supplied information once for the whole enterprise and second time the data broken down by local units, where the head office is also regarded as local unit. These errors are captured and removed by comparison between data for the whole enterprise and the sum of the data from local units. Rates of corrected cases are calculated for each variable by comparing data extracted at the beginning of data validation with final values of variables after validation and editing at the Head Office of NSI.
Table 3. Rates of corrected variables in LCS2016
|
||||||||||||||||||||||||||||||||||||||||||||||||||||||||||||||||||||||||||||||||||||||||||||||||||||||||||||||||
| 6.3.4.1. Imputation - rate | ||||||||||||||||||||||||||||||||||||||||||||||||||||||||||||||||||||||||||||||||||||||||||||||||||||||||||||||||
No imputation has been done. |
||||||||||||||||||||||||||||||||||||||||||||||||||||||||||||||||||||||||||||||||||||||||||||||||||||||||||||||||
| 6.3.5. Model assumption error | ||||||||||||||||||||||||||||||||||||||||||||||||||||||||||||||||||||||||||||||||||||||||||||||||||||||||||||||||
For the Labour Cost Survey 2016 the information on hours paid, total and by mode of employment was not collected directly from the respondents, but it was calculated at micro level for each local unit by following way:
|
||||||||||||||||||||||||||||||||||||||||||||||||||||||||||||||||||||||||||||||||||||||||||||||||||||||||||||||||
| 6.4. Seasonal adjustment | ||||||||||||||||||||||||||||||||||||||||||||||||||||||||||||||||||||||||||||||||||||||||||||||||||||||||||||||||
[Not requested] |
||||||||||||||||||||||||||||||||||||||||||||||||||||||||||||||||||||||||||||||||||||||||||||||||||||||||||||||||
| 6.5. Data revision - policy | ||||||||||||||||||||||||||||||||||||||||||||||||||||||||||||||||||||||||||||||||||||||||||||||||||||||||||||||||
[Not requested] [Not requested] |
||||||||||||||||||||||||||||||||||||||||||||||||||||||||||||||||||||||||||||||||||||||||||||||||||||||||||||||||
| 6.6. Data revision - practice | ||||||||||||||||||||||||||||||||||||||||||||||||||||||||||||||||||||||||||||||||||||||||||||||||||||||||||||||||
[Not requested] |
||||||||||||||||||||||||||||||||||||||||||||||||||||||||||||||||||||||||||||||||||||||||||||||||||||||||||||||||
| 6.6.1. Data revision - average size | ||||||||||||||||||||||||||||||||||||||||||||||||||||||||||||||||||||||||||||||||||||||||||||||||||||||||||||||||
[Not requested] |
||||||||||||||||||||||||||||||||||||||||||||||||||||||||||||||||||||||||||||||||||||||||||||||||||||||||||||||||
|
|||
| 7.1. Timeliness | |||
The Bulgarian LCS for 2016 had the following timetable:
|
|||
| 7.1.1. Time lag - first result | |||
[Not requested] |
|||
| 7.1.2. Time lag - final result | |||
[Not requested] |
|||
| 7.2. Punctuality | |||
Definitive results from the LCS 2016 were published at national level in August 2018, thus the length of time between the release date and the reference period of the data is t+20 months. |
|||
| 7.2.1. Punctuality - delivery and publication | |||
[Not requested] |
|||
|
|||
-
|
|||
| 8.1. Comparability - geographical | |||
|
|||
| 8.1.1. Asymmetry for mirror flow statistics - coefficient | |||
[Not requested] |
|||
| 8.2. Comparability - over time | |||
As compared to the LCS 2012 there are no changes in the definitions and coverage. In comparison with LCS 2004 the biggest difference is that LCS 2008, LCS2012, LCS2016 were census type surveys, while the 2004 LCS was based on the sample from local units. However in the 2004 round the coverage of size classes and economic activities was the same as it was in other rounds. There are differences in the number of variables collected between the surveys as well. In LCS 2004 more detailed information for the break down of wages and salaries in kind and employers imputed social contributions was collected, while no information for these optional variables was collected in the followng surveys. |
|||
| 8.2.1. Length of comparable time series | |||
[Not requested] |
|||
| 8.3. Coherence - cross domain | |||
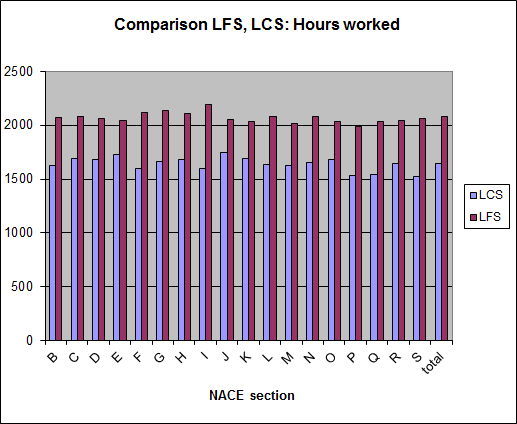
Coherence with Labour Force Survey For all NACE sections the hours actually worked per employee are higher in LFS than the LCS. The main reasons for the differences are the coverage of employees, type of statistical unit and mode of data collection.
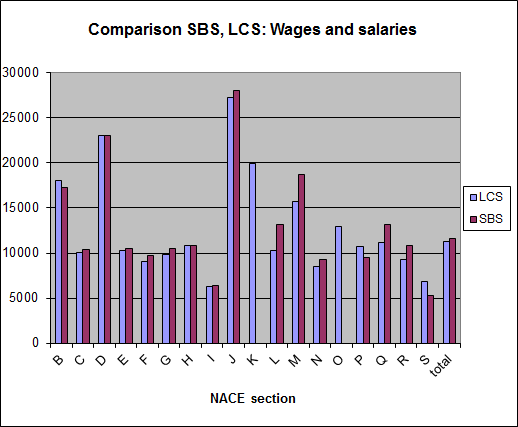
Coherence with Structural business statistics The source for SBS is the annual Report on revenues and expenditures. The differences between SBS and LCS are due to:
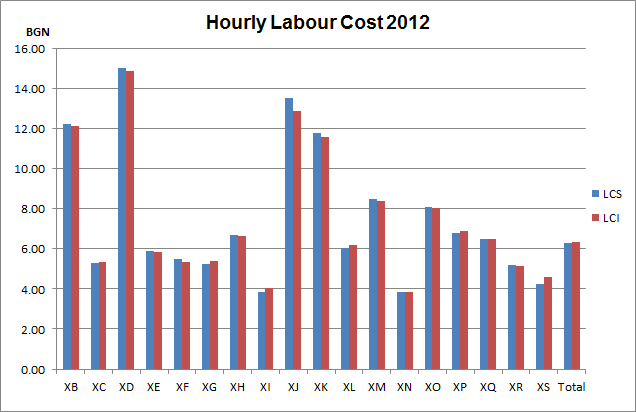
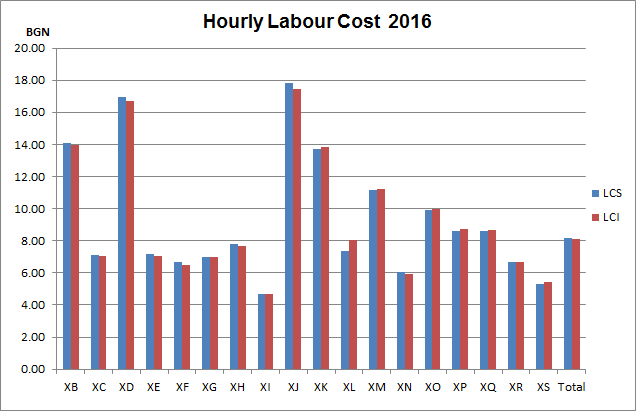
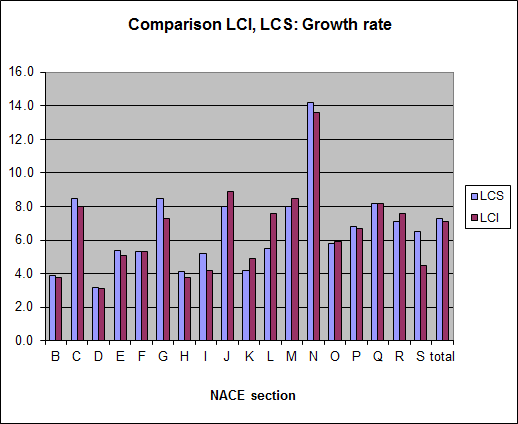
Coherence with Quarterly Labour Cost Index The source used for the LCI calculation is the Quarterly Survey on Number of Employees, Hours worked, Wages and Salaries and Other Labour Costs (QLCS). It is sample survey as the sample is stratified according to the size of the enterprise (number of employees) and economic activity (2-digit level of Nace.Rev.2.). Exhaustively are covered public sector enterprises and private owned enterprises with more than 99 employees. A random stratified sample is made out of enterprises in private sector with less than 100 employees. For 2016 there were around 212 000 private sector enterprises with 1 and more employees under labour contract in the population. Approximately 14 300 of them were selected in the QLCS sample. In general there are no coverage or methodological differences between QLCS and LCS. The only reason for the difference between the hourly labour costs from QLCS and four yearly LCS and the corresponding growth rates is due to the fact that QLCS is a sample survey therefore its results are subject of statistical error.
|
|||
| 8.4. Coherence - sub annual and annual statistics | |||
[Not requested] |
|||
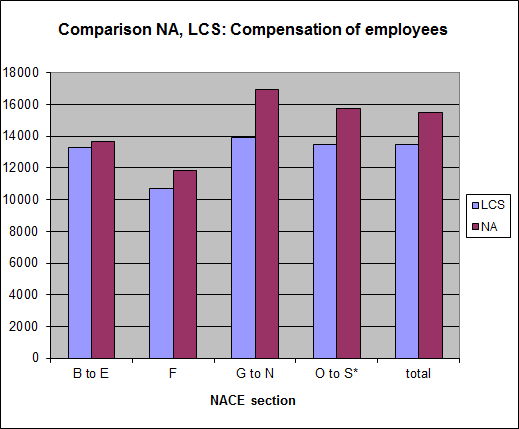
| 8.5. Coherence - National Accounts | |||
The differences in compensation of employees, per employee can be explained with the fact that NA covers employment costs that are not included in LCS such as:
|
|||
| 8.6. Coherence - internal | |||
[Not requested] |
|||
|
|||
- |
|||
| 9.1. Dissemination format - News release | |||
[Not requested] |
|||
| 9.2. Dissemination format - Publications | |||
Information on the number of employees and wages and salaries is published in the Statistical yearbook and Statistical Reference book. |
|||
| 9.3. Dissemination format - online database | |||
Main survey results as well metadata and methodological notes are published on the NSI official web-site (http://www.nsi.bg/en) in the labour market section. |
|||
| 9.3.1. Data tables - consultations | |||
[Not requested] |
|||
| 9.4. Dissemination format - microdata access | |||
[Not requested] |
|||
| 9.5. Dissemination format - other | |||
not applicable |
|||
| 9.6. Documentation on methodology | |||
not applicable |
|||
| 9.7. Quality management - documentation | |||
[Not requested] |
|||
| 9.7.1. Metadata completeness - rate | |||
[Not requested] |
|||
| 9.7.2. Metadata - consultations | |||
[Not requested] |
|||
|
|||
[Not requested] |
|||
|
|||
- |
|||
| 11.1. Confidentiality - policy | |||
[Not requested] |
|||
| 11.2. Confidentiality - data treatment | |||
[Not requested] |
|||
|
|||
- |
|||
|
|||
|
|||
| Coherence LCS and LCI comparison |
|||