|
 |
| For any question on data and metadata, please contact: Eurostat user support |
|
|||
| 1.1. Contact organisation | National Documentation Centre (EKT) |
||
| 1.2. Contact organisation unit | Registers, Indicators and Services for Research & Innovation |
||
| 1.5. Contact mail address | 48, Vas. Constantinou Avenue, GR-11635 |
||
|
|||
| 2.1. Metadata last certified | 01/07/2021 | ||
| 2.2. Metadata last posted | 01/07/2021 | ||
| 2.3. Metadata last update | 01/07/2021 | ||
|
||||||||||||||||||||||||||||||||||||||||||||||||
| 3.1. Data description | ||||||||||||||||||||||||||||||||||||||||||||||||
The Community Innovation Survey (CIS) is a survey about innovation activities in enterprises. The survey is designed to collect the information on different types of innovation, various aspects of the development of an innovation, objectives of innovation activities, sources of information, public funding or expenditure on innovation. It is aim is to measure the innovativeness of sectors and enable the analysis of the factors of innovation. The CIS provides statistics by type of innovators, economic activities and size class of enterprises. The survey is currently carried out every two years across the EU Member States, EFTA countries and EU candidate countries. In order to ensure comparability across countries, Eurostat together with the countries developed a Harmonised Data Collection (HDC) questionnaire accompanied by a set of definitions and methodological recommendations.
CIS 2018 concepts and its underlying methodology are based on the Oslo Manual (2018) 4th Edition. New review of the CIS2018 aims to meet several objectives : 1: Reduce subjectivity and biases in the main CIS indicators 2: Improve reporting about innovation activities and capabilities in the firm 3: Ensure international comparability (including compliance with the OM4) 4: Broaden the basis CIS information on enterprise management 5: Take better account the diversity of enterprises in the EU 6: Improve reporting about external drivers and enablers of innovation 7: Improve timeliness 8: Ensure the feasibility of data collection 9: Ensure continuity with the CIS 2016 10: Improve reporting about the output and impact of innovation
CIS2018 is conducted under Commission Regulation No 995/2012. This Regulation defines the mandatory target population of the survey referring to enterprises in the Core NACE economic sectors (see section 3.3.) with at least 10 employees. Further activities may be covered on a voluntary basis in national datasets. Most statistics are based on the 3-year reference period (t, t-1, t-2), but some use only one calendar year (t or t-2). Please consider CIS t to be the survey that refers to the same year of the quality report and CIS t-2 to be the previous survey e.g.: CIS 2018= CIS t then, CIS t-2=CIS 2016 |
||||||||||||||||||||||||||||||||||||||||||||||||
| 3.2. Classification system | ||||||||||||||||||||||||||||||||||||||||||||||||
Indicators related to the enterprises are classified by country, economic activity (NACE Rev. 2), size class of enterprises and type of innovation. The main typology of classification of enterprises in reference to innovation is the distinction between innovation-active enterprises (INN) and not innovation-active enterprises (NINN). The enterprise is considered as innovative (INN) if during the reference period it successfully introduced a product or business process innovation, had ongoing innovation activities, abandoned innovation activities or was engaged in in-house R&D or R&D contracted out. Non-innovative (NINN) enterprises had no innovation activity mentioned above whatsoever during the reference period. |
||||||||||||||||||||||||||||||||||||||||||||||||
| 3.3. Coverage - sector | ||||||||||||||||||||||||||||||||||||||||||||||||
CIS covers main economic sectors according to NACE Rev.2 broken down by size class of enterprises and type of innovation activity. |
||||||||||||||||||||||||||||||||||||||||||||||||
| 3.3.1. Main economic sectors covered - NACE Rev.2 | ||||||||||||||||||||||||||||||||||||||||||||||||
In accordance with Commission Regulation 995/2012 on innovation statistics, the following industries and services are included in the core target population. Results are made available with these following breakdowns : All NACE – Core NACE (NACE Rev. 2 sections & divisions B-C-D-E-46-H-J-K-71-72-73 ) CORE INDUSTRY (excluding construction) (NACE Rev. 2 SECTIONS B_C_D_E) 10-12: Manufacture of food products, beverages and tobacco 13-15: Manufacture of textiles, wearing apparel, leather and related products 16-18: Manufacture of wood, paper, printing and reproduction 20: Manufacture of chemicals and chemical products 21: Manufacture of basic pharmaceutical products and pharmaceutical preparations 19-22: Manufacture of petroleum, chemical, pharmaceutical, rubber and plastic products 23: Manufacture of other non-metallic mineral products 24: Manufacture of basic metals 25: Manufacture of fabricated metal products, except machinery and equipment 26: Manufacture of computer, electronic and optical products 25-30: Manufacture of fabricated metal products (except machinery and equipment), computer, electronic and optical products, electrical equipment, motor vehicles and other transport equipment 31-33: Manufacture of furniture; jewellery, musical instruments, toys; repair and installation of machinery and equipment D: ELECTRICITY, GAS, STEAM AND AIR CONDITIONING SUPPLY E: WATER SUPPLY; SEWERAGE, WASTE MANAGEMENT AND REMEDIATION ACTIVITIES 36: Water collection, treatment and supply 37-39: Sewerage, waste management, remediation activities CORE SERVICES (NACE Rev. 2 sections & divisions 46-H-J-K-71-72-73)(NACE code in the tables = G46-M73_INN) 46: Wholesale trade, except of motor vehicles and motorcycles H: TRANSPORTATION AND STORAGE 49-51: Land transport and transport via pipelines, water transport and air transport 52-53: Warehousing and support activities for transportation and postal and courier activities J: INFORMATION AND COMMUNICATION 58: Publishing activities 61: Telecommunications 62: Computer programming, consultancy and related activities 63: Information service activities K: FINANCIAL AND INSURANCE ACTIVITIES 64: Financial service activities, except insurance and pension funding 65: Insurance, reinsurance and pension funding, except compulsory social security 66: Activities auxiliary to financial services and insurance activities M: PROFESSIONAL, SCIENTIFIC AND TECHNICAL ACTIVITIES 71: Architectural and engineering activities; technical testing and analysis 72: Scientific research and development 73: Advertising and market research 71-73: Architectural and engineering activities; technical testing and analysis; Scientific research and development; Advertising and market research |
||||||||||||||||||||||||||||||||||||||||||||||||
| 3.3.1.1. Main economic sectors covered - NACE Rev.2 - national particularities | ||||||||||||||||||||||||||||||||||||||||||||||||
All core NACE 2018 sections and divisions have been covered with no deviations from the Commission Regulation 995/2012. |
||||||||||||||||||||||||||||||||||||||||||||||||
| 3.3.2. Sector coverage - size class | ||||||||||||||||||||||||||||||||||||||||||||||||
In accordance with Commission Regulation 995/2012 on innovation statistics, the following size classes of enterprises according to number of employees are included in the core target population of the CIS:
|
||||||||||||||||||||||||||||||||||||||||||||||||
| 3.3.2.1. Sector coverage - size class - national particularities | ||||||||||||||||||||||||||||||||||||||||||||||||
No deviations from the size classes defined in the Commission Regulation 995/2012. |
||||||||||||||||||||||||||||||||||||||||||||||||
| 3.4. Statistical concepts and definitions | ||||||||||||||||||||||||||||||||||||||||||||||||
The description of concepts, definitions and main statistical variables is available in CIS 2018 European metadata file (ESMS) Results of the community innovation survey 2018 (CIS2018) (inn_cis11) in Eurostat database. |
||||||||||||||||||||||||||||||||||||||||||||||||
| 3.5. Statistical unit | ||||||||||||||||||||||||||||||||||||||||||||||||
In accordance with EC Regulation 995/2012, the statistical unit for CIS survey is the enterprise, as defined in the Council Regulation 696/1993. |
||||||||||||||||||||||||||||||||||||||||||||||||
| 3.6. Statistical population | ||||||||||||||||||||||||||||||||||||||||||||||||
Core target population is all enterprises in CORE NACE activities (see 3.3.1) with 10 or more employees. |
||||||||||||||||||||||||||||||||||||||||||||||||
| 3.7. Reference area | ||||||||||||||||||||||||||||||||||||||||||||||||
The reference area for the national CIS survey is Greece, covering all 13 regions at NUTS-2 level. CIS data are collected for all NUTS-2 regions and selected indicators of the CIS survey are calculated and provided at regional NUTS-2 level, following the request for the Regional Innovation Scoreboard. |
||||||||||||||||||||||||||||||||||||||||||||||||
| 3.8. Coverage - Time | ||||||||||||||||||||||||||||||||||||||||||||||||
Several rounds of Community Innovation Survey have been conducted so far at two-year interval since end of 90’s. |
||||||||||||||||||||||||||||||||||||||||||||||||
| 3.8.1. Participation in the CIS waves | ||||||||||||||||||||||||||||||||||||||||||||||||
*two reference periods can be distinguished for CIS light: 2000-2002 and 2001-2003 |
||||||||||||||||||||||||||||||||||||||||||||||||
| 3.9. Base period | ||||||||||||||||||||||||||||||||||||||||||||||||
Not relevant. |
||||||||||||||||||||||||||||||||||||||||||||||||
|
|||
CIS indicators are available according to 3 units of measure: NR: Number for number of enterprises and number of persons employed. THS_EUR: Thousands of euros. All financial variables are provided in thousands of euros, i.e. Turnover or Innovation expenditure. PC: Percentage. The percentage is the ratio between the selected combinations of indicators. |
|||
|
|||
For CIS 2018, the time covered by the survey is the 3-year period from the beginning of 2016 to the end of 2018. Some questions and indicators refer to one year — 2018. The list of indicators covering the 3-year period and referring to one year according to the HDC is available in the Annex section of the European metadata (ESMS). |
|||
|
|||
| 6.1. Institutional Mandate - legal acts and other agreements | |||
CIS surveys are based on the Commission Regulation No 995/2012, implementing Decision No 1608/2003/EC of the European Parliament and of the Council on the production and development of Community statistics on science and technology. This Regulation establishes innovation statistics on a statutory basis and makes the delivery of certain variables compulsory e.g. innovation activities, cooperation, development, expenditures and turnover (see the Regulation). Each survey wave may additionally include further variables. In addition, the Regulation defines the obligatory cross-coverage of economic sectors and size class of enterprises. |
|||
| 6.1.1. National legislation | |||
The following legal acts are in force for the conduction of the CIS survey in Greece:
|
|||
| 6.2. Institutional Mandate - data sharing | |||
Not requested. |
|||
|
|||
CIS data are transmitted to Eurostat via EDAMIS using the secured transmission system. |
|||
| 7.1. Confidentiality - policy | |||
The National Documentation Centre (EKT), as a National Authority of the Hellenic Statistical System is fully committed and compliant with the provisions on statistical confidentiality, as defined by the Articles 7, 8 and 9 of the national law 3832/2010 and by the Articles 5, 8, 10 and 11(2) of the regulation of statistical obligations of the bodies of the Hellenic Statistical System. In particular, the dissemination of statistics is carried out in compliance with the principles of the Code of Good Practice for European Statistics and the principles of statistical confidentiality and data protection defined in the Statistical Privacy Policy disseminated by EKT online (available only in EL at https://metrics.ekt.gr/sites/metrics-ekt/files/pages-pdf/EKT_Policy_StatisticalConfidentiality_el.pdf). |
|||
| 7.2. Confidentiality - data treatment | |||
Data cells have been protected for confidentiality according to the following rules: |
|||
|
|||
| 8.1. Release calendar | |||
The release calendar for all statistical data is published online at the end of each calendar year on the dedicated website for RDI statistics. The calendar announces the months of the following year on which the statistical results are expected to be disseminated. |
|||
| 8.2. Release calendar access | |||
The release calendar is publicly accessible at https://metrics.ekt.gr/en/statistics-announcements. |
|||
| 8.3. Release policy - user access | |||
The National Documentation Centre (EKT) provides equal and simultaneous access of all users to its generated statistics as described in its Dissemination Policy - text available only in EL (https://metrics.ekt.gr/sites/metrics-ekt/files/pages-pdf/EKT_Policy_Dissemination_el.pdf), strictly following the rules and principles contained in its statistical confidentiality policy - text available only in EL (https://metrics.ekt.gr/sites/metrics-ekt/files/pages-pdf/EKT_Policy_StatisticalConfidentiality_el.pdf). The main source of information for users of statistics on research, development and innovation is the dedicated website http://metrics.ekt.gr/, which can be accessed by all users, without no restrictions. RDI statistics are published on this website in the form of tables as well as in relevant publications and additional documentation studies. In addition, the results of statistical surveys and other relevant work on national statistics are submitted to Eurostat for inclusion in its relevant database (http://ec.europa.eu/eurostat/data/database). |
|||
|
|||
CIS is conducted and disseminated at two-year interval in pair years. |
|||
|
|||||||||||||||
Accessibility and clarity refer to the simplicity and ease for users to access statistics using simple and user-friendly procedure, obtaining them in an expected form and within an acceptable time period, with the appropriate user information and assistance: a global context which finally enables them to make optimum use of the statistics. |
|||||||||||||||
| 10.1. Dissemination format - News release | |||||||||||||||
See below. |
|||||||||||||||
| 10.1.1. Availability of the releases | |||||||||||||||
|
|||||||||||||||
| 10.2. Dissemination format - Publications | |||||||||||||||
- Online database (containing all/most results) : Publicly available, free of charge at https://metrics.ekt.gr/innovation/datatables - Analytical publication (referring to all/most results) : Publicly available, free of charge at https://metrics.ekt.gr/innovation/publications - Analytical publication (referring to specific results, e.g. only for one sector or one specific aspect) : Short publications with analysis of key statistics by regions and NACE sectors (publicly available - free of charge at https://metrics.ekt.gr/innovation/articles) and specific online publications upon request, or in given time for special purposes (e.g. presentations in conferences). |
|||||||||||||||
| 10.3. Dissemination format - online database | |||||||||||||||
Publicly available, free of charge on https://metrics.ekt.gr/innovation/datatables |
|||||||||||||||
| 10.3.1. Data tables - consultations | |||||||||||||||
Not requested. |
|||||||||||||||
| 10.4. Dissemination format - microdata access | |||||||||||||||
Submitted to Eurostat to be accessed by researchers at the Safe Centre and/or via CD-ROM. |
|||||||||||||||
| 10.4.1. Dissemination of microdata | |||||||||||||||
|
|||||||||||||||
| 10.5. Dissemination format - other | |||||||||||||||
Not available. |
|||||||||||||||
| 10.5.1. Metadata - consultations | |||||||||||||||
Not requested. |
|||||||||||||||
| 10.6. Documentation on methodology | |||||||||||||||
Documentation on the CIS methodology and results is publicly available online at https://metrics.ekt.gr/innovation/quality-reports. In addition, each publication of the survey results is accompanied by a short methodological note, including information on the target population, the NACE sections and size classes covered, the sampling method and the mode of data collection. The dedicated section on CIS results further includes an online glossary of all concepts related to the CIS survey for users of these statistics (https://metrics.ekt.gr/lexicon). Reference material for the survey is also available online with links to the relevant regulations, the Oslo Manual, the NACE classification and the survey questionnaire. |
|||||||||||||||
| 10.6.1. Metadata completeness - rate | |||||||||||||||
Not requested. |
|||||||||||||||
| 10.7. Quality management - documentation | |||||||||||||||
CIS national metadata are publicly available online at https://metrics.ekt.gr/innovation/quality-reports. |
|||||||||||||||
|
|||
| 11.1. Quality assurance | |||
The quality of CIS at national level is assessed via the quality indicators and concepts, as described in the present quality report. These indicators are monitored at a regular basis, during data collection and data processing, to ensure high quality of CIS results. In addition to the quality report, the National Documentation Centre has been developing a handbook with specific guidelines and indicators, that serves in monitoring the quality of the survey and documenting the procedures followed each time. The handbook for the national CIS is still in progress and is organised following the GSBPM structure. |
|||
| 11.2. Quality management - assessment | |||
Overall, the quality of the CIS 2018 has improved, compared to CIS 2016. Improvements are noticed in response rate of the survey and the measurement errors. The survey was carried out as a combination of a complete enumeration of big enterprises and R&D performers and a sample of enterprises taken from the Statistical Business Register. Data were collected via an online survey that allowed the introduction of filters and validation rules on the questionnaire. This minimised measurement and processing errors and had a positive impact on the quality of the data collected by the enterprises. The collection was supported by an online help-desk and well-trained interviewers responsible for the follow up and the assistance to enterprises during completion of the questionnaire. The participation of interviewers was made under the framework of our cooperation with the Hellenic Statistical Authority for the needs of the CIS survey. Given the experience gained from the implementation of the consecutive three previous rounds CIS 2012, CIS 2014 and CIS 2016, both for data producers and mostly for respondents and interviewers involved in the data collection, the quality of the CIS 2018 has clearly improved. The familiarity of enterprises with the survey concepts and the mode of data collection (online questionnaire) in addition to the involvement to data collection of many interviewers that had also worked in previous CIS collections, facilitated data collection and improved the length of the fieldwork period and the response rate of the survey. |
|||
|
||||||||||||||||||||||||||||||
| 12.1. Relevance - User Needs | ||||||||||||||||||||||||||||||
The questionnaire is finalised taking into consideration the feedback received from key stakeholders and the Hellenic Statistical Authority. Comments received by enterprises, during completion of the previous CIS questionnaire as well as in the interviews for cognitive testing of the CIS 2018 questionnaire, are also taken into account for the improvement of the survey questionnaire and the accompanied material provided to respondents (instructions for the completion of the questionnaire, examples & clarifications of the survey concepts). |
||||||||||||||||||||||||||||||
| 12.1.1. Needs at national level | ||||||||||||||||||||||||||||||
|
||||||||||||||||||||||||||||||
| 12.2. Relevance - User Satisfaction | ||||||||||||||||||||||||||||||
There was no extensive user satisfaction survey carried out. Feedback received from regular meetings with key stakeholders and personal interviews with significant R&D performers provided information on their needs for innovation statistics to be published and expressed great interest in analysing indicators at regional and sectoral level. Users satisfaction with the survey questionnaire and the data collection method was also monitored via the online questionnaire. Results of this assessment show a high satisfaction with the structure of the questionnaire, its development in the online platform and the support provided by interviewers and EKT staff during completion. |
||||||||||||||||||||||||||||||
| 12.3. Completeness | ||||||||||||||||||||||||||||||
CIS 2018 results cover all mandatory sheets and variables, following the EC Regulation 995/2012. In addition, the great majority of voluntary variables and the respective non-mandatory tabulations are also provided in the requested NACE and Size breakdowns. |
||||||||||||||||||||||||||||||
| 12.3.1. Data completeness - rate | ||||||||||||||||||||||||||||||
Not requested. |
||||||||||||||||||||||||||||||
|
||||||||||||||||||||||||||||||||||||||||||||||||||||
| 13.1. Accuracy - overall | ||||||||||||||||||||||||||||||||||||||||||||||||||||
Accuracy in the statistical sense denotes the closeness of computations or estimates to the exact or true values. Statistics are not equal with the true values because of variability (the statistics change from implementation to implementation of the survey due to random effects) and bias (the average of the possible values of the statistics from implementation to implementation is not equal to the true value due to systematic effects). |
||||||||||||||||||||||||||||||||||||||||||||||||||||
| 13.2. Sampling error | ||||||||||||||||||||||||||||||||||||||||||||||||||||
That part of the difference between a population value and an estimate thereof, derived from a random sample, which is due to the fact that only a subset of the population is enumerated. |
||||||||||||||||||||||||||||||||||||||||||||||||||||
| 13.2.1. Sampling error - indicators | ||||||||||||||||||||||||||||||||||||||||||||||||||||
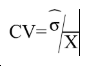
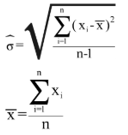
The main indicator used to measure sampling errors for CIS data is the coefficient of variation (CV).
Coefficient of Variation= (Square root of the estimate of the sampling variance) / (Estimated value) Formula: where
|
||||||||||||||||||||||||||||||||||||||||||||||||||||
| 13.2.1.1. Coefficient of variations for key variables | ||||||||||||||||||||||||||||||||||||||||||||||||||||
Coefficient of variation (%) for key variables by NACE categories and for enterprises with 10 and more employees
[1] = Coefficient of variation for the percentage of innovative enterprises (INN) in the total population of enterprises (ENT18) |
||||||||||||||||||||||||||||||||||||||||||||||||||||
| 13.2.1.2. Variance estimation method | ||||||||||||||||||||||||||||||||||||||||||||||||||||
The variance and the coefficients of variation were calculated using the appropriate formulas for ratio estimators, also provided in previous CIS instructions/template. The application provided in SPSS for complex samples was used for these calculations. |
||||||||||||||||||||||||||||||||||||||||||||||||||||
| 13.3. Non-sampling error | ||||||||||||||||||||||||||||||||||||||||||||||||||||
Non-sampling errors occur in all phases of a survey. They add to the sampling errors (if present) and contribute to decreasing overall accuracy. It is important to assess their relative weight in the total error and devote appropriate resources for their control and assessment. |
||||||||||||||||||||||||||||||||||||||||||||||||||||
| 13.3.1. Coverage error | ||||||||||||||||||||||||||||||||||||||||||||||||||||
Coverage errors (or frame errors) are due to divergences between the target population and the frame population. The frame population is the set of target population members that has a chance to be selected into the survey sample. It is a listing of all items in the population from which the sample is drawn that contains contact details as well as sufficient information to perform stratification and sampling. |
||||||||||||||||||||||||||||||||||||||||||||||||||||
| 13.3.1.1. Over-coverage - rate | ||||||||||||||||||||||||||||||||||||||||||||||||||||
Not requested. |
||||||||||||||||||||||||||||||||||||||||||||||||||||
| 13.3.1.2. Common units - proportion | ||||||||||||||||||||||||||||||||||||||||||||||||||||
Not requested. |
||||||||||||||||||||||||||||||||||||||||||||||||||||
| 13.3.1.3. Under covered groups of the target population | ||||||||||||||||||||||||||||||||||||||||||||||||||||
No undercoverage reported in any of the groups of the target population. |
||||||||||||||||||||||||||||||||||||||||||||||||||||
| 13.3.1.4. Coverage errors in coefficient variation | ||||||||||||||||||||||||||||||||||||||||||||||||||||
Not relevant - no coverage issues reported. |
||||||||||||||||||||||||||||||||||||||||||||||||||||
| 13.3.2. Measurement error | ||||||||||||||||||||||||||||||||||||||||||||||||||||
Measurement errors occur during data collection and generate bias by recording values different than the true ones. The survey questionnaire used for data collection may have led to the recording of wrong values, or there may be respondent or interviewer bias. |
||||||||||||||||||||||||||||||||||||||||||||||||||||
| 13.3.2.1. Measures for reducing measurement errors | ||||||||||||||||||||||||||||||||||||||||||||||||||||
The survey questionnaire was the model questionnaire proposed by Eurostat and the Member States for CIS 2018, translated in Greek. Given that the data collection was made electronically the questionnaire was built online using Lime Survey. This software allowed the introduction of filters to questions/sections of the questionnaire and most importantly supported the use of control rules and checks for the values reported therein. The latter improved the quality of data collected as it allowed validation in real time while respondents were answering the questions. The system also offered the option of saving and previewing their answers in any part of completion and before final submission. All operations were thoroughly tested before running the survey. In addition to the questionnaire a glossary of terms and examples related to the survey concepts and an online helpdesk were offered to respondents for further assistance. All respondents selected in the sample or covered by census were contacted by email for participating in the survey, in which they received their identical credentials for connecting to the questionnaire and a copy of the questionnaire in pdf for quick preview. The collection was supported by experienced interviewers, provided by the Hellenic Statistical Authority (ELSTAT), the national authority responsible for maintaining the register of interviewers for official statistical surveys. Interviewers were responsible for the telephone follow-up and any assistance needed for the enterprises. A special training was held for the interviewers and a handbook was offered to them explaining the survey and the mode of data collection. The training was shown in live streaming so that interviewers in all regions could watch it and ask questions. The whole operation was constantly monitored by the EKT staff and the regional statistical offices of ELSTAT for checking the progress of fieldwork and the quality of the data collected. |
||||||||||||||||||||||||||||||||||||||||||||||||||||
| 13.3.3. Non response error | ||||||||||||||||||||||||||||||||||||||||||||||||||||
Non response occurs when a survey fails to collect data on all survey variables from all the population units designated for data collection in a sample or complete enumeration. There are two types of non-response: 1) Unit non-response, which occurs when no data (or so little as to be unusable) are collected about a population unit designated for data collection. a) Un-weighted unit non-response rate (%) = 100*(Number of units with no response or not usable response) / (Total number of in-scope (eligible) units in the sample) b) Weighted unit non-response rate (%) = 100*(Number of weighted units with no response or not usable response) / (Total number of in-scope (eligible) units in the sample) 2) Item non-response, which occurs when only data on some, but not all survey data items are collected about a population unit designated for data collection. a) Un-weighted item non-response rate (%) = 100*(Number of units with no response at all for the item) / (Total number of eligible, for the item, units in the sample i.e. filters have to be taken into account) |
||||||||||||||||||||||||||||||||||||||||||||||||||||
| 13.3.3.1. Unit non-response - rate | ||||||||||||||||||||||||||||||||||||||||||||||||||||
See below. |
||||||||||||||||||||||||||||||||||||||||||||||||||||
| 13.3.3.1.1. Un-weighted and weighted unit non-response rate by NACE categories and for enterprises with 10 or more employees | ||||||||||||||||||||||||||||||||||||||||||||||||||||
Un-weighted and weighted unit non-response rate by NACE categories and for enterprises with 10 or more employees
The number of eligible units is the number of sample units, which indeed belong to the target population. |
||||||||||||||||||||||||||||||||||||||||||||||||||||
| 13.3.3.1.2. Maximum number of recalls/reminders before coding | ||||||||||||||||||||||||||||||||||||||||||||||||||||
Three e-mail reminders were sent to the enterprises followed by intensive telephone contacts, personal e-mails and close follow-up by interviewers before coding them as non-responding. |
||||||||||||||||||||||||||||||||||||||||||||||||||||
| 13.3.3.2. Item non-response - rate | ||||||||||||||||||||||||||||||||||||||||||||||||||||
See below. |
||||||||||||||||||||||||||||||||||||||||||||||||||||
| 13.3.3.2.1. Item non-response rate for Turnover (in Core NACE: B-C-D-E-46-H-J-K-71-72-73 enterprises with 10 or more employees) | ||||||||||||||||||||||||||||||||||||||||||||||||||||
Item non-response rate for Turnover (in Core NACE: B-C-D-E-46-H-J-K-71-72-73 enterprises with 10 or more employees).
|
||||||||||||||||||||||||||||||||||||||||||||||||||||
| 13.3.3.2.2. Item non response rate for new questions | ||||||||||||||||||||||||||||||||||||||||||||||||||||
Item non-response rate for new questions in CIS t (in Core NACE: B-C-D-E-46-H-J-K-71-72-73 enterprises with 10 or more employees)
|
||||||||||||||||||||||||||||||||||||||||||||||||||||
| 13.3.4. Processing error | ||||||||||||||||||||||||||||||||||||||||||||||||||||
All responses were collected via the online questionnaire, either filled in by respondents or by interviewers. In few exceptions, where enterprises submitted their questionnaire via fax/mail, data were filled in the system by experienced staff. In both cases there were no errors encountered. |
||||||||||||||||||||||||||||||||||||||||||||||||||||
| 13.3.5. Model assumption error | ||||||||||||||||||||||||||||||||||||||||||||||||||||
Not requested. |
||||||||||||||||||||||||||||||||||||||||||||||||||||
|
|||
Timeliness and punctuality refer to time and dates, but in a different manner. |
|||
| 14.1. Timeliness | |||
The timeliness of statistics reflects the length of time between data availability and the event or phenomenon they describe. |
|||
| 14.1.1. Time lag - first result | |||
Timeliness of national data – date of first release of national level : 30.03.2020 |
|||
| 14.1.2. Time lag - final result | |||
Not requested. |
|||
| 14.2. Punctuality | |||
Punctuality refers to the time lag between the release date of data and the target date on which they were scheduled for release as announced officially. |
|||
| 14.2.1. Punctuality - delivery and publication | |||
Date of transmission of complete and validated data to Eurostat (Number of days between that data and 30 June 2020) : 30.06.2020 (18 months after the end of the reference period) |
|||
|
||||||||||||||||||||
Comparability aims at measuring the impact of differences in applied statistical concepts and definitions on the comparison of statistics between geographical areas, non-geographical domains, or over time. The coherence of statistical outputs refers to the degree to which the statistical processes by which they were generated used the same concepts (classifications, definitions, and target populations) and harmonised methods. Coherent statistical outputs have the potential to be validly combined and used jointly. |
||||||||||||||||||||
| 15.1. Comparability - geographical | ||||||||||||||||||||
The harmonised model questionnaire was fully adopted and translated in the national language, following all international standards and the concepts and definitions in line with the Oslo Manual and Eurostat's guidelines. The same questionnaire was used at the whole terrirory resulting in full comparability between all Greek regions. |
||||||||||||||||||||
| 15.1.1. Asymmetry for mirror flow statistics - coefficient | ||||||||||||||||||||
Not requested. |
||||||||||||||||||||
| 15.1.2. National questionnaire – compliance with Eurostat model questionnaire | ||||||||||||||||||||
Methodological deviations from the CIS Harmonised Data Collection (HDC)
|
||||||||||||||||||||
| 15.1.3. National questionnaire – additional questions | ||||||||||||||||||||
Methodological deviations from the CIS Harmonised Data Collection (HDC)
|
||||||||||||||||||||
| 15.2. Comparability - over time | ||||||||||||||||||||
Due to important methodological changes in CIS 2018 driven by Oslo Manual 2018, the data 2018 cannot be directly compared with previous CIS waves. |
||||||||||||||||||||
| 15.2.1. Length of comparable time series | ||||||||||||||||||||
Not requested. |
||||||||||||||||||||
| 15.3. Coherence - cross domain | ||||||||||||||||||||
See the comparison between SBS and CIS data in the section 15.3.3 below. |
||||||||||||||||||||
| 15.3.1. Coherence - sub annual and annual statistics | ||||||||||||||||||||
Not requested. |
||||||||||||||||||||
| 15.3.2. Coherence - National Accounts | ||||||||||||||||||||
Not requested. |
||||||||||||||||||||
| 15.3.3. Coherence – Structural Business Statistics (SBS) | ||||||||||||||||||||
This part compares key variables for aggregated CIS data with SBS data
* Numbers are to be provided for the last year of the reference period (t) |
||||||||||||||||||||
| 15.4. Coherence - internal | ||||||||||||||||||||
Not requested. |
||||||||||||||||||||
|
|||
Confidential information on the production cost of the CIS. |
|||
|
|||
| 17.1. Data revision - policy | |||
Not requested. |
|||
| 17.2. Data revision - practice | |||
Not requested. |
|||
| 17.2.1. Data revision - average size | |||
Not requested. |
|||
|
||||||||||||||||||||||||||||||||||||||
| 18.1. Source data | ||||||||||||||||||||||||||||||||||||||
See below: |
||||||||||||||||||||||||||||||||||||||
| 18.1.1. Sampling frame (or census frame) | ||||||||||||||||||||||||||||||||||||||
The Statistical Business Register of reference year 2017, maintained by the Hellenic Statistical Authority, was used as sampling frame. |
||||||||||||||||||||||||||||||||||||||
| 18.1.2. Sampling design | ||||||||||||||||||||||||||||||||||||||
The sample of enterprises is determined following the specifications and precision requirements proposed by Eurostat in the survey methodological guidelines. A one-stage stratified random sampling was applied for the selection of the CIS 2018 sample. The strata in the sampling frame were defined based on the following three variables: |
||||||||||||||||||||||||||||||||||||||
| 18.1.3. Target population and sample size | ||||||||||||||||||||||||||||||||||||||
|
||||||||||||||||||||||||||||||||||||||
| 18.1.4. Data source for pre-filled variables | ||||||||||||||||||||||||||||||||||||||
Variables and indicators filled or prefilled from other sources.
All variables are collected via the survey questionna |
||||||||||||||||||||||||||||||||||||||
| 18.1.5. Data source and variables used for derivation and weighting | ||||||||||||||||||||||||||||||||||||||
|
||||||||||||||||||||||||||||||||||||||
| 18.2. Frequency of data collection | ||||||||||||||||||||||||||||||||||||||
According to the Commission Regulation (UE) 995/2012, the innovation statistics shall be provided to Eurostat every two years in each even year. The data collection takes place every second year in year t-2 preceding the data provision. |
||||||||||||||||||||||||||||||||||||||
| 18.3. Data collection | ||||||||||||||||||||||||||||||||||||||
CIS data are collected with electronic (online) questionnaires addressed to the enterprises participating in the survey. The online questionnaire is available at the dedicated website https://metrics-login.ekt.gr/, in which all enterprises must first login using their unique credentials. The LimeSurvey platform is used for the implementation of the electronic survey, which has been further developed by the National Documentation Centre with the integration of multiple functions. CIS questionnaires for all reporting periods are uploaded at https://metrics.ekt.gr/innovation/questionnaires. |
||||||||||||||||||||||||||||||||||||||
| 18.3.1. Survey participation | ||||||||||||||||||||||||||||||||||||||
Mandatory survey |
||||||||||||||||||||||||||||||||||||||
| 18.3.2. Survey type | ||||||||||||||||||||||||||||||||||||||
Combination of census and sample survey |
||||||||||||||||||||||||||||||||||||||
| 18.3.3. Combination of sample survey and census data | ||||||||||||||||||||||||||||||||||||||
- Census for enterprises over 500 persons employed and R&D 2018 performers |
||||||||||||||||||||||||||||||||||||||
| 18.3.4. Census criteria | ||||||||||||||||||||||||||||||||||||||
Census is conducted for all enterprises over 500 persons employed and R&D 2018 performers (enterprises that are systematically active in Research and Development based on the national survey on BES R&D). |
||||||||||||||||||||||||||||||||||||||
| 18.3.5. Data collection method | ||||||||||||||||||||||||||||||||||||||
Data collection method
|
||||||||||||||||||||||||||||||||||||||
| 18.4. Data validation | ||||||||||||||||||||||||||||||||||||||
Not requested. |
||||||||||||||||||||||||||||||||||||||
| 18.5. Data compilation | ||||||||||||||||||||||||||||||||||||||
Operations performed on data to derive new information according to a given set of rules. |
||||||||||||||||||||||||||||||||||||||
| 18.5.1. Imputation - rate | ||||||||||||||||||||||||||||||||||||||
Imputation is the method of creating plausible (but artificial) substitute values for all those missing. Definition of imputation rate: Imputation rate (for the variable x) (%) = 100*(Number of replaced values) / (Total number of values for a given variable) Definition of weighted imputation rate: Weighted imputation rate= 100*(Number of total weighted replaced values) / (Total number of weighted values for a given variable) |
||||||||||||||||||||||||||||||||||||||
| 18.5.1.1. Imputation rate for metric variables | ||||||||||||||||||||||||||||||||||||||
Imputation rate for metric variables by NACE categories and for enterprises with 10 or more employees:
(1) = Total turnover in the last year of the reference period (t) (TUR) (2) = Share of the turnover in the last year of the reference period (t) due to new or improved product new to the market in the total turnover for product innovative enterprises TUR_PRD_NEW_MKT/TUR(INNO_PRD) (3) = R&D expenditure performed in-house (EXP_INNO_RND_IH) |
||||||||||||||||||||||||||||||||||||||
| 18.5.2. Weights calculation | ||||||||||||||||||||||||||||||||||||||
Weights calculation method for sample surveys
|
||||||||||||||||||||||||||||||||||||||
| 18.6. Adjustment | ||||||||||||||||||||||||||||||||||||||
No calibration method used. |
||||||||||||||||||||||||||||||||||||||
| 18.6.1. Seasonal adjustment | ||||||||||||||||||||||||||||||||||||||
Not requested. |
||||||||||||||||||||||||||||||||||||||
|
|||
|
|||
|
|||
| GREECE_national CIS 2016-2018 questionnaire_EL GREECE_national CIS 2016-2018 questionnaire_EN |
|||