|
 |
| For any question on data and metadata, please contact: Eurostat user support |
|
|||
| 1.1. Contact organisation | Belgian Science Policy Office (BELSPO) |
||
| 1.2. Contact organisation unit | MERI |
||
| 1.5. Contact mail address | Belspo WTCII Simon Bolivarlaan 30/7 1000 Brussels Belgium |
||
|
|||
| 2.1. Metadata last certified | 01/07/2021 | ||
| 2.2. Metadata last posted | 01/07/2021 | ||
| 2.3. Metadata last update | 01/07/2021 | ||
|
||||||||||||||||||||||||||||||||||||||||||||||||
| 3.1. Data description | ||||||||||||||||||||||||||||||||||||||||||||||||
The Community Innovation Survey (CIS) is a survey about innovation activities in enterprises. The survey is designed to collect the information on different types of innovation, various aspects of the development of an innovation, objectives of innovation activities, sources of information, public funding or expenditure on innovation. It is aim is to measure the innovativeness of sectors and enable the analysis of the factors of innovation. The CIS provides statistics by type of innovators, economic activities and size class of enterprises. The survey is currently carried out every two years across the EU Member States, EFTA countries and EU candidate countries.
In order to ensure comparability across countries, Eurostat together with the countries developed a Harmonised Data Collection (HDC) questionnaire accompanied by a set of definitions and methodological recommendations.
CIS 2018 concepts and its underlying methodology are based on the Oslo Manual (2018) 4th Edition.
New review of the CIS2018 aims to meet several objectives : 1: Reduce subjectivity and biases in the main CIS indicators 2: Improve reporting about innovation activities and capabilities in the firm 3: Ensure international comparability (including compliance with the OM4) 4: Broaden the basis CIS information on enterprise management 5: Take better account the diversity of enterprises in the EU 6: Improve reporting about external drivers and enablers of innovation 7: Improve timeliness 8: Ensure the feasibility of data collection 9: Ensure continuity with the CIS 2016 10: Improve reporting about the output and impact of innovation
CIS2018 is conducted under Commission Regulation No 995/2012. This Regulation defines the mandatory target population of the survey referring to enterprises in the Core NACE economic sectors (see section 3.3.) with at least 10 employees. Further activities may be covered on a voluntary basis in national datasets. Most statistics are based on the 3-year reference period (t, t-1, t-2), but some use only one calendar year (t or t-2).
Please consider CIS t to be the survey that refers to the same year of the quality report and CIS t-2 to be the previous survey e.g.: CIS 2018= CIS t then, CIS t-2=CIS 2016 |
||||||||||||||||||||||||||||||||||||||||||||||||
| 3.2. Classification system | ||||||||||||||||||||||||||||||||||||||||||||||||
Indicators related to the enterprises are classified by country, economic activity (NACE Rev. 2), size class of enterprises and type of innovation.
The main typology of classification of enterprises in reference to innovation is the distinction between innovation-active enterprises (INN) and not innovation-active enterprises (NINN). The enterprise is considered as innovative (INN) if during the reference period it successfully introduced a product or business process innovation, had ongoing innovation activities, abandoned innovation activities or was engaged in in-house R&D or R&D contracted out. Non-innovative (NINN) enterprises had no innovation activity mentioned above whatsoever during the reference period. |
||||||||||||||||||||||||||||||||||||||||||||||||
| 3.3. Coverage - sector | ||||||||||||||||||||||||||||||||||||||||||||||||
CIS covers main economic sectors according to NACE Rev.2 broken down by size class of enterprises and type of innovation activity. |
||||||||||||||||||||||||||||||||||||||||||||||||
| 3.3.1. Main economic sectors covered - NACE Rev.2 | ||||||||||||||||||||||||||||||||||||||||||||||||
In accordance with Commission Regulation 995/2012 on innovation statistics, the following industries and services are included in the core target population. Results are made available with these following breakdowns : All NACE – Core NACE (NACE Rev. 2 sections & divisions B-C-D-E-46-H-J-K-71-72-73 )
CORE INDUSTRY (excluding construction) (NACE Rev. 2 SECTIONS B_C_D_E) 10-12: Manufacture of food products, beverages and tobacco 13-15: Manufacture of textiles, wearing apparel, leather and related products 16-18: Manufacture of wood, paper, printing and reproduction 20: Manufacture of chemicals and chemical products 21: Manufacture of basic pharmaceutical products and pharmaceutical preparations 19-22: Manufacture of petroleum, chemical, pharmaceutical, rubber and plastic products 23: Manufacture of other non-metallic mineral products 24: Manufacture of basic metals 25: Manufacture of fabricated metal products, except machinery and equipment 26: Manufacture of computer, electronic and optical products 25-30: Manufacture of fabricated metal products (except machinery and equipment), computer, electronic and optical products, electrical equipment, motor vehicles and other transport equipment 31-33: Manufacture of furniture; jewellery, musical instruments, toys; repair and installation of machinery and equipment
D: ELECTRICITY, GAS, STEAM AND AIR CONDITIONING SUPPLY
E: WATER SUPPLY; SEWERAGE, WASTE MANAGEMENT AND REMEDIATION ACTIVITIES 36: Water collection, treatment and supply 37-39: Sewerage, waste management, remediation activities
CORE SERVICES (NACE Rev. 2 sections & divisions 46-H-J-K-71-72-73)(NACE code in the tables = G46-M73_INN) 46: Wholesale trade, except of motor vehicles and motorcycles
H: TRANSPORTATION AND STORAGE 49-51: Land transport and transport via pipelines, water transport and air transport 52-53: Warehousing and support activities for transportation and postal and courier activities
J: INFORMATION AND COMMUNICATION 58: Publishing activities 61: Telecommunications 62: Computer programming, consultancy and related activities 63: Information service activities
K: FINANCIAL AND INSURANCE ACTIVITIES 64: Financial service activities, except insurance and pension funding 65: Insurance, reinsurance and pension funding, except compulsory social security 66: Activities auxiliary to financial services and insurance activities
M: PROFESSIONAL, SCIENTIFIC AND TECHNICAL ACTIVITIES 71: Architectural and engineering activities; technical testing and analysis 72: Scientific research and development 73: Advertising and market research 71-73: Architectural and engineering activities; technical testing and analysis; Scientific research and development; Advertising and market research
|
||||||||||||||||||||||||||||||||||||||||||||||||
| 3.3.1.1. Main economic sectors covered - NACE Rev.2 - national particularities | ||||||||||||||||||||||||||||||||||||||||||||||||
There were no deviations |
||||||||||||||||||||||||||||||||||||||||||||||||
| 3.3.2. Sector coverage - size class | ||||||||||||||||||||||||||||||||||||||||||||||||
In accordance with Commission Regulation 995/2012 on innovation statistics, the following size classes of enterprises according to number of employees are included in the core target population of the CIS:
|
||||||||||||||||||||||||||||||||||||||||||||||||
| 3.3.2.1. Sector coverage - size class - national particularities | ||||||||||||||||||||||||||||||||||||||||||||||||
We used the three size classes provided above, based on the number of employees. |
||||||||||||||||||||||||||||||||||||||||||||||||
| 3.4. Statistical concepts and definitions | ||||||||||||||||||||||||||||||||||||||||||||||||
The description of concepts, definitions and main statistical variables is available in CIS 2018 European metadata file (ESMS) Results of the community innovation survey 2018 (CIS2018) (inn_cis11) in Eurostat database. |
||||||||||||||||||||||||||||||||||||||||||||||||
| 3.5. Statistical unit | ||||||||||||||||||||||||||||||||||||||||||||||||
The legal unit was used as the statistical unit. |
||||||||||||||||||||||||||||||||||||||||||||||||
| 3.6. Statistical population | ||||||||||||||||||||||||||||||||||||||||||||||||
Core target population are all enterprises in CORE NACE activities (see 3.3.1) with 10 or more employees. |
||||||||||||||||||||||||||||||||||||||||||||||||
| 3.7. Reference area | ||||||||||||||||||||||||||||||||||||||||||||||||
Belgium is composed of 3 regions (at NUTS 1 level): Brussels, Flanders, and Wallonia. Each region is endowed with its own statistical office. Thus, three separate samples were drawn. |
||||||||||||||||||||||||||||||||||||||||||||||||
| 3.8. Coverage - Time | ||||||||||||||||||||||||||||||||||||||||||||||||
Several rounds of Community Innovation Survey have been conducted so far at two-year interval since end of 90’s. |
||||||||||||||||||||||||||||||||||||||||||||||||
| 3.8.1. Participation in the CIS waves | ||||||||||||||||||||||||||||||||||||||||||||||||
*two reference periods can be distinguished for CIS light: 2000-2002 and 2001-2003 |
||||||||||||||||||||||||||||||||||||||||||||||||
| 3.9. Base period | ||||||||||||||||||||||||||||||||||||||||||||||||
Not relevant. |
||||||||||||||||||||||||||||||||||||||||||||||||
|
|||
CIS indicators are available according to 3 units of measure:
NR: Number for number of enterprises and number of persons employed. THS_EUR: Thousands of euros. All financial variables are provided in thousands of euros, i.e. Turnover or Innovation expenditure. PC: Percentage. The percentage is the ratio between the selected combinations of indicators. |
|||
|
|||
For CIS 2018, the time covered by the survey is the 3-year period from the beginning of 2016 to the end of 2018. Some questions and indicators refer to one year — 2018. The list of indicators covering the 3-year period and referring to one year according to the HDC is available in the Annex section of the European metadata (ESMS). |
|||
|
|||
| 6.1. Institutional Mandate - legal acts and other agreements | |||
CIS surveys are based on the Commission Regulation No 995/2012, implementing Decision No 1608/2003/EC of the European Parliament and of the Council on the production and development of Community statistics on science and technology. This Regulation establishes innovation statistics on a statutory basis and makes the delivery of certain variables compulsory e.g. innovation activities, cooperation, development, expenditures and turnover (see the Regulation). Each survey wave may additionally include further variables. In addition, the Regulation defines the obligatory cross-coverage of economic sectors and size class of enterprises. |
|||
| 6.1.1. National legislation | |||
CIS surveys are based on the Commission Regulation No 995/2012, implementing Decision No 1608/2003/EC of the European Parliament and of the Council on the production and development of Community statistics on science and technology. This Regulation establishes innovation statistics on a statutory basis and makes the delivery of certain variables compulsory e.g. innovation activities, cooperation, development, expenditures and turnover (see the Regulation). Each survey wave may additionally include further variables. In addition, the Regulation defines the obligatory cross-coverage of economic sectors and size class of enterprises.
Legal agreement on how the three regions and the national government organize the production of official STI statistics: http://www.ejustice.just.fgov.be/mopdf/2020/01/21_1.pdf#Page195 |
|||
| 6.2. Institutional Mandate - data sharing | |||
Not requested. |
|||
|
|||
CIS data are transmitted to Eurostat via EDAMIS using the secured transmission system. |
|||
| 7.1. Confidentiality - policy | |||
The Belgian Interfederal Institute of Statistics (IIS) coordinates the statistics production at the regional and national level in Belgium. It abides by the European Statistics Code of Practice, including its principle 5, on statistical confidentiality and data protection (https://www.iis-statistics.be/doc/CoC_fr.pdf). The legal agreement of 2007 on how the three regions and the national government organize the production of official STI statistics also indicates that the Belgian STI statistics production will follow EUROSTAT and OECD methodology. As an “other national authority” we moreover have to abide by EC regulation 223/2009, governing the ESS statistics production. |
|||
| 7.2. Confidentiality - data treatment | |||
Cells were flagged as confidential (“C”) if the population for that cell (or a set of interdependent cells) contained 10 or fewer enterprises. |
|||
|
|||
| 8.1. Release calendar | |||
For Statistics Flanders: https://www.statistiekvlaanderen.be/nl/protocollen -- see the link “Publicatieagenda” The publication date and the date when the next update will be made available is also published next to each individual statistic. |
|||
| 8.2. Release calendar access | |||
For Statistics Flanders: https://www.statistiekvlaanderen.be/nl/protocollen -- see the link “Publicatieagenda” The publication date and the date when the next update will be made available is also published next to each individual statistic. |
|||
| 8.3. Release policy - user access | |||
In Flanders, two core R&D statistics based on CIS are published online on June 30. More general innovation statistics derived from CIS are published online on September 30. Academic researchers may obtain access to regional microdata for academic purposes by signing confidentiality agreements. They may obtain access to the national microdata by submitting a project proposal to a committee that represents both the national and the regional levels, and by signing a confidentiality agreement. |
|||
|
|||
CIS is conducted and disseminated at two-year interval in pair years. |
|||
|
|||||||||||||||
Accessibility and clarity refer to the simplicity and ease for users to access statistics using simple and user-friendly procedure, obtaining them in an expected form and within an acceptable time period, with the appropriate user information and assistance: a global context which finally enables them to make optimum use of the statistics. |
|||||||||||||||
| 10.1. Dissemination format - News release | |||||||||||||||
See below. |
|||||||||||||||
| 10.1.1. Availability of the releases | |||||||||||||||
|
|||||||||||||||
| 10.2. Dissemination format - Publications | |||||||||||||||
- Online database (containing all/most results) : www.belspo.be/belspo/stat/b23_en.stm - Analytical publication (referring to all/most results) : national results: www.innovationdata.be publishes all indicators, but this website will be replaced in 2021 (name of the new website yet to be determined); Regional results: https://www.ecoom.be/nodes/cisrapport/en; https://www.vlaamsindicatorenboek.be/4.4/innovatie-inspanningen-van-ondernemingen; https://recherche-technologie.wallonie.be/fr/menu/themes/recherche-et-technologies-en-wallonie/index.html; https://www.belspo.be/belspo/stat/b23_en.stm - Analytical publication (referring to specific results, e.g. only for one sector or one specific aspect) : Core R&D numbers in Flanders, to monitor the progress towards the 3% target for R&D: https://www.ecoom.be/en/services/3note; https://www.statistiekvlaanderen.be/en/rd-intensity-0; https://www.statistiekvlaanderen.be/en/rd-personnel-0; https://www.vlaamsindicatorenboek.be/2.1/totale-oo-uitgaven-gerd |
|||||||||||||||
| 10.3. Dissemination format - online database | |||||||||||||||
Tabulated data are available online with some degree of aggregation, both at national and regional level. www.belspo.be/belspo/stat/b23_en.stm |
|||||||||||||||
| 10.3.1. Data tables - consultations | |||||||||||||||
Not requested. |
|||||||||||||||
| 10.4. Dissemination format - microdata access | |||||||||||||||
Microdata is available at the Eurostat Safe center. Upon request, microdata can be made available if all three regions have agreed and the user has signed a standard confidentiality agreement statement (adherence to the laws governing statistical practices). |
|||||||||||||||
| 10.4.1. Dissemination of microdata | |||||||||||||||
|
|||||||||||||||
| 10.5. Dissemination format - other | |||||||||||||||
None |
|||||||||||||||
| 10.5.1. Metadata - consultations | |||||||||||||||
Not requested. |
|||||||||||||||
| 10.6. Documentation on methodology | |||||||||||||||
www.Innovationdata.be provides some meta-data. Quality Reports can be delivered upon request, but are not generally asked for. |
|||||||||||||||
| 10.6.1. Metadata completeness - rate | |||||||||||||||
Not requested. |
|||||||||||||||
| 10.7. Quality management - documentation | |||||||||||||||
In our publications, we refer to the international guidelines (EUROSTAT and OECD (e.g., Oslo Manual)) which we follow. If quality reports were requested, they would be made available to users, but this hasn't happened yet. |
|||||||||||||||
|
|||
Belgium follows Eurostat's recommendations. |
|||
| 11.1. Quality assurance | |||
Belgium follows Eurostat's recommendations. |
|||
| 11.2. Quality management - assessment | |||
We consider the fact the CIS isn't mandatory in Belgium a two-edged sword. It plays a negative role in our response rate on the one hand, but on the other hand, we also feel it might very well play a positive influence on the quality of the answers we do get. We prefill as much as possible, with R&D expenditure and personnel figures from the previous year's R&D survey, for instance. This helps respondents when making estimates for the reference year, but it may also perpetuate a mistake made in earlier years. The fact that countries differ in the practical implementation of CIS may negatively impact comparability between countries. Recommendation of best practices might help here. |
|||
|
|||||||||||||||
| 12.1. Relevance - User Needs | |||||||||||||||
Besides the needs Eurostat, OECD, and the European Innovation Scoreboard have, very few other user needs are made known to us. Researchers will often add additional questions to the questionnaire, keeping an eye on the questionnaire's length as we have a voluntary CIS. |
|||||||||||||||
| 12.1.1. Needs at national level | |||||||||||||||
|
|||||||||||||||
| 12.2. Relevance - User Satisfaction | |||||||||||||||
We do not conduct a user satisfaction survey. Occasionally, we do receive requests for more detailed breakdowns, e.g. for certain sector associations (aggregates of certain NACE codes), for results at NUTS 2 level (provinces). We handle each of these requests on a case-by-case basis. Generally, we do not provide results at NUTS 2 level (Provinces) but at NUTS 1 level (Regions). |
|||||||||||||||
| 12.3. Completeness | |||||||||||||||
We covered all the compulsory core nace sectors. However, even within the compulsory sectors, some cells are missing. This is because no observations were available for these cells (either because there is no firm in the population, or because none of the surveyed firms answered the questionnaire). Belgium is a small country, therefore we also run into confidentiality issues for certain cells. We did not ask the following (voluntary) questions: the outlook question (5.3), information sources (7.1) , the effect of legislation on innovation (11.1 and 11.2), the reasons for no innovation (12.1, 12.2, 12.3), intellectual property rights (13.1), nor the module on logistics (section 14). |
|||||||||||||||
| 12.3.1. Data completeness - rate | |||||||||||||||
Not requested. |
|||||||||||||||
|
||||||||||||||||||||||||||||||||||||||||||||||||||||
| 13.1. Accuracy - overall | ||||||||||||||||||||||||||||||||||||||||||||||||||||
Accuracy in the statistical sense denotes the closeness of computations or estimates to the exact or true values. Statistics are not equal with the true values because of variability (the statistics change from implementation to implementation of the survey due to random effects) and bias (the average of the possible values of the statistics from implementation to implementation is not equal to the true value due to systematic effects). |
||||||||||||||||||||||||||||||||||||||||||||||||||||
| 13.2. Sampling error | ||||||||||||||||||||||||||||||||||||||||||||||||||||
That part of the difference between a population value and an estimate thereof, derived from a random sample, which is due to the fact that only a subset of the population is enumerated. |
||||||||||||||||||||||||||||||||||||||||||||||||||||
| 13.2.1. Sampling error - indicators | ||||||||||||||||||||||||||||||||||||||||||||||||||||
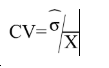
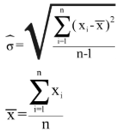
The main indicator used to measure sampling errors for CIS data is the coefficient of variation (CV).
Coefficient of Variation= (Square root of the estimate of the sampling variance) / (Estimated value) Formula: where
|
||||||||||||||||||||||||||||||||||||||||||||||||||||
| 13.2.1.1. Coefficient of variations for key variables | ||||||||||||||||||||||||||||||||||||||||||||||||||||
Coefficient of variation (%) for key variables by NACE categories and for enterprises with 10 and more employees
[1] = Coefficient of variation for the percentage of innovative enterprises (INN) in the total population of enterprises (ENT18) |
||||||||||||||||||||||||||||||||||||||||||||||||||||
| 13.2.1.2. Variance estimation method | ||||||||||||||||||||||||||||||||||||||||||||||||||||
Variances and coefficients of variation were estimated using the default of proc surveymeans in SAS. Our variance estimates took into account our sampling design. However, the fact that imputations were made for missing values was NOT taken into account, nor the fact that nonresponse was a major source of uncertainty in our estimates. Hence, the coefficients of variation reported above can be considered to be lower bounds. |
||||||||||||||||||||||||||||||||||||||||||||||||||||
| 13.3. Non-sampling error | ||||||||||||||||||||||||||||||||||||||||||||||||||||
Non-sampling errors occur in all phases of a survey. They add to the sampling errors (if present) and contribute to decreasing overall accuracy. It is important to assess their relative weight in the total error and devote appropriate resources for their control and assessment. Non-sampling errors occur in all phases of a survey. They add to the sampling errors (if present) and contribute to decreasing overall accuracy. It is important to assess their relative weight in the total error and devote appropriate resources for their control and assessment. |
||||||||||||||||||||||||||||||||||||||||||||||||||||
| 13.3.1. Coverage error | ||||||||||||||||||||||||||||||||||||||||||||||||||||
Coverage errors (or frame errors) are due to divergences between the target population and the frame population. The frame population is the set of target population members that has a chance to be selected into the survey sample. It is a listing of all items in the population from which the sample is drawn that contains contact details as well as sufficient information to perform stratification and sampling.
|
||||||||||||||||||||||||||||||||||||||||||||||||||||
| 13.3.1.1. Over-coverage - rate | ||||||||||||||||||||||||||||||||||||||||||||||||||||
Not requested. |
||||||||||||||||||||||||||||||||||||||||||||||||||||
| 13.3.1.2. Common units - proportion | ||||||||||||||||||||||||||||||||||||||||||||||||||||
Not requested. |
||||||||||||||||||||||||||||||||||||||||||||||||||||
| 13.3.1.3. Under covered groups of the target population | ||||||||||||||||||||||||||||||||||||||||||||||||||||
There may be some undercoverage of recently founded firms due to the fact that the National Social Security Office Employer database is based on information from the previous year. This is unavoidable, however, given the delay in information available from these firms. As a measure of the extent of coverage errors, we provide the missclassification rate by size class. The indicator measures the percentage of enterprises that changed stratum between the time the frame was last updated and the time the survey was carried out. The rate can be estimated based on the characteristics of the surveyed enterprises. |
||||||||||||||||||||||||||||||||||||||||||||||||||||
| 13.3.1.4. Coverage errors in coefficient variation | ||||||||||||||||||||||||||||||||||||||||||||||||||||
Variances and coefficients of variation were estimated using the default of proc surveymeans in SAS. Our variance estimates took into account our sampling design. However, the fact that imputations were made for missing values was NOT taken into account, nor the fact that nonresponse was a major source of uncertainty in our estimates. Hence, the coefficients of variation reported above can be considered to be lower bounds. |
||||||||||||||||||||||||||||||||||||||||||||||||||||
| 13.3.2. Measurement error | ||||||||||||||||||||||||||||||||||||||||||||||||||||
Measurement errors occur during data collection and generate bias by recording values different than the true ones. The survey questionnaire used for data collection may have led to the recording of wrong values, or there may be respondent or interviewer bias. |
||||||||||||||||||||||||||||||||||||||||||||||||||||
| 13.3.2.1. Measures for reducing measurement errors | ||||||||||||||||||||||||||||||||||||||||||||||||||||
We have not collected any systematic evidence regarding measurement error in CIS 2018. To reduce the risk of measurement errors, we review our questionnaire form every time to improve its clarity and user friendliness. Efforts are made to reduce response burden as much as possible, e.g. by prefilling as many fields as possible. Any comments left on the questionnaire itself or suggestions given by companies are taken into consideration when designing the next CIS. Following the recent revision of the Oslo Manual, and the subsequent redesign of the CIS2018 survey, we find this redesign has had some impact on the results obtained - We do conduct cognitive interviews of new or revised questions before we finalize our survey forms. - We keep track of comments made while the survey is in the field, and take these comments into account (as much as possible) when developing our survey form for the next wave. |
||||||||||||||||||||||||||||||||||||||||||||||||||||
| 13.3.3. Non response error | ||||||||||||||||||||||||||||||||||||||||||||||||||||
Non response occurs when a survey fails to collect data on all survey variables from all the population units designated for data collection in a sample or complete enumeration. There are two types of non-response: 1) Unit non-response, which occurs when no data (or so little as to be unusable) are collected about a population unit designated for data collection. a) Un-weighted unit non-response rate (%) = 100*(Number of units with no response or not usable response) / (Total number of in-scope (eligible) units in the sample) b) Weighted unit non-response rate (%) = 100*(Number of weighted units with no response or not usable response) / (Total number of in-scope (eligible) units in the sample) 2) Item non-response, which occurs when only data on some, but not all survey data items are collected about a population unit designated for data collection. a) Un-weighted item non-response rate (%) = 100*(Number of units with no response at all for the item) / (Total number of eligible, for the item, units in the sample i.e. filters have to be taken into account) |
||||||||||||||||||||||||||||||||||||||||||||||||||||
| 13.3.3.1. Unit non-response - rate | ||||||||||||||||||||||||||||||||||||||||||||||||||||
See below. |
||||||||||||||||||||||||||||||||||||||||||||||||||||
| 13.3.3.1.1. Un-weighted and weighted unit non-response rate by NACE categories and for enterprises with 10 or more employees | ||||||||||||||||||||||||||||||||||||||||||||||||||||
Un-weighted and weighted unit non-response rate by NACE categories and for enterprises with 10 or more employees
The number of eligible units is the number of sample units, which indeed belong to the target population. |
||||||||||||||||||||||||||||||||||||||||||||||||||||
| 13.3.3.1.2. Maximum number of recalls/reminders before coding | ||||||||||||||||||||||||||||||||||||||||||||||||||||
Two written reminders are sent out by post, phone call and e-mail reminders are sent to a limited number of enterprises. |
||||||||||||||||||||||||||||||||||||||||||||||||||||
| 13.3.3.2. Item non-response - rate | ||||||||||||||||||||||||||||||||||||||||||||||||||||
See below. |
||||||||||||||||||||||||||||||||||||||||||||||||||||
| 13.3.3.2.1. Item non-response rate for Turnover (in Core NACE: B-C-D-E-46-H-J-K-71-72-73 enterprises with 10 or more employees) | ||||||||||||||||||||||||||||||||||||||||||||||||||||
Item non-response rate for Turnover (in Core NACE: B-C-D-E-46-H-J-K-71-72-73 enterprises with 10 or more employees).
|
||||||||||||||||||||||||||||||||||||||||||||||||||||
| 13.3.3.2.2. Item non response rate for new questions | ||||||||||||||||||||||||||||||||||||||||||||||||||||
Item non-response rate for new questions in CIS t (in Core NACE: B-C-D-E-46-H-J-K-71-72-73 enterprises with 10 or more employees)
|
||||||||||||||||||||||||||||||||||||||||||||||||||||
| 13.3.4. Processing error | ||||||||||||||||||||||||||||||||||||||||||||||||||||
We are not aware of any processing errors |
||||||||||||||||||||||||||||||||||||||||||||||||||||
| 13.3.5. Model assumption error | ||||||||||||||||||||||||||||||||||||||||||||||||||||
Not requested. |
||||||||||||||||||||||||||||||||||||||||||||||||||||
|
|||
Timeliness and punctuality refer to time and dates, but in a different manner. |
|||
| 14.1. Timeliness | |||
The timeliness of statistics reflects the length of time between data availability and the event or phenomenon they describe. |
|||
| 14.1.1. Time lag - first result | |||
Timeliness of national data – date of first release of national level : July 1st, 2020 (delivery to Eurostat) |
|||
| 14.1.2. Time lag - final result | |||
Not requested. |
|||
| 14.2. Punctuality | |||
Punctuality refers to the time lag between the release date of data and the target date on which they were scheduled for release as announced officially. |
|||
| 14.2.1. Punctuality - delivery and publication | |||
Date of transmission of complete and validated data to Eurostat (Number of days between that data and 30 June 2020) : July 1st 2020 |
|||
|
||||||||||||||||||||
Comparability aims at measuring the impact of differences in applied statistical concepts and definitions on the comparison of statistics between geographical areas, non-geographical domains, or over time. The coherence of statistical outputs refers to the degree to which the statistical processes by which they were generated used the same concepts (classifications, definitions, and target populations) and harmonised methods. Coherent statistical outputs have the potential to be validly combined and used jointly. |
||||||||||||||||||||
| 15.1. Comparability - geographical | ||||||||||||||||||||
We use the same statistical concepts and definitions in all regions, and as far as we're aware, those are the same concepts and definitions used in the rest of the EU. |
||||||||||||||||||||
| 15.1.1. Asymmetry for mirror flow statistics - coefficient | ||||||||||||||||||||
Not requested. |
||||||||||||||||||||
| 15.1.2. National questionnaire – compliance with Eurostat model questionnaire | ||||||||||||||||||||
Methodological deviations from the CIS Harmonised Data Collection (HDC)
|
||||||||||||||||||||
| 15.1.3. National questionnaire – additional questions | ||||||||||||||||||||
Methodological deviations from the CIS Harmonised Data Collection (HDC)
|
||||||||||||||||||||
| 15.2. Comparability - over time | ||||||||||||||||||||
Due to important methodological changes in CIS 2018 driven by Oslo Manual 2018, the data 2018 cannot be directly compared with previous CIS waves. |
||||||||||||||||||||
| 15.2.1. Length of comparable time series | ||||||||||||||||||||
Not requested. |
||||||||||||||||||||
| 15.3. Coherence - cross domain | ||||||||||||||||||||
See the comparison between SBS and CIS data in the section 15.3.3 below. |
||||||||||||||||||||
| 15.3.1. Coherence - sub annual and annual statistics | ||||||||||||||||||||
Not requested. |
||||||||||||||||||||
| 15.3.2. Coherence - National Accounts | ||||||||||||||||||||
Not requested. |
||||||||||||||||||||
| 15.3.3. Coherence – Structural Business Statistics (SBS) | ||||||||||||||||||||
This part compares key variables for aggregated CIS data with SBS data
* Numbers are to be provided for the last year of the reference period (t) |
||||||||||||||||||||
| 15.4. Coherence - internal | ||||||||||||||||||||
Not requested. |
||||||||||||||||||||
|
|||
|
|||
| 17.1. Data revision - policy | |||
Not requested. |
|||
| 17.2. Data revision - practice | |||
Not requested. |
|||
| 17.2.1. Data revision - average size | |||
Not requested. |
|||
|
||||||||||||||||||||||||||||||||||||||
| 18.1. Source data | ||||||||||||||||||||||||||||||||||||||
See below |
||||||||||||||||||||||||||||||||||||||
| 18.1.1. Sampling frame (or census frame) | ||||||||||||||||||||||||||||||||||||||
Due to confidentiality constraints the official Belgian business register could not be used. Instead, we used as frame population register available from the Belgian National Social Security Office which contains all active employers in Belgium. We used its December 2018 version. This register was agreed upon by Statistics Belgium as being statistically equivalent to the official business register. The total number of firms in the population was 14,678. |
||||||||||||||||||||||||||||||||||||||
| 18.1.2. Sampling design | ||||||||||||||||||||||||||||||||||||||
Belgium is composed of 3 Regions (at NUTS 1 level): Flanders, Brussels, and Wallonia. Each Region is endowed with its own statistical office. Therefore, three separate samples were drawn. 1. For the Brussels Region Strata considered were formed by crossing size and NACE division (at 2-digit level). A census was performed for all large and medium-large enterprises, except for a sampling of the NACE 46 (sampling rate around 61%), Nace 49 (sampling rate around 83%), Nace 59 (sampling rate around 65%), Nace 62 (sampling rate around 64%), Nace 64 (sampling rate around 89%), Nace 66 (sampling rate around 84%), Nace 71 (sampling rate around 70%), Nace 73 (sampling rate around 84%). 2. For the Walloon Region Two dimensions were used for the stratification structure of the sampling: size and NACE sector. Census was done for all large and medium-sized firms, as well as small firms belonging to NACE 20-22, 33, 26- 30, 59, 61-63, and 71-72. For the remaining small size firms the following sampling rates apply: • Medium-low-tech industry: (Nace 23-25) about 43% • Low-tech industry: (Nace 8-18, 31-32, and 35-39) about 49% • Wholesale trade: (Nace 46) about 36% • Other low-tech services: (Nace 49-53, 58, 64-66, and 73) about 42% 3. For the Flemish Region Besides firm size and sector, other stratification variables that were taken into account for sampling in the Flanders region were whether or not a firm was known to have continuous R&D spending, whether or not a firm was active in biotechnology, nanotechnology or spacecraft industry and whether or not a firm recently received public funding for R&D. The inventory of firms with continuous R&D spending as obtained from the 2018 R&D survey was used as a base for the first of these variables. Census sampling was done for all large size firms (250 or more employees), for all medium size firms (50-249 employees) and for small size firms (10-49 employees) of NACE 19-22, 26-30, 59-63, and 71-72. Census sampling was also done of the small size firms known to have continuous R&D spending in the other core NACE sectors, for all small size firms active in biotechnology, nanotechnology or spacecraft industry and for all small size firms that recently received public funding for R&D. For the remaining small size firms first sampling rates were set that would meet the Eurostat precision criteria for NACE sectors grouped according to their technology level: low-tech industry (NACE 5-18, 31-39), medium low-tech industry (NACE 23-25, 33) and low-tech services (NACE 46,49-53, 58, 64-66 and 73). These were then applied proportionally to each of the NACE sectors belonging to those technology level groupings. The NACE sectors considered were at the 2-digit level (divisions). Cells that consisted of 15 or fewer firms were fully included in the sample (exhaustive sampling).
|
||||||||||||||||||||||||||||||||||||||
| 18.1.3. Target population and sample size | ||||||||||||||||||||||||||||||||||||||
|
||||||||||||||||||||||||||||||||||||||
| 18.1.4. Data source for pre-filled variables | ||||||||||||||||||||||||||||||||||||||
Variables and indicators filled or prefilled from other sources.
|
||||||||||||||||||||||||||||||||||||||
| 18.1.5. Data source and variables used for derivation and weighting | ||||||||||||||||||||||||||||||||||||||
|
||||||||||||||||||||||||||||||||||||||
| 18.2. Frequency of data collection | ||||||||||||||||||||||||||||||||||||||
According to the Commission Regulation (UE) 995/2012, the innovation statistics shall be provided to Eurostat every two years in each even year. The data collection takes place every second year in year t-2 preceding the data provision. |
||||||||||||||||||||||||||||||||||||||
| 18.3. Data collection | ||||||||||||||||||||||||||||||||||||||
See below |
||||||||||||||||||||||||||||||||||||||
| 18.3.1. Survey participation | ||||||||||||||||||||||||||||||||||||||
The survey is voluntary. |
||||||||||||||||||||||||||||||||||||||
| 18.3.2. Survey type | ||||||||||||||||||||||||||||||||||||||
We used a combination of sample and census, depending on the size of the population in the various strata, so as to make sure to match Eurostats quality criteria. |
||||||||||||||||||||||||||||||||||||||
| 18.3.3. Combination of sample survey and census data | ||||||||||||||||||||||||||||||||||||||
For the Brussels Region All large and medium-sized enterprises were included, random sampling was done for NACE 46, 49, 59, 62, 64, 66, 71, and 73 for all remaining small enterprises. For the Walloon Region - Among large and medium-sized enterprises: a census was performed. - Among small-sized enterprises (10-49 employees), random sampling was performed on each of the following 2-digit NACE sectors: 8-18, 23-25, 31, 32, 35-39, 46, 49-53, 58, 64-66, and 73. A census was performed on the small firms within all of the remaining sectors. For the Flemish Region Besides firm size and sector, other stratification variables that were taken into account for sampling in the Flanders region were whether or not a firm was known to have continuous R&D spending, whether or not a firm was active in biotechnology, nanotechnology or the spacecraft industry, and whether or not a firm recently received public funding for R&D. The inventory of firms with continuous R&D spending as obtained from the 2016 R&D survey was used as a base for the first of these variables. Census sampling was done for all large size firms (250 or more employees), for all medium size firms (50-249 employees) and for small size firms (10-49 employees) of NACE 19-22, 26-30, 59-63, and 71-72. Census sampling was also done of the small size firms known to have continuous R&D spending in the other core NACE sectors, for all small size firms active in biotechnology, nanotechnology or the spacecraft industry, and for all small size firms that recently received public funding for R&D. For the remaining small size firms first sampling rates were set that would meet the Eurostat precision criteria for NACE sectors grouped according to their technology level: low-tech industry (NACE 5-18, 31-39), medium low-tech industry (NACE 23-25, 33) and low-tech services (NACE 46,49-53, 58, 64-66 and 73). These were then applied proportionally to each of the NACE sectors belonging to those technology level groupings. The NACE sectors considered were at the 2-digit level (divisions). Cells that consisted of 15 or fewer firms were fully included in the sample (exhaustive sampling). |
||||||||||||||||||||||||||||||||||||||
| 18.3.4. Census criteria | ||||||||||||||||||||||||||||||||||||||
Only in the more populated cells in our sampling design, random sampling was applied. Generally, these were the smaller, and more low-tech firms.
1. For the Brussels Region Census was done for all large and medium-sized firms, as well as small firms belonging to NACE 20-22, 33, 26- 30, 59, 61-63, and 71-72. 2. For the Walloon Region Census was done for all large and medium-sized firms, as well as small firms belonging to NACE 20-22, 33, 26- 30, 59, 61-63, and 71-72. 3. For the Flemish Region Census sampling was done for all large size firms (250 or more employees), for all medium size firms (50-249 employees) and for small size firms (10-49 employees) of NACE 19-22, 26-30, 59-63, and 71-72. Census sampling was also done of the small size firms known to have continuous R&D spending in the other core NACE sectors, for all small size firms active in biotechnology, nanotechnology or spacecraft industry and for all small size firms that recently received public funding for R&D. |
||||||||||||||||||||||||||||||||||||||
| 18.3.5. Data collection method | ||||||||||||||||||||||||||||||||||||||
Data collection method
|
||||||||||||||||||||||||||||||||||||||
| 18.4. Data validation | ||||||||||||||||||||||||||||||||||||||
Not requested. |
||||||||||||||||||||||||||||||||||||||
| 18.5. Data compilation | ||||||||||||||||||||||||||||||||||||||
Operations performed on data to derive new information according to a given set of rules. |
||||||||||||||||||||||||||||||||||||||
| 18.5.1. Imputation - rate | ||||||||||||||||||||||||||||||||||||||
Imputation is the method of creating plausible (but artificial) substitute values for all those missing. Definition of imputation rate: Imputation rate (for the variable x) (%) = 100*(Number of replaced values) / (Total number of values for a given variable) Definition of weighted imputation rate: Weighted imputation rate= 100*(Number of total weighted replaced values) / (Total number of weighted values for a given variable) |
||||||||||||||||||||||||||||||||||||||
| 18.5.1.1. Imputation rate for metric variables | ||||||||||||||||||||||||||||||||||||||
Imputation rate for metric variables by NACE categories and for enterprises with 10 or more employees:
(1) = Total turnover in the last year of the reference period (t) (TUR) (2) = Share of the turnover in the last year of the reference period (t) due to new or improved product new to the market in the total turnover for product innovative enterprises TUR_PRD_NEW_MKT/TUR(INNO_PRD) (3) = R&D expenditure performed in-house (EXP_INNO_RND_IH) |
||||||||||||||||||||||||||||||||||||||
| 18.5.2. Weights calculation | ||||||||||||||||||||||||||||||||||||||
Weights calculation method for sample surveys
|
||||||||||||||||||||||||||||||||||||||
| 18.6. Adjustment | ||||||||||||||||||||||||||||||||||||||
Not applicable |
||||||||||||||||||||||||||||||||||||||
| 18.6.1. Seasonal adjustment | ||||||||||||||||||||||||||||||||||||||
Not requested. |
||||||||||||||||||||||||||||||||||||||
|
|||
|
|||
|
|||
| Questionnaire Brussels Dutch Questionnaire Brussels French Questionnaire Brussels English Questionnaire Wallonia Questionnaire Wallonia German Questionnaire Flanders |
|||