 |
|
|
|
||||||||||||||||||||||||||||||||||||||||||||||||||||||||||||||||||||||||||||||||||||||||||||||||||||||||
| For any question on data and metadata, please contact: EUROPEAN STATISTICAL DATA SUPPORT |
|
|||
| 1.1. Contact organisation | Eurostat, the statistical office of the European Union |
||
| 1.2. Contact organisation unit | Unit E1: Agriculture and fisheries |
||
| 1.5. Contact mail address | |||
|
|||||||||||||||||||||||||||||||||||||||||||||||||||||||||||||
| 2.1. Data description | |||||||||||||||||||||||||||||||||||||||||||||||||||||||||||||
|
|||||||||||||||||||||||||||||||||||||||||||||||||||||||||||||
| 2.2. Classification system | |||||||||||||||||||||||||||||||||||||||||||||||||||||||||||||
The following variables are recorded with regard to aquaculture production: 'Species' means the species of aquatic organisms identified using the international 3-alpha code as defined by the FAO (ASFIS List of Species for Fishery Statistics Purposes). Individual species are grouped in aggregates according to their taxonomy and living habits. These aggregates are specified in the International Standard Statistical Classification of Aquatic Animals and Plants (ISSCAAP) and indicated in the ASFIS list. 'FAO major areas' means the geographical areas as defined by the FAO (CWP Handbook of fishery statistical standards). The FAO major areas covered are: 27 'Northeast Atlantic', 37 'Mediterranean and Black Sea', 34 'Atlantic Eastern Central', 5 'European inland waters', 1 'African inland waters'. 'Cultivation method' includes ponds, cages, tanks and raceways, enclosures and pens, recirculation systems, others and not specified. For molluscs also on-bottom and off-bottom systems. 'Aquatic environment' distinguishes the water types fresh water and salt (sea and brackish) water. The methods and water types are defined in Annex I of Regulation (EC) No 762/2008. |
|||||||||||||||||||||||||||||||||||||||||||||||||||||||||||||
| 2.3. Coverage - sector | |||||||||||||||||||||||||||||||||||||||||||||||||||||||||||||
Commercial aquaculture production (NACE class A3.2) destined to human consumption (except all uses for aquatic plants). |
|||||||||||||||||||||||||||||||||||||||||||||||||||||||||||||
| 2.4. Statistical concepts and definitions | |||||||||||||||||||||||||||||||||||||||||||||||||||||||||||||
According to Regulation (EC) 762/2008, aquaculture production means the output from aquaculture at first sale. For animals, only production for human consumption is considered, while ornamental or functional species as well as feed production is excluded. By contrast, aquatic plants will be recorded notwithstanding their final use. The production volume is expressed in tonnes live weight [TLW] of the product. This weight includes all shells and bones. Data for the economic value of the production are reported as unit price in national currency per tonne [NAC_T]. The production of hatcheries and nurseries is reported in numbers and expressed in millions. Data on the structure of the aquaculture sector are expressed in thousand cubic metres, hectares or, optionally, 'metres rope length' according to the method. |
|||||||||||||||||||||||||||||||||||||||||||||||||||||||||||||
| 2.5. Statistical unit | |||||||||||||||||||||||||||||||||||||||||||||||||||||||||||||
Aquaculture production facility. Ireland and Italy added the following specifications: - Ireland “Aquaculture production facility. This is either a landbased facility or location within a coastal bay where a business applies a specific aquaculture practice upon a stock of a specific species”. - Italy: “For the territorial census the reference is the enterprise, a legally recognizable figure, with a company name, regularly registered with the Chamber of Commerce, characterized by a productive system composed of human, technical and commercial resources mainly used, in the case considered, in aquaculture activities. The company carries out its activity in one or more plants, the focal point of the survey, within which are located the breeding structures, equipped with their own logistical and territorial individuality, in turn possibly made up of different infrastructures in based on which they can be divided into different production units. An enterprise can therefore have one or more plants. The technical and production data are usually referred to individual plants, as these can have very different characteristics from each other”. |
|||||||||||||||||||||||||||||||||||||||||||||||||||||||||||||
| 2.6. Statistical population | |||||||||||||||||||||||||||||||||||||||||||||||||||||||||||||
All commercially active production facilities of aquatic animals or plants. |
|||||||||||||||||||||||||||||||||||||||||||||||||||||||||||||
| 2.7. Reference area | |||||||||||||||||||||||||||||||||||||||||||||||||||||||||||||
|
The reference area covers the European Union, Iceland and Norway. The statistics are also collected for Serbia and Turkey. 2.7.1. Geographical area covered Each country stated that the geographical area covered is “the entire territory of the country”; Cyprus specified that included are “Areas under the effective control of the Republic of Cyprus”. 2.7.2. Special territories included Spain, Portugal and Finland reported to have special territories included into their aquaculture statistics. These territories are: - Spain : Islas Canarias, Islas Baleares, Ceuta y Melilla - Portugal : Azores (no production) and Madeira - Finland: Åland Islands |
|||||||||||||||||||||||||||||||||||||||||||||||||||||||||||||
| 2.8. Coverage - Time | |||||||||||||||||||||||||||||||||||||||||||||||||||||||||||||
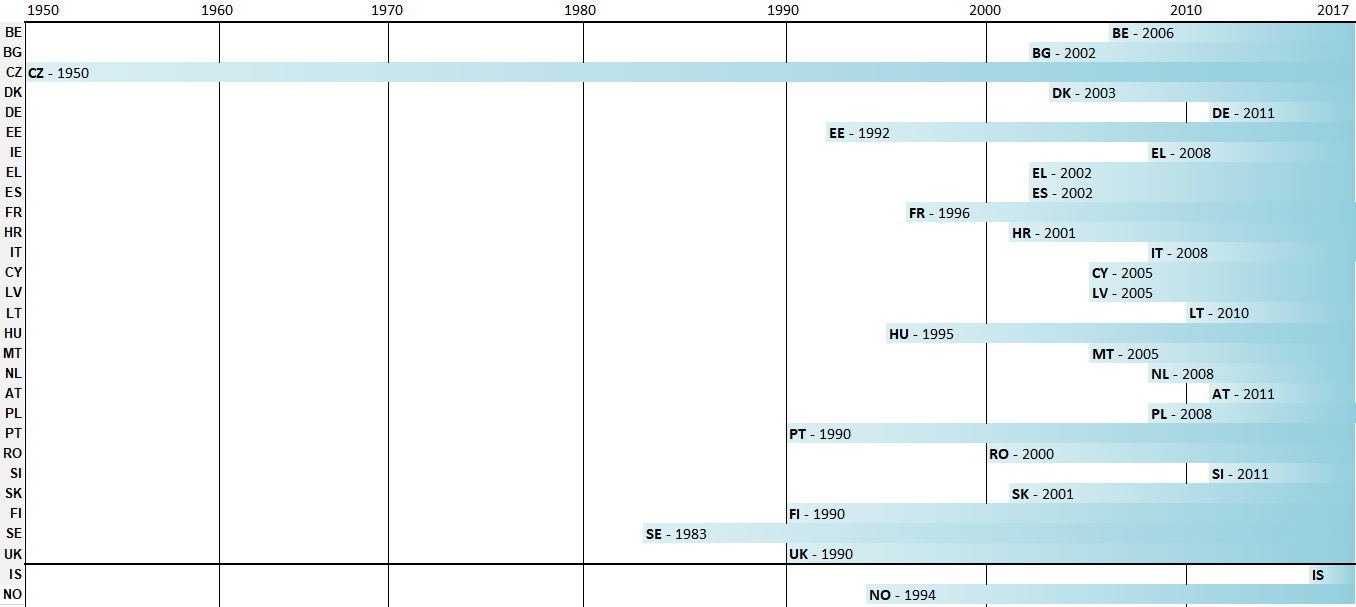
Many countries report data on aquaculture from a period earlier to the entrance into force of Regulation 762/2008. Figure 1 illustrates the time coverage of national aquaculture statistics[1]: [1] Information reported in the timeline shows the first year of recording aquaculture statistics; eventual changes in the collection due to the entry in to force of EU Regulation or any breaks in the series are not taken into account.
|
|||||||||||||||||||||||||||||||||||||||||||||||||||||||||||||
| 2.9. Base period | |||||||||||||||||||||||||||||||||||||||||||||||||||||||||||||
not applicable |
|||||||||||||||||||||||||||||||||||||||||||||||||||||||||||||
|
|||||||||||||||||||||||||||||||||||||||||||||||||||||||||||||||||||||||||||||||||||||||||||||||||||||||||||||||||||||||||||||||||||||||||||||||||||||||||||||||||||||||||||||||||||||||||||||||||||||||||||||||||||||||||||||||||||||||||||||||||||||||||||||||||||||||||||||||||||||||||||||||
| 3.1. Source data | |||||||||||||||||||||||||||||||||||||||||||||||||||||||||||||||||||||||||||||||||||||||||||||||||||||||||||||||||||||||||||||||||||||||||||||||||||||||||||||||||||||||||||||||||||||||||||||||||||||||||||||||||||||||||||||||||||||||||||||||||||||||||||||||||||||||||||||||||||||||||||||||
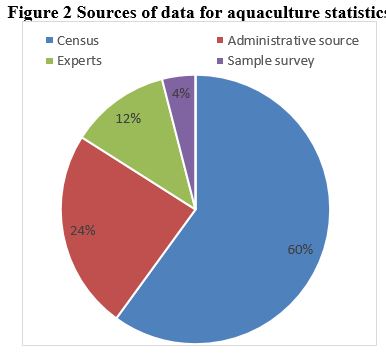
The aquaculture statistics are based several types of data sources. The most common ones are censuses (59%) and administrative data (25%). Expert estimates are the third most common data source type (12%) followed by sample surveys (4%) (Figure 2).
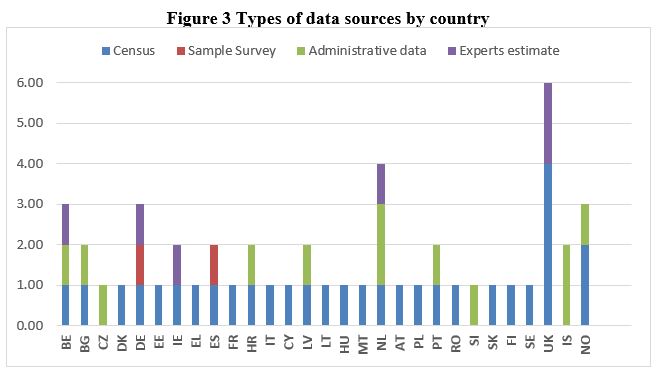
The countries reported that they use in total 51 different data sources to fulfil the reporting obligations set by Regulation (EC) No 762/2008. The situation by country is illustrated in Figure 3. The number of sources per country varied from one source (e.g. CZ, FI) to six sources (UK), the average being 2 sources per country. The figures are not always necessary fully comparable as it is not always easy to share the same perception of what a data source is (e.g. for expert estimates). A detailed list of data sources is in Annex 1[1]. [1] Germany: aquaculture statistics are obtained from three different data sources: “census”, “sample surveys” and “experts estimates”; “administrative sources” are only used to determine the population of the data collection. Romania: although on question 3.1.4 Total number of sources of the type "Administrative source" it is indicated 1, there is no reference to “administrative sources” in any further part of the NQR, therefore in this EU-level analysis Romania is considered having only 1 data source (“census”).
3.1.1. CensusCensuses are the most numerous data source for aquaculture statistics (30). In total 26 countries carry out censuses for aquaculture statistics. The most common mean of collection of census data are the postal (34%) and electronic questionnaires (31%) followed by telephone interviews (17%). Face-to-face interviews (10%) and other options (8%) are used to a lesser extent (Figure 4)[1].
Table 3 specifies the names of censuses per country as well as the population sizes and the surveyed entities (which are essentially either production facilities or enterprises).
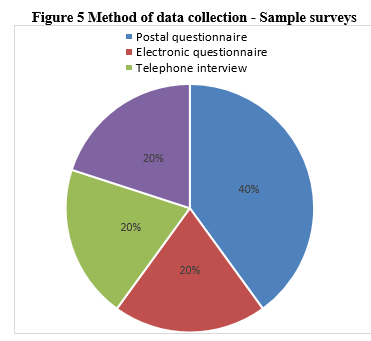
3.1.2 Sample Survey Sample surveys are carried out only in Germany and Spain. The postal questionnaires are the most common mean of data collection for sample survey data (40%) (Figure 5).
Table 4 summarises the sample surveys conducted in the two countries (surveyed entity, sample size and sampling basis).
Table 4 Name, sample size and sampling basis of sample surveys
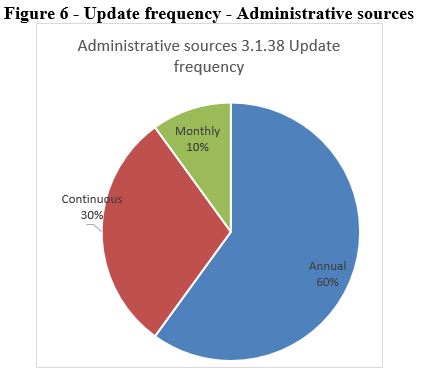
3.1.3. Administrative sourcesOverall, 12 administrative sources are utilised in 11 countries for aquaculture statistics. Most of these sources are updated on annual basis (60%), 30% continuously and 10% monthly (Figure 6).
The names of the administrative data sources are listed in Table 5. Table 5 Name of the administrative data sources by country
The countries have estimated the proximity between the definitions in the administrative register and the ones in the EU regulation. It is judged “very good” by 30% of countries, “good” by 40%, “medium” by 10% (information not available in 20% of countries). The main differences between the administrative source and the statistical definitions are the following: - Belgium: “Veterinary units can differ from production facilities. Activities are more extended than the production for human consumption. No production data are available, only a summary of the identification and registration of the enterprises is available." - Slovenia: “In addition to data on aquaculture production by commercial entities our register contains the data on aquaculture production for own consumption, too”.
3.1.4. Expert estimatesExpert estimates are used for aquaculture statistics in six countries (Table 6). Typically, they are used for complementing other data sources (surveys and/or administrative data). The experts are often working in governmental fisheries/statistical organisations both at national and regional levels, in research organisations and producer organisations.
Table 6 Names of expert data sources by country
|
|||||||||||||||||||||||||||||||||||||||||||||||||||||||||||||||||||||||||||||||||||||||||||||||||||||||||||||||||||||||||||||||||||||||||||||||||||||||||||||||||||||||||||||||||||||||||||||||||||||||||||||||||||||||||||||||||||||||||||||||||||||||||||||||||||||||||||||||||||||||||||||||
| 3.2. Frequency of data collection | |||||||||||||||||||||||||||||||||||||||||||||||||||||||||||||||||||||||||||||||||||||||||||||||||||||||||||||||||||||||||||||||||||||||||||||||||||||||||||||||||||||||||||||||||||||||||||||||||||||||||||||||||||||||||||||||||||||||||||||||||||||||||||||||||||||||||||||||||||||||||||||||
All countries stated that they collect data annually as requested by the Regulation (except for AQ5: structure of aquaculture sector: every three years). |
|||||||||||||||||||||||||||||||||||||||||||||||||||||||||||||||||||||||||||||||||||||||||||||||||||||||||||||||||||||||||||||||||||||||||||||||||||||||||||||||||||||||||||||||||||||||||||||||||||||||||||||||||||||||||||||||||||||||||||||||||||||||||||||||||||||||||||||||||||||||||||||||
| 3.3. Data collection | |||||||||||||||||||||||||||||||||||||||||||||||||||||||||||||||||||||||||||||||||||||||||||||||||||||||||||||||||||||||||||||||||||||||||||||||||||||||||||||||||||||||||||||||||||||||||||||||||||||||||||||||||||||||||||||||||||||||||||||||||||||||||||||||||||||||||||||||||||||||||||||||
List of reported data sources
|
|||||||||||||||||||||||||||||||||||||||||||||||||||||||||||||||||||||||||||||||||||||||||||||||||||||||||||||||||||||||||||||||||||||||||||||||||||||||||||||||||||||||||||||||||||||||||||||||||||||||||||||||||||||||||||||||||||||||||||||||||||||||||||||||||||||||||||||||||||||||||||||||
| 3.4. Data validation | |||||||||||||||||||||||||||||||||||||||||||||||||||||||||||||||||||||||||||||||||||||||||||||||||||||||||||||||||||||||||||||||||||||||||||||||||||||||||||||||||||||||||||||||||||||||||||||||||||||||||||||||||||||||||||||||||||||||||||||||||||||||||||||||||||||||||||||||||||||||||||||||
|
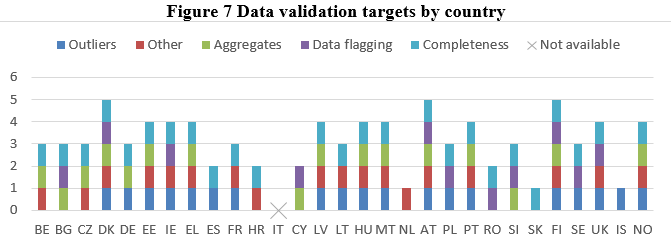
The countries reported that the data are validated before the transmission to Eurostat. The logical consistency of the data is checked. Potential outliers are screened against the time-series and the completeness of aggregates is verified (if delivered). 48% of the countries reported to have only manual validation procedures in place; 7% of countries recur to automatic validation checks; all other countries (45%) use a mixture of automatic and manual checks. Most common validation targets are “completeness” (28%), “outliers” (21%), “aggregates” (18%) and “consistency” (12%). 20% of the countries check also other validation targets. Figure 7 illustrates thecountry-specific validation targets. Austria and Finland recorded the highest amount of validation checks (5); Iceland the lowest (1). IT, and PL and RO did not reply to this question.
|
|||||||||||||||||||||||||||||||||||||||||||||||||||||||||||||||||||||||||||||||||||||||||||||||||||||||||||||||||||||||||||||||||||||||||||||||||||||||||||||||||||||||||||||||||||||||||||||||||||||||||||||||||||||||||||||||||||||||||||||||||||||||||||||||||||||||||||||||||||||||||||||||
| 3.5. Data compilation | |||||||||||||||||||||||||||||||||||||||||||||||||||||||||||||||||||||||||||||||||||||||||||||||||||||||||||||||||||||||||||||||||||||||||||||||||||||||||||||||||||||||||||||||||||||||||||||||||||||||||||||||||||||||||||||||||||||||||||||||||||||||||||||||||||||||||||||||||||||||||||||||
|
|
|||||||||||||||||||||||||||||||||||||||||||||||||||||||||||||||||||||||||||||||||||||||||||||||||||||||||||||||||||||||||||||||||||||||||||||||||||||||||||||||||||||||||||||||||||||||||||||||||||||||||||||||||||||||||||||||||||||||||||||||||||||||||||||||||||||||||||||||||||||||||||||||
| 3.6. Adjustment | |||||||||||||||||||||||||||||||||||||||||||||||||||||||||||||||||||||||||||||||||||||||||||||||||||||||||||||||||||||||||||||||||||||||||||||||||||||||||||||||||||||||||||||||||||||||||||||||||||||||||||||||||||||||||||||||||||||||||||||||||||||||||||||||||||||||||||||||||||||||||||||||
|
|||||||||||||||||||||||||||||||||||||||||||||||||||||||||||||||||||||||||||||||||||||||||||||||||||||||||||||||||||||||||||||||||||||||||||||||||||||||||||||||||||||||||||||||||||||||||||||||||||||||||||||||||||||||||||||||||||||||||||||||||||||||||||||||||||||||||||||||||||||||||||||||


|
|||||||||||||||||||||||||||||||||||||||||||||||||||||||||||||||||||||||||||||||||||||||||||||||||||||||||||||||||||||||||||||||||||||||||||||||||||||||||||||||||||||||||||||||||||||||||||||||||||||||||||||||||||||||||||||||||||||||||||
Quality management is composed of quality assurance and quality assessment of data. |
|||||||||||||||||||||||||||||||||||||||||||||||||||||||||||||||||||||||||||||||||||||||||||||||||||||||||||||||||||||||||||||||||||||||||||||||||||||||||||||||||||||||||||||||||||||||||||||||||||||||||||||||||||||||||||||||||||||||||||
| 4.1. Quality assurance | |||||||||||||||||||||||||||||||||||||||||||||||||||||||||||||||||||||||||||||||||||||||||||||||||||||||||||||||||||||||||||||||||||||||||||||||||||||||||||||||||||||||||||||||||||||||||||||||||||||||||||||||||||||||||||||||||||||||||||
|
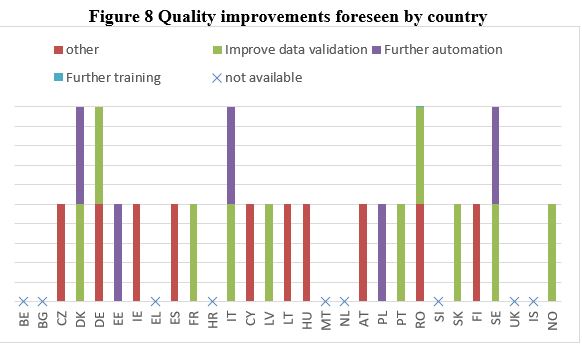
A quality management system is in place in half of the countries. The other half reported that such a procedure does not exist. 28% of the countries have already carried out a peer review, against 72% that have not yet implemented it. Several countries have planned quality improvements: of those which foresee improvements, 26% of aim at improving “data validation”, another 14% “further automation” and 3% foresee “further training”. 31% will implement “other” kinds of quality improvements, while, 26% of countries did not provide an answer to the question. Figure 8 summarises the foreseen improvements by country.
|
|||||||||||||||||||||||||||||||||||||||||||||||||||||||||||||||||||||||||||||||||||||||||||||||||||||||||||||||||||||||||||||||||||||||||||||||||||||||||||||||||||||||||||||||||||||||||||||||||||||||||||||||||||||||||||||||||||||||||||
| 4.2. Quality management - assessment | |||||||||||||||||||||||||||||||||||||||||||||||||||||||||||||||||||||||||||||||||||||||||||||||||||||||||||||||||||||||||||||||||||||||||||||||||||||||||||||||||||||||||||||||||||||||||||||||||||||||||||||||||||||||||||||||||||||||||||
|
|||||||||||||||||||||||||||||||||||||||||||||||||||||||||||||||||||||||||||||||||||||||||||||||||||||||||||||||||||||||||||||||||||||||||||||||||||||||||||||||||||||||||||||||||||||||||||||||||||||||||||||||||||||||||||||||||||||||||||
|
||||||||||||||||
| 5.1. Relevance - User Needs | ||||||||||||||||
|
Regulation (EU) No 762/2008 seems to meet relatively well the national needs. However, 6 countries have added to their data collections some additional variables, which have national relevance. They are listed in Table 9. Table 9 User needs not met by the countries
|
||||||||||||||||
| 5.2. Relevance - User Satisfaction | ||||||||||||||||
|
Only Denmark, Malta and Austria declared that they monitor user satisfaction and in both countries, users are satisfied with the available aquaculture statistics. Lithuania declared that they plan a satisfaction survey for the 2017 data
|
||||||||||||||||
| 5.3. Completeness | ||||||||||||||||
|
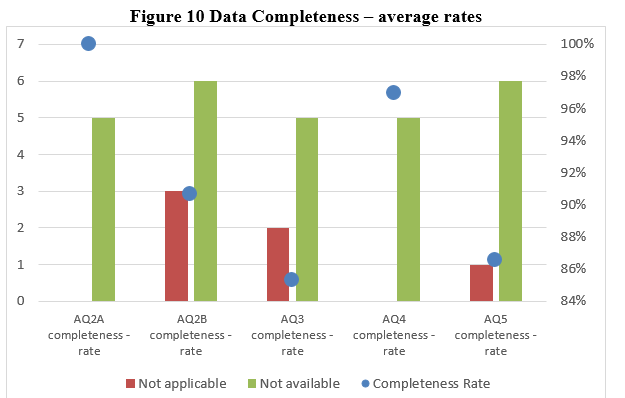
The data completeness is assessed for AQ2A (aquaculture production), AQ2B (production from hatcheries and nurseries for human consumption) AQ3 (input from wild) and AQ4 (production of juveniles and eggs). Figure 10 reports the average completeness rate of each of these indicators (blue dots) together with the indication of the number of countries replying “not applicable” and number of countries which did not reply (“not available”) AQ2A (100%) and AQ4 (97%) scored the highest completeness rates.
Missing characteristics are detailed in Table 10.
Table 10 Completeness - missing characteristics
|
||||||||||||||||
| 5.3.1. Data completeness - rate | ||||||||||||||||
not applicable |
||||||||||||||||
|
|||||||||||||||||||||||||||||||||||||||||||||||||||||||||||||||||||||||||||||||||||||||||||
The analysis of the accuracy takes into account the monitoring of the overall accuracy together with the analysis of the sampling and non-sampling errors. The latter is furthermore broken down into coverage error, measurement error and non-response error. The following paragraphs illustrate the results provided by the countries; nevertheless, more details on the accuracy and reliability of the aquaculture data can be found in Section 6 of the national quality reports. |
|||||||||||||||||||||||||||||||||||||||||||||||||||||||||||||||||||||||||||||||||||||||||||
| 6.1. Accuracy - overall | |||||||||||||||||||||||||||||||||||||||||||||||||||||||||||||||||||||||||||||||||||||||||||
|
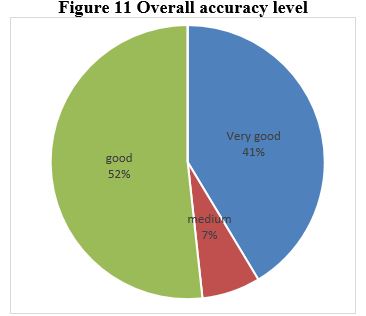
The overall accuracy indicator is a self-assessment provided by countries. 41% of countries assess the quality “very good”, 51% “good” and 7% “medium” (Figure 11). 3% of countries did not reply to this question.
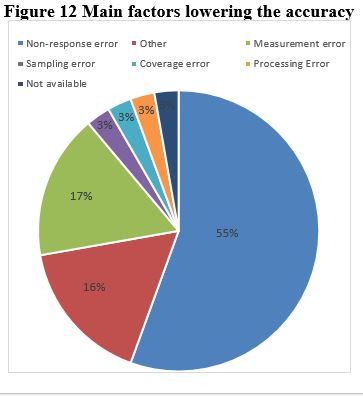
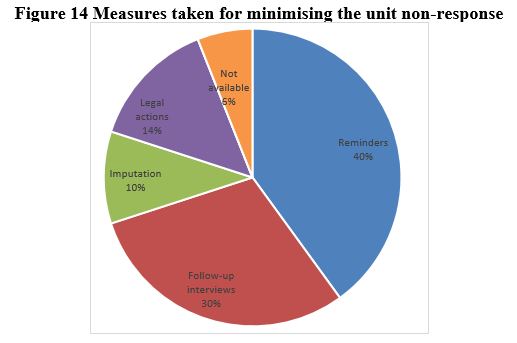
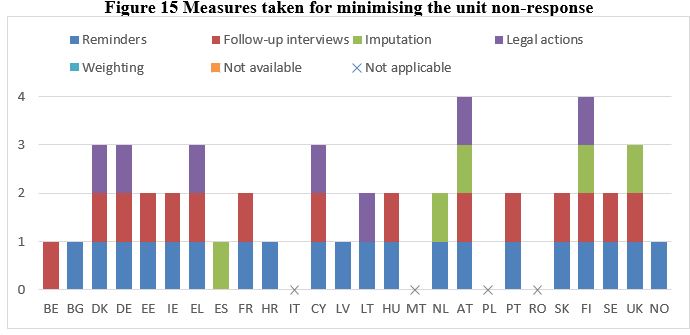
The countries were also asked to indicate which factors lower the accuracy of their aquaculture statistics. “Non-response error” (55%)is the main cause of a lower overall accuracy (Figure 12). “Measurement error” (17%) “Coverage errors”, "processing error" and “Sampling error” follow (all 3%). “other” causes are marked in 16% causes. 3% of the countries did not provide an answer.
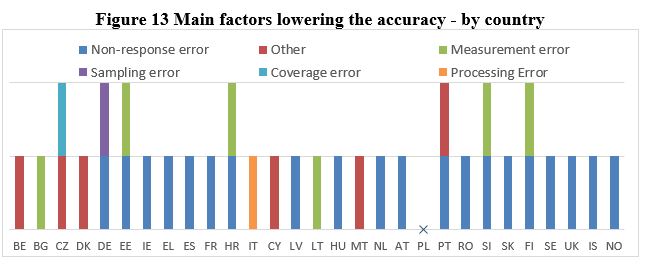
The factors lowering the accuracy are presented by country in Figure 13.
|
|||||||||||||||||||||||||||||||||||||||||||||||||||||||||||||||||||||||||||||||||||||||||||
| 6.2. Sampling error | |||||||||||||||||||||||||||||||||||||||||||||||||||||||||||||||||||||||||||||||||||||||||||
Germany applied the relative standard error; Spain indicated that an “other” method was used. |
|||||||||||||||||||||||||||||||||||||||||||||||||||||||||||||||||||||||||||||||||||||||||||
| 6.2.1. Sampling error - indicators | |||||||||||||||||||||||||||||||||||||||||||||||||||||||||||||||||||||||||||||||||||||||||||
not applicable |
|||||||||||||||||||||||||||||||||||||||||||||||||||||||||||||||||||||||||||||||||||||||||||
| 6.3. Non-sampling error | |||||||||||||||||||||||||||||||||||||||||||||||||||||||||||||||||||||||||||||||||||||||||||
not applicable |
|||||||||||||||||||||||||||||||||||||||||||||||||||||||||||||||||||||||||||||||||||||||||||
| 6.3.1. Coverage error | |||||||||||||||||||||||||||||||||||||||||||||||||||||||||||||||||||||||||||||||||||||||||||
Census The over-coverage is very rare in aquaculture censuses. Belgium, Bulgaria, Germany, Greece, Spain, Cyprus, Latvia, Lithuania, Malta, the Netherlands, Slovakia and Finland declared that the impact is “none”. Estonia, Austria, the United Kingdom and Norway declared that the impact is "low”. The rest of the countries did not reply this question. The following further information was provided:
- Austria: for calendar year 2017 c.a. 40%; - Hungary: 0% - The United Kingdom: ZERO: Scotland: Annual Fish Farm Production Survey & Annual Shellfish Farm Production Survey. Inclusion of some non-commercial (environmental research) enterprises: England & Wales: Site visits of authorised Aquaculture Production Businesses + Northern Ireland: Annual Aquaculture Production Business Survey. Applies to AQ4 only, and effect minor (estimated at <5%).
Over-coverage rate for sample survey was not reported in any of the countries; therefore the impact of on data quality was none (or not available) in all cases.
No recrd of over-coverage rate |
|||||||||||||||||||||||||||||||||||||||||||||||||||||||||||||||||||||||||||||||||||||||||||
| 6.3.1.1. Over-coverage - rate | |||||||||||||||||||||||||||||||||||||||||||||||||||||||||||||||||||||||||||||||||||||||||||
not applicable |
|||||||||||||||||||||||||||||||||||||||||||||||||||||||||||||||||||||||||||||||||||||||||||
| 6.3.1.2. Common units - proportion | |||||||||||||||||||||||||||||||||||||||||||||||||||||||||||||||||||||||||||||||||||||||||||
not applicable |
|||||||||||||||||||||||||||||||||||||||||||||||||||||||||||||||||||||||||||||||||||||||||||
| 6.3.2. Measurement error | |||||||||||||||||||||||||||||||||||||||||||||||||||||||||||||||||||||||||||||||||||||||||||
6ensus The measurement error is assessed by asking whether the questionnaire is based on the usual concepts. 96% of countries declared “yes” against 4% of “not available”.
22 were the countries which declared that they provide explanatory notes/handbook for surveyors and respondents. 15 were the countries which have an on-line FAQ or hotline for surveyors/respondents.
9 countries listed a set of other actions taken to reduce the measurement errors in their censuses (Table 11):
Table 11Other actions taken for reducing the measurement error - census
Only Germany and Spain conducted sample surveys for aquaculture. Table 12 illustrates the measurement error reduction actions taken by them. Table 12 Measurement error – sample survey
|
|||||||||||||||||||||||||||||||||||||||||||||||||||||||||||||||||||||||||||||||||||||||||||
| 6.3.3. Non response error | |||||||||||||||||||||||||||||||||||||||||||||||||||||||||||||||||||||||||||||||||||||||||||
|
|||||||||||||||||||||||||||||||||||||||||||||||||||||||||||||||||||||||||||||||||||||||||||
| 6.3.3.1. Unit non-response - rate | |||||||||||||||||||||||||||||||||||||||||||||||||||||||||||||||||||||||||||||||||||||||||||
not applicable |
|||||||||||||||||||||||||||||||||||||||||||||||||||||||||||||||||||||||||||||||||||||||||||
| 6.3.3.2. Item non-response - rate | |||||||||||||||||||||||||||||||||||||||||||||||||||||||||||||||||||||||||||||||||||||||||||
not applicable |
|||||||||||||||||||||||||||||||||||||||||||||||||||||||||||||||||||||||||||||||||||||||||||
| 6.3.4. Processing error | |||||||||||||||||||||||||||||||||||||||||||||||||||||||||||||||||||||||||||||||||||||||||||
Census Sample survey |
|||||||||||||||||||||||||||||||||||||||||||||||||||||||||||||||||||||||||||||||||||||||||||
| 6.3.4.1. Imputation - rate | |||||||||||||||||||||||||||||||||||||||||||||||||||||||||||||||||||||||||||||||||||||||||||
not applicable |
|||||||||||||||||||||||||||||||||||||||||||||||||||||||||||||||||||||||||||||||||||||||||||
| 6.3.5. Model assumption error | |||||||||||||||||||||||||||||||||||||||||||||||||||||||||||||||||||||||||||||||||||||||||||
not applicable |
|||||||||||||||||||||||||||||||||||||||||||||||||||||||||||||||||||||||||||||||||||||||||||
| 6.4. Seasonal adjustment | |||||||||||||||||||||||||||||||||||||||||||||||||||||||||||||||||||||||||||||||||||||||||||
not applicable |
|||||||||||||||||||||||||||||||||||||||||||||||||||||||||||||||||||||||||||||||||||||||||||
| 6.5. Data revision - policy | |||||||||||||||||||||||||||||||||||||||||||||||||||||||||||||||||||||||||||||||||||||||||||
Countries could report if they had conceptual changes since the last quality report necessitating data revisions. Only Romania indicated that conceptual changes occurred, without though explaining the main reasons for the change. On the contrary, Cyprus, Slovakia and Iceland provided some explanations for the other reasons why the data have been revised. Table 14 Data revision – conceptual changes occurred since the last quality report
More information on the accuracy is available in section 6 of the quality reports. |
|||||||||||||||||||||||||||||||||||||||||||||||||||||||||||||||||||||||||||||||||||||||||||
| 6.6. Data revision - practice | |||||||||||||||||||||||||||||||||||||||||||||||||||||||||||||||||||||||||||||||||||||||||||
|
|
|||||||||||||||||||||||||||||||||||||||||||||||||||||||||||||||||||||||||||||||||||||||||||
| 6.6.1. Data revision - average size | |||||||||||||||||||||||||||||||||||||||||||||||||||||||||||||||||||||||||||||||||||||||||||
0 |
|||||||||||||||||||||||||||||||||||||||||||||||||||||||||||||||||||||||||||||||||||||||||||
|
|||||||||||||||||||||||||||||||||||||||||||||||||||||||||||||||||||||||||||||||||||||||||||
Regulation (EC) 762/2008 sets up the data transmission calendar for aquaculture statistics |
|||||||||||||||||||||||||||||||||||||||||||||||||||||||||||||||||||||||||||||||||||||||||||
| 7.1. Timeliness | |||||||||||||||||||||||||||||||||||||||||||||||||||||||||||||||||||||||||||||||||||||||||||
|
|||||||||||||||||||||||||||||||||||||||||||||||||||||||||||||||||||||||||||||||||||||||||||
| 7.1.1. Time lag - first result | |||||||||||||||||||||||||||||||||||||||||||||||||||||||||||||||||||||||||||||||||||||||||||
not applicable |
|||||||||||||||||||||||||||||||||||||||||||||||||||||||||||||||||||||||||||||||||||||||||||
| 7.1.2. Time lag - final result | |||||||||||||||||||||||||||||||||||||||||||||||||||||||||||||||||||||||||||||||||||||||||||
not applicable |
|||||||||||||||||||||||||||||||||||||||||||||||||||||||||||||||||||||||||||||||||||||||||||
| 7.2. Punctuality | |||||||||||||||||||||||||||||||||||||||||||||||||||||||||||||||||||||||||||||||||||||||||||
The punctuality of the data transmissions is assessed by Eurostat on the basis of the date of the received transmissions in EDAMIS. Table 16 shows the availability and punctuality of aquaculture datasets for reference year 2017[1]. The table also reports the status of the delivery of the quality report.
Based on the analysis of the Punctuality it can be pointed out that: · Bulgaria: 2017 data for AQ2a and AQ4 were transmitted with 18 days delay; AQ5 data were transmitted with almost 6 months delay (179days). · Spain: 2017 data not delivered for AQ3, AQ4 and AQ5. The ones for AQ2A and AQ2B were transmitted 1 month after deadline. . France: all data 2017 were transmitted but datasets AQ3, AQ4 and AQ5 were transmitted with approximately 1 month delay (31, 32 and 51 days respectively). · Italy: 2017 aquaculture data were transmitted one month after the deadline. · Romania: 2017 data for AQ5 were not transmitted; datasets AQ2A and AQ4 were transmitted 2 weeks and 1 month after deadline respectively. · United Kingdom: 2017 data were transmitted with approximately 2 months delay
Several quality reports required thorough review, while Poland and Romania did not transmit the final revised version of their quality reports (AQ6).
The table reports the delay in days from the expected deadline. When the cell is left blank it means that there was no delay recorded (with the exception of AQ6 Quality report where, if the cell is left white, it means that the national quality report has been validated and sent for publication. [1] Table 16 illustrates countries according to their delay in the data transmission. It is taken into account the delay of the first version of the data transmitted; the first version of the transmission does not always correspond to the final one. There are cases where the final corrected version of a dataset was transmitted considerably later than the first version (e.g. they exist 4 versions of AQ2A for Austria, Bulgaria, Ireland and Poland). |
|||||||||||||||||||||||||||||||||||||||||||||||||||||||||||||||||||||||||||||||||||||||||||
| 7.2.1. Punctuality - delivery and publication | |||||||||||||||||||||||||||||||||||||||||||||||||||||||||||||||||||||||||||||||||||||||||||
not applicablesee section 7.2 |
|||||||||||||||||||||||||||||||||||||||||||||||||||||||||||||||||||||||||||||||||||||||||||

|
|||||||||||||||||||||||||||||||||||||||||||||||||||||||||||||||||||||||||||||||||||||||||||||||||||||||||||||||||||||||||
Coherence and comparability are assessed in two different ways: internal comparability as length of the time series and coherence against other data sets. |
|||||||||||||||||||||||||||||||||||||||||||||||||||||||||||||||||||||||||||||||||||||||||||||||||||||||||||||||||||||||||
| 8.1. Comparability - geographical | |||||||||||||||||||||||||||||||||||||||||||||||||||||||||||||||||||||||||||||||||||||||||||||||||||||||||||||||||||||||||
The analysis of the comparability over time is assessed by the length of comparable time series for aquaculture statistics (Table 17). Ireland explained in detail the reason for the breaks in the series occurred. After a cross-check analysis between the timing indicated in section 8.2.1 “length of comparable time series” and section 2.8 “coverage time of the NQR” it can be pointed out that some countries indicated inconsistent dates. For instance in EL, FI, UK and NO, the starting date of comparable time series is earlier than the indicated starting date of aquaculture statistics (Figure 16)[1].
|
|||||||||||||||||||||||||||||||||||||||||||||||||||||||||||||||||||||||||||||||||||||||||||||||||||||||||||||||||||||||||
| 8.1.1. Asymmetry for mirror flow statistics - coefficient | |||||||||||||||||||||||||||||||||||||||||||||||||||||||||||||||||||||||||||||||||||||||||||||||||||||||||||||||||||||||||
not applicable |
|||||||||||||||||||||||||||||||||||||||||||||||||||||||||||||||||||||||||||||||||||||||||||||||||||||||||||||||||||||||||
| 8.2. Comparability - over time | |||||||||||||||||||||||||||||||||||||||||||||||||||||||||||||||||||||||||||||||||||||||||||||||||||||||||||||||||||||||||
|
|||||||||||||||||||||||||||||||||||||||||||||||||||||||||||||||||||||||||||||||||||||||||||||||||||||||||||||||||||||||||
| 8.2.1. Length of comparable time series | |||||||||||||||||||||||||||||||||||||||||||||||||||||||||||||||||||||||||||||||||||||||||||||||||||||||||||||||||||||||||
see section below |
|||||||||||||||||||||||||||||||||||||||||||||||||||||||||||||||||||||||||||||||||||||||||||||||||||||||||||||||||||||||||
| 8.3. Coherence - cross domain | |||||||||||||||||||||||||||||||||||||||||||||||||||||||||||||||||||||||||||||||||||||||||||||||||||||||||||||||||||||||||
|
|||||||||||||||||||||||||||||||||||||||||||||||||||||||||||||||||||||||||||||||||||||||||||||||||||||||||||||||||||||||||
| 8.4. Coherence - sub annual and annual statistics | |||||||||||||||||||||||||||||||||||||||||||||||||||||||||||||||||||||||||||||||||||||||||||||||||||||||||||||||||||||||||
not applicable |
|||||||||||||||||||||||||||||||||||||||||||||||||||||||||||||||||||||||||||||||||||||||||||||||||||||||||||||||||||||||||
| 8.5. Coherence - National Accounts | |||||||||||||||||||||||||||||||||||||||||||||||||||||||||||||||||||||||||||||||||||||||||||||||||||||||||||||||||||||||||
not applicable |
|||||||||||||||||||||||||||||||||||||||||||||||||||||||||||||||||||||||||||||||||||||||||||||||||||||||||||||||||||||||||
| 8.6. Coherence - internal | |||||||||||||||||||||||||||||||||||||||||||||||||||||||||||||||||||||||||||||||||||||||||||||||||||||||||||||||||||||||||
not applicable |
|||||||||||||||||||||||||||||||||||||||||||||||||||||||||||||||||||||||||||||||||||||||||||||||||||||||||||||||||||||||||

|
|||||||||||||||||||||||||||||||||||||||||||||||||||||||||||||||||||||||||||||||||||||||||||||||||||||||||||||||||||||||||||||||||||||||||||||||||||||||||||||||||||||||||||||||||||||
| 9.1. Dissemination format - News release | |||||||||||||||||||||||||||||||||||||||||||||||||||||||||||||||||||||||||||||||||||||||||||||||||||||||||||||||||||||||||||||||||||||||||||||||||||||||||||||||||||||||||||||||||||||
|
|||||||||||||||||||||||||||||||||||||||||||||||||||||||||||||||||||||||||||||||||||||||||||||||||||||||||||||||||||||||||||||||||||||||||||||||||||||||||||||||||||||||||||||||||||||
| 9.2. Dissemination format - Publications | |||||||||||||||||||||||||||||||||||||||||||||||||||||||||||||||||||||||||||||||||||||||||||||||||||||||||||||||||||||||||||||||||||||||||||||||||||||||||||||||||||||||||||||||||||||
|
not applicable
|
|||||||||||||||||||||||||||||||||||||||||||||||||||||||||||||||||||||||||||||||||||||||||||||||||||||||||||||||||||||||||||||||||||||||||||||||||||||||||||||||||||||||||||||||||||||
| 9.3. Dissemination format - online database | |||||||||||||||||||||||||||||||||||||||||||||||||||||||||||||||||||||||||||||||||||||||||||||||||||||||||||||||||||||||||||||||||||||||||||||||||||||||||||||||||||||||||||||||||||||
|
not applicable
|
|||||||||||||||||||||||||||||||||||||||||||||||||||||||||||||||||||||||||||||||||||||||||||||||||||||||||||||||||||||||||||||||||||||||||||||||||||||||||||||||||||||||||||||||||||||
| 9.3.1. Data tables - consultations | |||||||||||||||||||||||||||||||||||||||||||||||||||||||||||||||||||||||||||||||||||||||||||||||||||||||||||||||||||||||||||||||||||||||||||||||||||||||||||||||||||||||||||||||||||||
Not available. |
|||||||||||||||||||||||||||||||||||||||||||||||||||||||||||||||||||||||||||||||||||||||||||||||||||||||||||||||||||||||||||||||||||||||||||||||||||||||||||||||||||||||||||||||||||||
| 9.4. Dissemination format - microdata access | |||||||||||||||||||||||||||||||||||||||||||||||||||||||||||||||||||||||||||||||||||||||||||||||||||||||||||||||||||||||||||||||||||||||||||||||||||||||||||||||||||||||||||||||||||||
|
|
|||||||||||||||||||||||||||||||||||||||||||||||||||||||||||||||||||||||||||||||||||||||||||||||||||||||||||||||||||||||||||||||||||||||||||||||||||||||||||||||||||||||||||||||||||||
| 9.5. Dissemination format - other | |||||||||||||||||||||||||||||||||||||||||||||||||||||||||||||||||||||||||||||||||||||||||||||||||||||||||||||||||||||||||||||||||||||||||||||||||||||||||||||||||||||||||||||||||||||
not applicable |
|||||||||||||||||||||||||||||||||||||||||||||||||||||||||||||||||||||||||||||||||||||||||||||||||||||||||||||||||||||||||||||||||||||||||||||||||||||||||||||||||||||||||||||||||||||
| 9.6. Documentation on methodology | |||||||||||||||||||||||||||||||||||||||||||||||||||||||||||||||||||||||||||||||||||||||||||||||||||||||||||||||||||||||||||||||||||||||||||||||||||||||||||||||||||||||||||||||||||||
|
|||||||||||||||||||||||||||||||||||||||||||||||||||||||||||||||||||||||||||||||||||||||||||||||||||||||||||||||||||||||||||||||||||||||||||||||||||||||||||||||||||||||||||||||||||||
| 9.7. Quality management - documentation | |||||||||||||||||||||||||||||||||||||||||||||||||||||||||||||||||||||||||||||||||||||||||||||||||||||||||||||||||||||||||||||||||||||||||||||||||||||||||||||||||||||||||||||||||||||
|
not applicable
|
|||||||||||||||||||||||||||||||||||||||||||||||||||||||||||||||||||||||||||||||||||||||||||||||||||||||||||||||||||||||||||||||||||||||||||||||||||||||||||||||||||||||||||||||||||||
| 9.7.1. Metadata completeness - rate | |||||||||||||||||||||||||||||||||||||||||||||||||||||||||||||||||||||||||||||||||||||||||||||||||||||||||||||||||||||||||||||||||||||||||||||||||||||||||||||||||||||||||||||||||||||
not applicable |
|||||||||||||||||||||||||||||||||||||||||||||||||||||||||||||||||||||||||||||||||||||||||||||||||||||||||||||||||||||||||||||||||||||||||||||||||||||||||||||||||||||||||||||||||||||
| 9.7.2. Metadata - consultations | |||||||||||||||||||||||||||||||||||||||||||||||||||||||||||||||||||||||||||||||||||||||||||||||||||||||||||||||||||||||||||||||||||||||||||||||||||||||||||||||||||||||||||||||||||||
not applicable |
|||||||||||||||||||||||||||||||||||||||||||||||||||||||||||||||||||||||||||||||||||||||||||||||||||||||||||||||||||||||||||||||||||||||||||||||||||||||||||||||||||||||||||||||||||||
|
|||
|
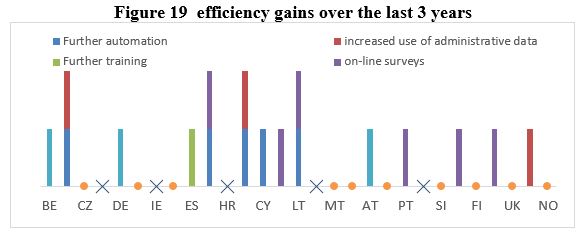
Cost and burden are assessed by efficiency gains as well as burden reductions over three years 10.1. Efficiency gains 14 countries reported on efficiency gains. The main efficiency gains were linked to “on-line surveys” (6 countries), “further automation” (5 countries) and to the “increased use of administrative data” (3 countries) and lastly “further training” (1 country). 10 countries did not report on any efficiency gains in the last three years in (Figure 19).
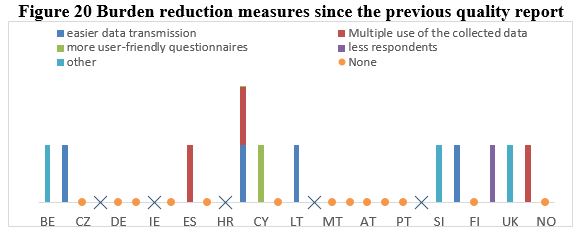
10.2. Burden reductions Burden reductions occurred in 11 countries. Easier data transmission and multiple uses of data were the most common types on burden reduction measures. Figure 19 illustrates the type of burden reductions in the countries.
|
|||
|
|||
| 11.1. Confidentiality - policy | |||
|
not applicable
|
|||
| 11.2. Confidentiality - data treatment | |||
|
not applicable
|
|||
|
|||
not applicable |
|||
|
|||
|
|||
| List of Reported Data Sources Aquaculture 2017 |
|||