Reference metadata describe statistical concepts and methodologies used for the collection and generation of data. They provide information on data quality and, since they are strongly content-oriented, assist users in interpreting the data. Reference metadata, unlike structural metadata, can be decoupled from the data.
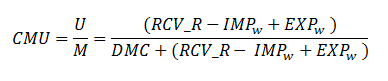
The circular material use rate, also called 'Circularity rate', measures in percentage the share of material recycled and fed back into the economy - thus saving extraction of primary raw materials - in overall material use. The Circularity rate is thus defined as the ratio of the circular use of materials (U) to the overall material use (M).
The overall material use is measured by summing up the aggregate domestic material consumption (DMC) and the circular use of materials (M = DMC + U). DMC is defined in economy-wide material flow accounts.
The circular use of materials is approximated by the amount of waste recycled in domestic recovery plants (RCV_R), minus imported waste destined for recycling (IMPw), plus exported waste destined for recycling abroad (EXPw). Waste recycled in domestic recovery plants comprises the recovery operations R2 to R11 as defined in the Waste Framework Directive 2008/98/EC. European statistics on international trade in goods (ITGS) are used to approximate the imports and exports of waste destined for recycling, i.e. the amount of imported waste bound for recycling (IMPw), and the amount of exported waste bound for recycling (EXPw).
Then, the Circularity rate is formalised as following:
A higher Circularitity rate value indicates more secondary materials substituting for primary raw materials i.e. avoiding the environmental impacts of extracting primary material.
3.2. Classification system
The circular material use rate can be broken down by four main material categories as defined and applied in economy-wide material flow accounts (EW-MFA), namely biomass, metal ores, non-metallic minerals and fossil energy materials/carriers.
3.3. Coverage - sector
The data refer to the national economies of the EU Member States and the aggregated EU economy.
3.4. Statistical concepts and definitions
The formula for calculating the circular material use rate is provided above (see section 3.1). Three existing statistical data sources are employed to compile CMU rate (see also section 18.1): waste statistics, international trade in goods statistics, and economy-wide material flow accounts.
Waste recycled is approximated using European waste statistics collected under Regulation (EC) No 2150/2002. An analysis by Eurostat concluded that the input to recovery plants based on waste statistics is an acceptable proxy for the output from recovery plants i.e., the amount of secondary raw materials that result from these operations. This waste (code RCV_R) is approximated by the amount of hazardous and non-hazardous waste treated in recovery plants excluding amounts used for energy recovery and backfilling (recovery operations R2 to R11 as defined in the Waste Framework Directive 75/442/EEC).
This amount of treated waste is corrected by imports and exports of waste. European statistics on international trade in goods (ITGS) are used to approximate the net-imports of waste destined for recycling. The methodology applied for these corrections is consistent with those for other waste management indicators derived from waste statistics Regulation. Imports of waste (IMP_RCV_R) and Exports of waste (EXP_RCV_R) are published in the data set Material flows for circular economy - Sankey diagram data (env_ac_sd).
The creation of the data set requires:
The identification of a list of CN codes for the adjustment of the U for imports and exports (see list of CN codes used).
Domestic material consumption (DMC) is an indicator derived from economy-wide material flow accounts (EW-MFA) collected under Regulation (EU) 691/2011. DMC represents the overall amount of primary raw materials used by an economy. It equals domestic extraction plus imports minus exports. Conceptually economy-wide material flow accounts belong to the international system of environmental economic accounting (SEEA-Central Framework).
3.5. Statistical unit
Statistical units are mainly enterprises but this depends also on the different data sources used to compile the circular material use rate (see section 18.1).
3.6. Statistical population
Not applicable.
3.7. Reference area
All EU Member States and the aggregated European Union.
3.8. Coverage - Time
Presented time series starts in year 2004 for the EU aggregate. Data for Member States and break down by materials (only for the EU aggregate) start in year 2010.
One of the data sources used, namely waste statistics, is available only every second year. Eurostat estimated data for the missing odd years. The other data sources necessary are available every year.
3.9. Base period
Not applicable.
The components used to calculate circular material use rate are reported in tonnes. The Cicularity rate is presented as percentage: circular use of materials to the overall material use.
Calendar year.
6.1. Institutional Mandate - legal acts and other agreements
Economy-wide material flow accounts (EW-MFA) are legally covered by Regulation (EU) 691/2011 on European Environmental Economic Accounts.
Regulation (EC) No 223/2009 on European statistics (recital 24 and Article 20(4)) of 11 March 2009 (OJ L 87, p. 164), stipulates the need to establish common principles and guidelines ensuring the confidentiality of data used for the production of European statistics and the access to those confidential data with due account for technical developments and the requirements of users in a democratic society.
7.2. Confidentiality - data treatment
Confidential data are flagged 'c' and not published. For aggregates of confidential data Eurostat's rules for confidentiality are respected.
8.1. Release calendar
There is no release calendar; data dissemination is explained in item 9 below.
8.2. Release calendar access
No particular provisions.
8.3. Release policy - user access
In line with the Community legal framework and the European Statistics Code of Practice Eurostat disseminates European statistics on Eurostat´s website (see item 10 - ´Accessibility and clarity´) respecting professional independence and in an objective, professional and transparent manner in which all users are treated equitably. The detailed arrangements are governed by the Eurostat protocol on impartial access to Eurostat data for users.
The three underpinning data source have their own specific quality assurance procedures.
In addition several consistency and plausibility checks are undertaken when the indicator is calculated.
11.2. Quality management - assessment
Quality management is good.
12.1. Relevance - User Needs
The indicator circular material use rate is part of the Circular Economy indicator set. It is used to monitor progress towards a circular economy on the thematic area of 'secondary raw materials'.
The circular economy aims at increasing the amount of material recovered and fed back into the economy, therefore reducing the generation of waste and limiting the extraction of primary raw materials. The circular material use rate measures the contribution of recycled materials to overall materials demand.
12.2. Relevance - User Satisfaction
Not available.
12.3. Completeness
Data are complete for EU aggregate since 2004 onwards. Data for Member States and break down by materials from the year 2010 onwards. In case of odd years, Eurostat gap-fills the missing information on waste treatment.
13.1. Accuracy - overall
The overall accuracy is considered to be good.
13.2. Sampling error
Not applicable.
13.3. Non-sampling error
Not applicable.
14.1. Timeliness
T+1 year
New data points are disseminated within one year after the reference year.
One of the data sources used, namely waste statistics, is available only every second year. Eurostat estimated data for the missing odd years. The other data sources necessary are available every year. The missing data are estimated by Eurostat.
14.2. Punctuality
Not available.
15.1. Comparability - geographical
Due to the common definitions and classifications the comparability over the countries is good.
15.2. Comparability - over time
The comparability over time is good due to clear statistical concepts and definitions. Revisions in methodology are usually applied backwards to the entire time series.
15.3. Coherence - cross domain
Not applicable.
15.4. Coherence - internal
The internal coherence is very high.
The cost and burden are low due to the level of automatization.
Reported errors are assessed for seriousness to determine whether they should trigger a correction of already disseminated data. Reported errors that are deemed to be significant are corrected in the disseminated data as soon as the correct data have been validated. Minor errors are corrected in the disseminated data in connection with the next regular yearly publication cycle.
Data may be published even if they are missing for certain countries or flagged as provisional/estimated or of low reliability for certain countries. They are completed/replaced with final data in connection with the next regularly yearly production cycle.
Every year Eurostat re-publishes the complete time series, which may lead to revisions of data previously published for any reference period.
18.1. Source data
The circular material use rate is calculated using three European statistics:
(1) Treatment of waste by waste category, hazardousness and waste operations (env_wastrt) collected on the basis of the Waste Statistics Regulation (EC) No 2150/2002,
(2) economy-wide material flow accounts (env_ac_mfa), and
The amounts of waste treated in domestic recovery operations (1) are corrected by net exports of waste destined for recycling sourced from Comext database (3).
18.2. Frequency of data collection
Annual for economy-wide material flow accounts and international trade in goods statistics. Biennial for treatment of waste.
18.3. Data collection
The national data is collected or compiled by the Member States and then forwarded to Eurostat.
18.4. Data validation
Data validations procedures are in place for each of the three underpinning statistical data sources.
18.5. Data compilation
Eurostat undertakes calculations described in section 3.1 and 3.4.
The circular material use rate, also called 'Circularity rate', measures in percentage the share of material recycled and fed back into the economy - thus saving extraction of primary raw materials - in overall material use. The Circularity rate is thus defined as the ratio of the circular use of materials (U) to the overall material use (M).
The overall material use is measured by summing up the aggregate domestic material consumption (DMC) and the circular use of materials (M = DMC + U). DMC is defined in economy-wide material flow accounts.
The circular use of materials is approximated by the amount of waste recycled in domestic recovery plants (RCV_R), minus imported waste destined for recycling (IMPw), plus exported waste destined for recycling abroad (EXPw). Waste recycled in domestic recovery plants comprises the recovery operations R2 to R11 as defined in the Waste Framework Directive 2008/98/EC. European statistics on international trade in goods (ITGS) are used to approximate the imports and exports of waste destined for recycling, i.e. the amount of imported waste bound for recycling (IMPw), and the amount of exported waste bound for recycling (EXPw).
Then, the Circularity rate is formalised as following:
A higher Circularitity rate value indicates more secondary materials substituting for primary raw materials i.e. avoiding the environmental impacts of extracting primary material.
22 May 2025
The formula for calculating the circular material use rate is provided above (see section 3.1). Three existing statistical data sources are employed to compile CMU rate (see also section 18.1): waste statistics, international trade in goods statistics, and economy-wide material flow accounts.
Waste recycled is approximated using European waste statistics collected under Regulation (EC) No 2150/2002. An analysis by Eurostat concluded that the input to recovery plants based on waste statistics is an acceptable proxy for the output from recovery plants i.e., the amount of secondary raw materials that result from these operations. This waste (code RCV_R) is approximated by the amount of hazardous and non-hazardous waste treated in recovery plants excluding amounts used for energy recovery and backfilling (recovery operations R2 to R11 as defined in the Waste Framework Directive 75/442/EEC).
This amount of treated waste is corrected by imports and exports of waste. European statistics on international trade in goods (ITGS) are used to approximate the net-imports of waste destined for recycling. The methodology applied for these corrections is consistent with those for other waste management indicators derived from waste statistics Regulation. Imports of waste (IMP_RCV_R) and Exports of waste (EXP_RCV_R) are published in the data set Material flows for circular economy - Sankey diagram data (env_ac_sd).
The creation of the data set requires:
The identification of a list of CN codes for the adjustment of the U for imports and exports (see list of CN codes used).
Domestic material consumption (DMC) is an indicator derived from economy-wide material flow accounts (EW-MFA) collected under Regulation (EU) 691/2011. DMC represents the overall amount of primary raw materials used by an economy. It equals domestic extraction plus imports minus exports. Conceptually economy-wide material flow accounts belong to the international system of environmental economic accounting (SEEA-Central Framework).
Statistical units are mainly enterprises but this depends also on the different data sources used to compile the circular material use rate (see section 18.1).
Not applicable.
All EU Member States and the aggregated European Union.
Calendar year.
The overall accuracy is considered to be good.
The components used to calculate circular material use rate are reported in tonnes. The Cicularity rate is presented as percentage: circular use of materials to the overall material use.
Eurostat undertakes calculations described in section 3.1 and 3.4.
The circular material use rate is calculated using three European statistics:
(1) Treatment of waste by waste category, hazardousness and waste operations (env_wastrt) collected on the basis of the Waste Statistics Regulation (EC) No 2150/2002,
(2) economy-wide material flow accounts (env_ac_mfa), and
The amounts of waste treated in domestic recovery operations (1) are corrected by net exports of waste destined for recycling sourced from Comext database (3).
Data are up-dated and disseminated every year
T+1 year
New data points are disseminated within one year after the reference year.
One of the data sources used, namely waste statistics, is available only every second year. Eurostat estimated data for the missing odd years. The other data sources necessary are available every year. The missing data are estimated by Eurostat.
Due to the common definitions and classifications the comparability over the countries is good.
The comparability over time is good due to clear statistical concepts and definitions. Revisions in methodology are usually applied backwards to the entire time series.