|
 |
|
| For any question on data and metadata, please contact: Eurostat user support |
|
|||
| 1.1. Contact organisation | Statistical Office of the Slovak Republic (SO SR) |
||
| 1.2. Contact organisation unit | Labour and Education Statistics Department |
||
| 1.5. Contact mail address | Statistical Office of the Slovak Republic (SO SR), Slovak Republic |
||
|
|||
| 2.1. Data description | |||
In 2019, the Statistical Office of the Slovak Republic (SO SR) carried out the Structure of Earnings Survey (SES) in the SR for the reference year 2018. The SES is a sample survey based on a yearly cycle. It followed after similar surveys that had been conducted for the years 1996 – 2017. Methodology of the SES, being developed on the basis of Eurostat´s recommendations, is based on the Council Regulation (EC) No 530/1999 concerning structural statistics on earnings and on labour costs, the Commission Regulation (EC) No 1738/2005 as regards the definition and transmission of information on the structure of earnings, the Commission Regulation (EC) No 698/2006 concerning the quality evaluation of structural statistics on earnings. The requirements of the Slovak government and its central bodies have been also taken into the consideration. Since 2002, the SES has been joined with an annual statistical sample survey – The average earnings information system. This survey is carried out by the Ministry of Labour, Social Affairs and Family of the Slovak Republic in cooperation with the SO SR on the basis of the Government regulation No 43/1997.
|
|||
| 2.2. Classification system | |||
National classifications corresponding to international standards:
|
|||
| 2.3. Coverage - sector | |||
Economic activities defined in sections B to S of the Statistical classification of economic activities in the European Communities (NACE Rev 2). |
|||
| 2.4. Statistical concepts and definitions | |||
Concepts and definitions are following the Council Regulation (EC) No 530/1999 of and the Commission Regulation (EC) No 1738/2005. |
|||
| 2.5. Statistical unit | |||
local kind of activity units |
|||
| 2.6. Statistical population | |||
The SES 2018 is based on a sample of employees drawn from a stratified sample of statistical units. The population consisted of all legal persons registered in the Business Register as of January 1, 2018, regardless they are profit or non-profit organizations in all economic sectors of the Slovak Republic. The Source of data for generating sample frame (set of units that can be chosen for sample) was the Register of Organizations and Register of Establishments (i.e. local units) administrated by the SO SR. Sample is a set of units chosen from the whole working population. The current sample presents information on the average wages of more than one-quarter of employees in the national economy. Presented information on earnings refers to nearly all working positions according to ISCO – 08. Partial differences in the Structure of Earnings in the Slovak Republic in comparison with the European Union result from the specific character of the Slovak wage system (for example bonuses for being on call to work outside the workplace, premiums related to profit sharing and payment in kind are not included into earnings). For this reason, we have prepared two versions of results - the survey outputs corresponding with the demand of the Slovak users and those based on the Eurostat´s requirements comparable with Community statistics on the level and structure of earnings on the basis of a list of variables established in the Regulation (EC) No 1738/2005. |
|||
| 2.7. Reference area | |||
Slovakia |
|||
| 2.8. Coverage - Time | |||
Reference year: 2018 Reference month: October 2018 |
|||
| 2.9. Base period | |||
not applicable |
|||
|
|||
| 3.1. Source data | |||
Statistical survey |
|||
| 3.2. Frequency of data collection | |||
Data are collected annually. |
|||
| 3.3. Data collection | |||
The system of data collection in the SES 2018 depended on the technical conditions of reporting units. The data was collected via electronic mail. Reporting units selected and recorded required data from the enterprise databases in connection with personal and wage programs. The inputs are divided into two files: A- inputs related to local kind - of - activity units, B- inputs related to employees.
|
|||
| 3.4. Data validation | |||
Sets of global and plausibility checks were used to verify the correctness and completeness of the information. Sometimes a different number of employees was recorded in file A (the total number of employees in the local kind-of-activity unit) in comparison with the total number of employees in file B. The data were requested repeatedly and corrected. The data were evaluated and revised on the basis of Global Checks and Plausibility Checks, indicated in EUROSTAT´s arrangements for the implementation of both, the Regulation (EC) No 530/1999 and the Regulation (EC) No 1738/2005. Data processing was realised by means of the specific software with a complex of calculations and checks. Examples of checks referring to earnings:
|
|||
| 3.5. Data compilation | |||
[Not requested] |
|||
| 3.6. Adjustment | |||
not applicable |
|||
|
|||
| 4.1. Quality assurance | |||
The quality of the results is ensured by the number of logical, mathematical and plausibility checks performed. |
|||
| 4.2. Quality management - assessment | |||
[Not requested] |
|||
|
|||
| 5.1. Relevance - User Needs | |||
The SES outputs users: Multinational organizations: EUROSTAT Directorate F: Social statistics and Information Society, Unit F-3 Labour market statistics, ILO, OECD, World Bank - to compare the situation in earnings at the international level. Official national-level: Parliament, Government, Ministries (in particular the Ministry of Finance of the Slovak Republic, the Ministry of Labour, Social Affairs and Family of the Slovak Republic), the Social insurance agency – to use these outputs for the evaluation of the state and development of society from macro and micro level. They elaborate on the analyses and forecasts of earnings development for budgetary policy-making. The forecast of the taxes is a direct input (budget revenues) for the state budget. Data classified by gender are used for implementation of the principle of equal treatment for men and women as regards access to employment, vocational training and working conditions. Statistical level: Statistical Office of the Slovak Republic. Social actors: Trade unions, Employer’s associations – to use the data for the control of keeping employee´s and employer´s rights and duties. Researches, students: Universities – to use the data for production of the study materials, the graduation thesis, doctoral thesis and research purposes. Media: Press agencies, newspapers – to inform the public about the earnings situation and development in the Slovak Republic. |
|||
| 5.2. Relevance - User Satisfaction | |||
Currently, there is no information on any lower level of user satisfaction concerning completeness (units, variables, breakdowns), accuracy or timeliness of the SES. |
|||
| 5.3. Completeness | |||
All mandatory variables required in the Council Regulation (EC) No 530/1999 and the Commission Regulation (EC) No 1738/2005 were provided. |
|||
| 5.3.1. Data completeness - rate | |||
100% |
|||
|
|||||||||||||||||||||||||||||||||||||||
| 6.1. Accuracy - overall | |||||||||||||||||||||||||||||||||||||||
Please consult 6.2.1., 6.3.1., 6.3.2., 6.3.3. and 6.3.5. |
|||||||||||||||||||||||||||||||||||||||
| 6.2. Sampling error | |||||||||||||||||||||||||||||||||||||||
See 6.2.1. |
|||||||||||||||||||||||||||||||||||||||
| 6.2.1. Sampling error - indicators | |||||||||||||||||||||||||||||||||||||||
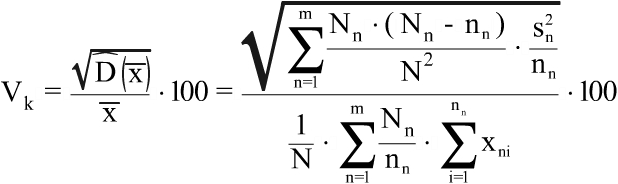
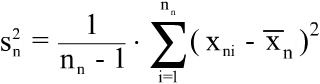
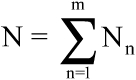
1. Probability sampling Coefficients of variation were calculated by the following formula:
where
Nn - the number of units in the stratum "n" of the universe
m - the number of stratums nn - the number of units in stratum "n" of the sample ¯x - arithmetical mean xni - mean per individual unit ¯xn - mean in stratum "n" The coefficients of variation for gross earnings and gross hourly earnings in the reference month (October) for full-time employees broken down by economic activity - Nace Rev.2, occupation (ISCO - 08), age groups, size of enterprise and sex (Tables 1a, 2a, 3a, 4a) are low. These coefficients of variation for part-time employees (Tables 1b, 2b, 3b, 4b) are higher than those related to full-time employees. The main reason of these high values is that employees in Slovakia highly prefer full-time job rather than part-time job. This fact influences the low share of employees working in part-time job in the sample.
2. Non – probability sampling Non – probability sampling was not used in the SES 2018. Annexes: Coeffic_variation_SES_2018 |
|||||||||||||||||||||||||||||||||||||||
| 6.3. Non-sampling error | |||||||||||||||||||||||||||||||||||||||
See 6.3.1. |
|||||||||||||||||||||||||||||||||||||||
| 6.3.1. Coverage error | |||||||||||||||||||||||||||||||||||||||
The population consisted of all legal subjects with one and more employees, that are registered in the Registers of organizations and establishments (i.e. local kind-of-activity units), kept by the Statistical Office of the Slovak Republic. The set covers profit and non-profit organizations in all economic activities of the Slovak Republic. As of January 1, 2018, the sample frame comprised 73 865 legal statistical units.
The sample was created by using the statistical method of a random sample within the stratum with the estimated number of inactive units. The source for data processing was the register of active and inactive reporting units. The sample consisted of 9 942 statistical units. All statistical units with 100 and more employees were fully included in the survey with regard to the influence of these big-size organizations on economic development in the Slovak Republic.
The coverage errors were caused by inaccurate data which were provided by the statistical units to the Registers of organizations and establishments. In some cases, the questionnaires included different identification data (e.g. economic activity, size, region) on surveyed statistical units as compared to the Register. Some of them were not included as their changes had not been announced to the Register. Some data from sample units were not included also for the following reasons – liquidation, bankruptcy, units had no employees, due to unknown addresses. |
|||||||||||||||||||||||||||||||||||||||
| 6.3.1.1. Over-coverage - rate | |||||||||||||||||||||||||||||||||||||||
Not available. |
|||||||||||||||||||||||||||||||||||||||
| 6.3.1.2. Common units - proportion | |||||||||||||||||||||||||||||||||||||||
Not available. |
|||||||||||||||||||||||||||||||||||||||
| 6.3.2. Measurement error | |||||||||||||||||||||||||||||||||||||||
Resulting from experiences with the regular data collection since 1996, the errors of measurement are considered as negligible. The data collection errors occurred directly from bookkeeping software. The data were evaluated and revised on the basis of Global Checks and Plausibility Checks, indicated in EUROSTAT´s arrangements for the implementation of both, the Regulation (EC) No 530/1999 and the Regulation (EC) No 1738/2005. |
|||||||||||||||||||||||||||||||||||||||
| 6.3.3. Non response error | |||||||||||||||||||||||||||||||||||||||
Sample in the year 2018 - 9 942 units Returned statistical questionnaires: 9 633 Non-response: 309 Response rate: 96.90%
The response rate for the selected variables
Upon request, reporting units were provided with assistance in completing the questionnaire. This support consisted particularly of consultations and explanations concerning methodology, definitions of variables, compilation and recording of data. After gathering and recording of data, the checks were undertaken with a focus on quantity – filling every needed indicator as well as on quality – the correctness of indicators. Therefore, the response rate for the variables surveyed was high.
Data from 309 units were not included in the survey. Out of 309 units 9 were in liquidation, 15 units in bankruptcy, 36 units did not employ any employee, 58 questionnaires were returned blank due to unknown address, 24 units had technical problems, rejected 9 units and 158 units did not provide data. |
|||||||||||||||||||||||||||||||||||||||
| 6.3.3.1. Unit non-response - rate | |||||||||||||||||||||||||||||||||||||||
Not available. |
|||||||||||||||||||||||||||||||||||||||
| 6.3.3.2. Item non-response - rate | |||||||||||||||||||||||||||||||||||||||
Not available. |
|||||||||||||||||||||||||||||||||||||||
| 6.3.4. Processing error | |||||||||||||||||||||||||||||||||||||||
Not available. |
|||||||||||||||||||||||||||||||||||||||
| 6.3.4.1. Imputation - rate | |||||||||||||||||||||||||||||||||||||||
Not available. |
|||||||||||||||||||||||||||||||||||||||
| 6.3.5. Model assumption error | |||||||||||||||||||||||||||||||||||||||
Not available. |
|||||||||||||||||||||||||||||||||||||||
| 6.4. Seasonal adjustment | |||||||||||||||||||||||||||||||||||||||
not applicable |
|||||||||||||||||||||||||||||||||||||||
| 6.5. Data revision - policy | |||||||||||||||||||||||||||||||||||||||
Not available. |
|||||||||||||||||||||||||||||||||||||||
| 6.6. Data revision - practice | |||||||||||||||||||||||||||||||||||||||
Not available. |
|||||||||||||||||||||||||||||||||||||||
| 6.6.1. Data revision - average size | |||||||||||||||||||||||||||||||||||||||
Not available. |
|||||||||||||||||||||||||||||||||||||||
 - the number of units in the universe total
|
|||
| 7.1. Timeliness | |||
The SES micro-data transmission to Eurostat ran before the deadline (11 June 2020). |
|||
| 7.1.1. Time lag - first result | |||
not applicable |
|||
| 7.1.2. Time lag - final result | |||
not applicable |
|||
| 7.2. Punctuality | |||
Phases and of data collection:
|
|||
| 7.2.1. Punctuality - delivery and publication | |||
see 7.2. |
|||
|
|||
| 8.1. Comparability - geographical | |||
the data is comparable for Slovakia over different data collection waves |
|||
| 8.1.1. Asymmetry for mirror flow statistics - coefficient | |||
not appicable |
|||
| 8.2. Comparability - over time | |||
Since 2002, the SES has been interconnected with the annual statistical sample survey – The average earnings information system. The enlargement of the number of statistical units occurred during the creation of the sample in 2002 - 2018. The scope of the sample has been enlarged from 2 500 units in 2002 to 9 942 units in 2018. The enlargement of the sample was realised for the provision of higher data representativeness, comparability and completeness on the territorial basis as the SES data are used also in the regional statistics. The SES was adapted according to the Regulation (EC) No 1738/2005 and it was enlarged by variables as follows:
1.5 Collective pay agreement 2.3 Occupation in the reference month (ISCO-08) 2.5 Highest successfully completed level of education and training (ISCED 2011) 2.6 Length of service in the enterprise 2.7.1 % share of a full-timer’s normal hours 2.8 Type of employment contract 3.1 Number of weeks in the reference year to which the gross annual earnings relate 3.2 Number of hours actually paid during the reference month 3.2.1 Number of overtime hours paid in the reference month 3.3 Annual days of holiday leave 4.1 Gross annual earnings in the reference year 4.1.1 Annual bonuses and allowances not paid in each pay period 4.2 Gross earnings in the reference month 4.2.1 Earnings related to overtime 4.2.2 Special payments for shift work 4.3 Average gross hourly earnings in the reference month |
|||
| 8.2.1. Length of comparable time series | |||
Length of comparable time-series: 16 years |
|||
| 8.3. Coherence - cross domain | |||
Coherence with the structure of employees in the Labour Force Survey (LFS) for the same reference period (2018) Definition of employees by LFS Employees - persons aged 15 years and more who work at least one hour for a public or private employer and who receive compensation in the form of wages or salaries, including members of productive co-operatives, persons on community service, and professionals in military service. Data on employed include persons not working in the reference year due to illness, holiday, maternity leave, study, weather conditions, and strike or dispute, except persons on long-term unpaid leave from work and persons on parental leave. Definition of employees by SES Employees - all persons defined in the Regulation (EC) No 1738/2005. The percentages of the SES employees out of the LFS employees are presented in the attached document Coherence_LFS_2018 (Tables 5-6). The variances in the numbers of the employees were influenced by: - the different methods of the survey’s realization and the data grossing-up, - the different methodology. The problem with the calculation of the number and the filling of the number of the employees in the LFS was another very important reason for high and low values of the ratio of the number of employees in SES as compared to the number in the LFS. It was impossible to exclude the economic activity NACE Rev.2 section A of employees from the LFS data in the table by education. The different number of employees working in part-time jobs between the LFS and the SES are influenced by the low number of employees working in this type of job in the Slovak Republic. It means that it is difficult to include these employees in the sample equally. Annexes: Coherence_LFS_2018 |
|||
| 8.4. Coherence - sub annual and annual statistics | |||
not available |
|||
| 8.5. Coherence - National Accounts | |||
Coherence with the structure of gross annual earnings in National Accounts (NA) for the same reference period (2018) The percentages of gross annual earnings in SES and NA are presented in the attached document Coherence_NA_2018 (Table 7).
The variances in gross annual earnings were influenced by: - the different methods of the survey’s realization and the data grossing-up, - the different methodology. Annexes: Coherence_NA_2018 |
|||
| 8.6. Coherence - internal | |||
see 8.2. |
|||
|
|||
| 9.1. Dissemination format - News release | |||
not available |
|||
| 9.2. Dissemination format - Publications | |||
The annual publication (Slovak and English version) is displayed on the Internet website of Statistical Office of the SR (https://www.statistics.sk). The publications include metadata, data and graphs. Key information on annual national data was issued in the publication titled Statistical Yearbook in the Slovak Republic in bilingual versions. |
|||
| 9.3. Dissemination format - online database | |||
The SES regional data with further economic and social indicators are available in the regional database of the SO SR (DATAcube). Key information on annual national data is also available at the SO SR´s website under the online database DATAcube that is free of charge. |
|||
| 9.3.1. Data tables - consultations | |||
not available |
|||
| 9.4. Dissemination format - microdata access | |||
Micro-data in the electronic transmission format were sent to EUROSTAT in 2020. |
|||
| 9.5. Dissemination format - other | |||
The SES data were used also for the ILO Yearbook of Labour Statistics Questionnaire 2019. On the basis of the SES data the structural indicator Gender Pay Gap has been calculated. |
|||
| 9.6. Documentation on methodology | |||
The annual publication (Slovak and English version) is displayed on the Internet website of Statistical Office of the SR (https://www.statistics.sk). The publications include metadata, data and graphs. |
|||
| 9.7. Quality management - documentation | |||
not available |
|||
| 9.7.1. Metadata completeness - rate | |||
not available |
|||
| 9.7.2. Metadata - consultations | |||
not available |
|||
|
|||
not available |
|||
|
|||
| 11.1. Confidentiality - policy | |||
The Law on State Statistics defines secrecy and confidential data protection. Without the approval of responding units providing the relevant individual data, this information could not be published or announced to anybody or used for other than statistical purposes. |
|||
| 11.2. Confidentiality - data treatment | |||
If the number of the statistical unit in any cell of the table formed by aggregating the individual data is less than three the data in the concerned cell is considered confidential. Confidential data are under high protection from direct or indirect identification and could not be published. |
|||
|
|||
The grossed-up results of the SES 2018 are presented in the attached document Grossed_up_results_tabular_analyses_2018 (Tables 8-17) Annexes: Grossed_up_results_tabular_analyses_2018 |
|||
|
|||
|
|||