|
 |
|
| For any question on data and metadata, please contact: Eurostat user support |
|
|||
| 1.1. Contact organisation | REPUBLIC OF BULGARIA NATIONAL STATISTICAL INSTITUTE |
||
| 1.2. Contact organisation unit | Labour Statistics Unit Business Statistics Department |
||
| 1.5. Contact mail address | 2, P. Volov Str. 1038 Sofia Bulgaria |
||
|
|||
| 2.1. Data description | |||
The Structure of Earnings Survey 2018 (SES 2018) is the fifth of the series of four-yearly surveys carried out by the National Statistical Institute of Bulgaria under the Council Regulation (EC) No 530/1999, the Commission Regulation (EC) No 1916/2000 (amended) and the Commission Regulation (EC) No 1738/2005. This quality report is prepared in accordance with the Commission Regulation No 698/2006 of 5 May 2006 implementing Council Regulation (EC) No. 530/99 concerning quality evaluation of structural statistics on labour costs and earnings. Following the structure of the CR, the document provides information on the six dimensions of the European Statistical System quality definition, namely relevance, accuracy, timeliness and punctuality, accessibility and clarity, comparability, and coherence. |
|||
| 2.2. Classification system | |||
· Classification of Economic Activities (CEA-2008, for international use NACE.BG 2008); · National Classification of Occupations and Duties-2011 (NCOD-2011) - compliant with international classification ISCO-08, · Nomenclature of Educational Levels - in compliance with the International Standard Classification of Education, 2011 version (ISCED 2011); · Classification of Territorial Units for Statistical Purposes in Bulgaria - NUTS. |
|||
| 2.3. Coverage - sector | |||
Enterprises with 1 or more employees in economic activity within sections B to S of NACE.BG-2008 are covered. |
|||
| 2.4. Statistical concepts and definitions | |||
Employees are all persons who have a direct employment contract with their employer and receive remuneration in cash or in kind for certain quality and quantity of work done, irrespective of the type of work performed, the number of working hours (full or part-time) and the duration of the employment contract (fixed or indefinite). Gross earnings are the remuneration in cash paid to the employee directly and regularly by the employer at the time of each pay period, before deductions of any tax and social security contributions payable by employee and withheld by the employer. The gross monthly earnings of employees include:
The annual gross earnings are the totalamount of the regular payments in cash received by the employee for the work performed during the reference year, including: · the value of annual payments in kind (goods and services) made available to employees by employer; · all irregular payments as quarterly bonuses, 13th or 14th salaries and other gratuities not received at each pay period. Paid hours cover the total number of normal and overtime hours to which the gross monthly earnings in the reference month relate. The number of paid hours includes: actually worked normal hours, worked and paid overtime hours, hours not worked but nevertheless paid by the employer at a full rate (annual leave, work stoppages and other hours paid such as for medical examinations). |
|||
| 2.5. Statistical unit | |||
Local units (territorial structures) with 1 or more employees belonging to enterprises with 1 or more employees. |
|||
| 2.6. Statistical population | |||
The structure of earnings statistics relates to enterprises with at least one employee in economic activities within sections B to S of NACE.BG-2008, including section O "Public administration". |
|||
| 2.7. Reference area | |||
Area of Republic of Bulgaria. |
|||
| 2.8. Coverage - Time | |||
2002, 2006, 2010, 2014, 2018 |
|||
| 2.9. Base period | |||
Not applicable. |
|||
|
||||||||||||||||||||||||||||||||||||||||||||||||||||||||
| 3.1. Source data | ||||||||||||||||||||||||||||||||||||||||||||||||||||||||
Source of the data is a sampling statistical survey..The sampling procedure used for the SES contains two stages. In the first stage, a stratified random sample of local units without replacement is drawn. Stratification criteria used include:
- 1 to 9 employees;
- BG3 - Severna i Yugoiztochna Bulgaria (North and South-East Bulgaria) In the table below are presented sampling rates for local units and employees. To achieve certain predefined precision of the results it was estimated that 186046 employees (76018 in BG3, 110028 in BG4) or 7.9% of total population shall be observed. On base of average number of employees per local unit broken down by the stratification criteria (NUTS-NACE-size) it was calculated that approximately 9.1% of local units shall be selected in the sample to obtain data for the planned number of employees. All local units with 500 and more employees and these belonging to stratification cells with fewer than 5 local units are included exhaustively in the sample. Sampling rates for local units and employees by size classes
At the second stage, a systematic sample of employees is taken within each of the selected local units. No stratification criteria are used at this second stage. For each size class were fixed different sampling rates (sampling steps) and a rotating random start digit for each local unit was allocated by computer so that the start digit is rotated continually over the economic activities. Sampling rates for employees within local units by size classes
At the first sampling stage 19 182 local units were selected, of which 17 331 responded units provided data for approximately 217 500 employees. |
||||||||||||||||||||||||||||||||||||||||||||||||||||||||
| 3.2. Frequency of data collection | ||||||||||||||||||||||||||||||||||||||||||||||||||||||||
Once per four years. |
||||||||||||||||||||||||||||||||||||||||||||||||||||||||
| 3.3. Data collection | ||||||||||||||||||||||||||||||||||||||||||||||||||||||||
Survey tools used for purposes of data collection are as follows: 1. Dispatch note to each respondent about the purposes of the survey. 2. Statistical questionnaire: part A collecting information for sampled local units and part B collecting information for each sampled employee. 3. Explanatory notes for sampling of employees within the local units and instructions on information required.
The SES questionnaire was developed on paper and in electronic format, posted on the official web page of NSI. The electronic questionnaire was developed as a user-friendly on-line application. The outlook is the same as the paper version of the questionnaire. The main advantages of the programme are:
The on-line SES2018 questionnaire was used by 81% of all responded units which is 17% more compared to the SES2014 when 64% of respondents made electronic data delivery. The survey covers all mandatory variables included in Commission Regulation N 1738/2005 and the following optional items: var. 1.6, var. 4.1.2, var. 4.3, var. 4.2.3.1, var. 4.2.3.2. Variables covered in the survey are obtained in different ways to achieve best possible results:
var. 1.1 Region;
var. 1.2 Size of the enterprise to which the local unit belongs;
- var. 2.6 Length of service in enterprise (in complete years) is calculated as at October 2018. In the questionnaire we ask for the initial date of entry into the enterprise. Var. 2.6 = 102018 - Month and year of entry in to service;
- var. 2.7.1 % share of a full-timer’s normal hours. In the questionnaire we ask for ‘Normal working hours per day’ and for the ‘Normal working days per week’. For some employees these two variables are averages, as they work different hours per day or different days per week. For a part-time employee with a given occupation, the share of normal hours relates to the normal working hours of the most similar full-time job. When corresponding full-time jobs could not be found, the normal hours of the part-timer was expressed as a % of the average working hours by the full-timers in the unit. In other words, var. 2.7.1. for a part-time employee was calculated as follows: (Hours per day*Days per week)part-time employee / (Hours per day*Days per week)full-time employee;
- var. 3.1 Number of weeks to which the gross annual earnings relate was calculated using two ‘supporting’ variables - ‘Number of days paid in 2018’ and “Normal working days per week”, where the value of var. 3.1. equals: (Number of days actually worked) / (Working days per week);
- var. 4.2 Total gross earnings in reference month. In the questionnaire we asked for ‘Total gross earning, incl. irregular bonuses and payments in kind in reference month’, ‘Irregular bonuses paid in reference month’, ‘Payments in kind paid in reference month’, where values of var. 4.2 equals: (Total gross earning, incl. irreg. bonuses and payments in kind) - (Irregular bonuses paid in reference month) - (Payments in kind paid in reference month);
- var. 4.3 Average gross hourly earnings was calculated using: Var. 4.3 = var. 4.2 / var. 3.2.;
- var. 4.3 Compulsory social contributions and taxes paid by the employer; - var. 4.3.1.1 Compulsory social security contributions; - var. 4.3.1.2 Taxes. |
||||||||||||||||||||||||||||||||||||||||||||||||||||||||
| 3.4. Data validation | ||||||||||||||||||||||||||||||||||||||||||||||||||||||||
All data have been validated at micro and macro level. Approximately 100 controls have been applied on micro data, including Eurostat’s checks listed in document “Eurostat’s arrangements for implementing CR 530/1999, the CRs 1916/2000 and 1738/2005”. When certain check was not satisfied after reference to the respondent or other available sources the data were either corrected or reasons for failure were recorded in a designated field by ROs and/or Head Office of NSI. In the next section are described Eurostat’s checks that have not been met and why NSI accepted data as valid. (Variable 2.2) Age 14 years=<(2018- var.2.2)=<80 There are records with age above 80 year. The persons are working after their retirement (in the most of cases at part-time). (Variable 4.1) Gross annual earnings in the reference year var.4.1 > (var.4.2 – var.4.2.1) * 0.70 * var.3.1 / (4.345238) Main reasons are: significant increase in the monthly earnings confirmed by LU (promotion, improved economic situation for employer, etc.), change of the daily working hours, high regular bonuses depending on productivity and other regular payments which vary between pay periods.
(Variable 4.1.2) Optional: Annual payments in kind var.4.1.2 < 0.20 * var.4.1 For the most of the cases payments in kind are fixed amounts per day worked or per month and do not depend on the size of the employee's earnings or on the employee's presence in the enterprise during the reference period.
(Variable 4.2.1) Earnings related to overtime If (var.3.2.1 > 0 and var.4.2.1 > 0), then (var.4.2.1 / var.3.2.1) ≥ (var.4.2 – var.4.2.1) / (var.3.2 - var.3.2.1) * 0.60 These are cases in which overtime payment of employees is determined on the base of: - national minimum wage; - basic wage or salary per hour and there are other significant components of the gross earning like high regular bonuses depending on productivity, high additional payments for personal qualification, length of service, etc. |
||||||||||||||||||||||||||||||||||||||||||||||||||||||||
| 3.5. Data compilation | ||||||||||||||||||||||||||||||||||||||||||||||||||||||||
The data processing goes through the following stages: · entry of the initial information into electronic format; · data validation; · data editing and imputation on the base of additional information from respondents and/or other statistical and administrative sources; · weighting of the sampling data to gross-up results over the total surveyed population; · producing of summarized table results.
The software used for data processing: · completion and processing of the individual data by respondents - MS Excel; · integration of individual files into a database, validation and export of outputs from the database by different dimensions, checks and formatting of the macro data to be sent to Eurostat – SPSS; · processing of the integrated national database, table outputs and analyses – SPSS. |
||||||||||||||||||||||||||||||||||||||||||||||||||||||||
| 3.6. Adjustment | ||||||||||||||||||||||||||||||||||||||||||||||||||||||||
Not applicable. |
||||||||||||||||||||||||||||||||||||||||||||||||||||||||
|
|||
| 4.1. Quality assurance | |||
According to Article 2, Para 3 of the Bulgarian Law on Statistics statistical information shall be produced in compliance with the following criteria for quality: adequacy, accuracy, timeliness, punctuality, accessibility and clarity, comparability and logical consistency. According to art. 10 of Council Regulation 530/1999 the national authorities shall ensure that the results reflect the true situation of the total population of units with a sufficient degree of representativity. The national authorities submit to Eurostat at its request after each reference period a report to enable the quality of the statistics to be evaluated. |
|||
| 4.2. Quality management - assessment | |||
According to the Commission Regulation 698/2006, having regard to Council Regulation (EC) No 530/1999, each Member State shall prepare quality report for evaluation of the quality of structure of earnings statistics at the latest 24 months after the end of the reference period. |
|||
|
|||
| 5.1. Relevance - User Needs | |||
The user groups are defined on the base of the data requests received by NSI. The customers of the SES results can be classified as follows:
- National - Ministries, Agencies, Councils, other governmental bodies and public institutions; - International - Eurostat, ILO, OECD, UNICEF, UNECE
|
|||
| 5.2. Relevance - User Satisfaction | |||
NSI has not carried out a specific survey among users to know their needs of information concerning SES and whether they are satisfied with the published results. Users usually prefer more detailed data at the lowest levels of the classifications applied in the survey which is problematic due to the limited number of observations and correspondingly the lower level of precision. The most demanded data are earnings breakdowns by occupations, gender, level of education, working time conditions, existence of collective pay agreement, economic activity, public/ private control and different combinations between these variables. |
|||
| 5.3. Completeness | |||
The survey covers all mandatory variables according to the Commission Regulation (EC) No 1738/2005. There is full coverage as well in terms of size of the enterprises (with 1+ employees) and of economic activities (NACE.BG 2008 sections B - S, including O). |
|||
| 5.3.1. Data completeness - rate | |||
The survey covers all (100%) mandatory variables according to the Commission Regulation (EC) No 1738/2005 and 5 out of 10 optional variables. |
|||
|
||||||||||||||||||||||||||||||||||||||||||||||||||||||||||||||||||||||||||||||||||||||||||||||||||||||||||||||||||||||||||||||||||||||||||||||||||||||||||||||||||||||||||||||||||||||||||||||||||||||||||||||||||||||||||||||||||||||||||||||||||||||||||||||||||||||||||||||||||||||||||||||||||||||||||||||||||||||||||||||||||||||||||||||||||||||||||||||||||||||||||||||||||||||||||||||||||||||||||||||||||||||||||||||||||||||||||||||||||||||||||||||||||||||||||||||||||||||||||||||||||||||||||||||||||||||||||||||||||||||||||||||||||||||||||||||||||||||||||||||||||||||||||||||||||||||||||||||||||
| 6.1. Accuracy - overall | ||||||||||||||||||||||||||||||||||||||||||||||||||||||||||||||||||||||||||||||||||||||||||||||||||||||||||||||||||||||||||||||||||||||||||||||||||||||||||||||||||||||||||||||||||||||||||||||||||||||||||||||||||||||||||||||||||||||||||||||||||||||||||||||||||||||||||||||||||||||||||||||||||||||||||||||||||||||||||||||||||||||||||||||||||||||||||||||||||||||||||||||||||||||||||||||||||||||||||||||||||||||||||||||||||||||||||||||||||||||||||||||||||||||||||||||||||||||||||||||||||||||||||||||||||||||||||||||||||||||||||||||||||||||||||||||||||||||||||||||||||||||||||||||||||||||||||||||||||
The overall accuracy of the survey results depends on: · number of the surveyed units To achieve a certain desired accuracy of the survey results a sampling plan of employees and local units is made. First, the total number of persons who should be observed is calculated. The calculations are made with 95% confidence level that the maximum error of the estimate shall be within a preset interval. The resulting number of persons is distributed proportionally to the population by three stratification criteria: the size of the local unit, economic activity and territory (location) of the local unit. Based on the parameters of the population and proportionally distributed number of employees that need to be observed, it is calculated how many local units must be selected from each cell. · the survey framework To construct the framework population from which the sample survey is to be selected data for the local units and the number of employees from the comprehensive Annual survey of employees, hours worked, wages and salaries and other labor costs for 2017 were used. For purposes of grossing-up procedures of the sampling data, the parameters of the population are updated with information for 2018, which is available approximately 12 months after the reference period. · survey tools The survey questionnaire is developed on paper and electronic format. The electronic questionnaire allows on the one hand easier completion of large volume of data and on the other hand data are validated while entered and possible errors are identified. · methods of identifying and addressing possible errors Approximately 100 checks are applied to verify data concerning: completeness of responses, data plausibility, arithmetic and logical consistency between the collected variables. Data editing is done by: a reference back to the persons filled information, use of information from administrative sources (Personal register of insured persons of the National Social Security Institute), use of other statistical surveys containing information about the surveyed units, application of statistical methods and techniques for the assessment of missing values (mean value imputation, the most frequent value imputation, etc.). |
||||||||||||||||||||||||||||||||||||||||||||||||||||||||||||||||||||||||||||||||||||||||||||||||||||||||||||||||||||||||||||||||||||||||||||||||||||||||||||||||||||||||||||||||||||||||||||||||||||||||||||||||||||||||||||||||||||||||||||||||||||||||||||||||||||||||||||||||||||||||||||||||||||||||||||||||||||||||||||||||||||||||||||||||||||||||||||||||||||||||||||||||||||||||||||||||||||||||||||||||||||||||||||||||||||||||||||||||||||||||||||||||||||||||||||||||||||||||||||||||||||||||||||||||||||||||||||||||||||||||||||||||||||||||||||||||||||||||||||||||||||||||||||||||||||||||||||||||||
| 6.2. Sampling error | ||||||||||||||||||||||||||||||||||||||||||||||||||||||||||||||||||||||||||||||||||||||||||||||||||||||||||||||||||||||||||||||||||||||||||||||||||||||||||||||||||||||||||||||||||||||||||||||||||||||||||||||||||||||||||||||||||||||||||||||||||||||||||||||||||||||||||||||||||||||||||||||||||||||||||||||||||||||||||||||||||||||||||||||||||||||||||||||||||||||||||||||||||||||||||||||||||||||||||||||||||||||||||||||||||||||||||||||||||||||||||||||||||||||||||||||||||||||||||||||||||||||||||||||||||||||||||||||||||||||||||||||||||||||||||||||||||||||||||||||||||||||||||||||||||||||||||||||||||
Coefficients of variation (relative standard errors) are calculated by use of the Horvitz-Tompson estimator. Coefficients of variation (CVs) are low for most of the relevant items and important classification levels. |
||||||||||||||||||||||||||||||||||||||||||||||||||||||||||||||||||||||||||||||||||||||||||||||||||||||||||||||||||||||||||||||||||||||||||||||||||||||||||||||||||||||||||||||||||||||||||||||||||||||||||||||||||||||||||||||||||||||||||||||||||||||||||||||||||||||||||||||||||||||||||||||||||||||||||||||||||||||||||||||||||||||||||||||||||||||||||||||||||||||||||||||||||||||||||||||||||||||||||||||||||||||||||||||||||||||||||||||||||||||||||||||||||||||||||||||||||||||||||||||||||||||||||||||||||||||||||||||||||||||||||||||||||||||||||||||||||||||||||||||||||||||||||||||||||||||||||||||||||
| 6.2.1. Sampling error - indicators | ||||||||||||||||||||||||||||||||||||||||||||||||||||||||||||||||||||||||||||||||||||||||||||||||||||||||||||||||||||||||||||||||||||||||||||||||||||||||||||||||||||||||||||||||||||||||||||||||||||||||||||||||||||||||||||||||||||||||||||||||||||||||||||||||||||||||||||||||||||||||||||||||||||||||||||||||||||||||||||||||||||||||||||||||||||||||||||||||||||||||||||||||||||||||||||||||||||||||||||||||||||||||||||||||||||||||||||||||||||||||||||||||||||||||||||||||||||||||||||||||||||||||||||||||||||||||||||||||||||||||||||||||||||||||||||||||||||||||||||||||||||||||||||||||||||||||||||||||||
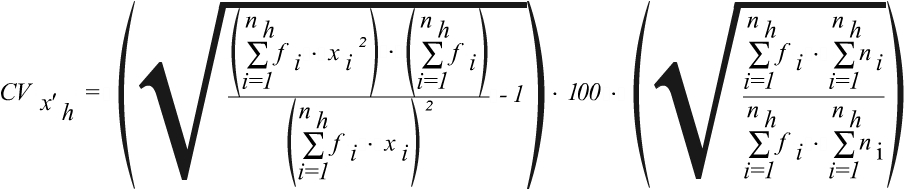
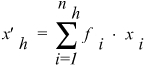
Coefficients of variation Coefficients of variaion are calculated by use of the following formula:
where x′h is estimate of the total gross earnings:
xi - individual gross earnings of each sampled employee in strata h; ni - number of sampled employees in strata h; fi - individual grossing-up factor of each sampled employee in strata h:
Mh - total number of local units in the population in strata h; mh - number of sampled local units in strata h; Nkh - total number of employees in the k-th sampled local unit in strata h; nkh - number of sampled employees in the k-th local unit.
In the the attached document Coefficients of variation are presented coefficients of variations concerning variables ‘Gross earnings in the reference month’ and ‘Average gross hourly earnings’ as required in the Commission Regulation N 698/2006. CVs are low for most of the relevant items and important classification levels. The highest CVs appeared for small heterogeneous populations with low sampling probability and in cases of high unit non-response rate (small number of observations). The following criteria were agreed for data publishing:
Extreme values were removed from the dataset and grossing-up factors were recalculated. A total 207 records were deleted that is 0.09% of all cases. Annexes: Sampling errors |
||||||||||||||||||||||||||||||||||||||||||||||||||||||||||||||||||||||||||||||||||||||||||||||||||||||||||||||||||||||||||||||||||||||||||||||||||||||||||||||||||||||||||||||||||||||||||||||||||||||||||||||||||||||||||||||||||||||||||||||||||||||||||||||||||||||||||||||||||||||||||||||||||||||||||||||||||||||||||||||||||||||||||||||||||||||||||||||||||||||||||||||||||||||||||||||||||||||||||||||||||||||||||||||||||||||||||||||||||||||||||||||||||||||||||||||||||||||||||||||||||||||||||||||||||||||||||||||||||||||||||||||||||||||||||||||||||||||||||||||||||||||||||||||||||||||||||||||||||
| 6.3. Non-sampling error | ||||||||||||||||||||||||||||||||||||||||||||||||||||||||||||||||||||||||||||||||||||||||||||||||||||||||||||||||||||||||||||||||||||||||||||||||||||||||||||||||||||||||||||||||||||||||||||||||||||||||||||||||||||||||||||||||||||||||||||||||||||||||||||||||||||||||||||||||||||||||||||||||||||||||||||||||||||||||||||||||||||||||||||||||||||||||||||||||||||||||||||||||||||||||||||||||||||||||||||||||||||||||||||||||||||||||||||||||||||||||||||||||||||||||||||||||||||||||||||||||||||||||||||||||||||||||||||||||||||||||||||||||||||||||||||||||||||||||||||||||||||||||||||||||||||||||||||||||||
See below. |
||||||||||||||||||||||||||||||||||||||||||||||||||||||||||||||||||||||||||||||||||||||||||||||||||||||||||||||||||||||||||||||||||||||||||||||||||||||||||||||||||||||||||||||||||||||||||||||||||||||||||||||||||||||||||||||||||||||||||||||||||||||||||||||||||||||||||||||||||||||||||||||||||||||||||||||||||||||||||||||||||||||||||||||||||||||||||||||||||||||||||||||||||||||||||||||||||||||||||||||||||||||||||||||||||||||||||||||||||||||||||||||||||||||||||||||||||||||||||||||||||||||||||||||||||||||||||||||||||||||||||||||||||||||||||||||||||||||||||||||||||||||||||||||||||||||||||||||||||
| 6.3.1. Coverage error | ||||||||||||||||||||||||||||||||||||||||||||||||||||||||||||||||||||||||||||||||||||||||||||||||||||||||||||||||||||||||||||||||||||||||||||||||||||||||||||||||||||||||||||||||||||||||||||||||||||||||||||||||||||||||||||||||||||||||||||||||||||||||||||||||||||||||||||||||||||||||||||||||||||||||||||||||||||||||||||||||||||||||||||||||||||||||||||||||||||||||||||||||||||||||||||||||||||||||||||||||||||||||||||||||||||||||||||||||||||||||||||||||||||||||||||||||||||||||||||||||||||||||||||||||||||||||||||||||||||||||||||||||||||||||||||||||||||||||||||||||||||||||||||||||||||||||||||||||||
The sample of local units was taken from the local units’ population as of 31.12.2017. The sampling frame represented the most current situation of the Business Register available at the time of the sampling. In the sampling frame population were included all local units with 1 or more employees that belonged to enterprises with 1 or more employees within the NACE Rev. 2 sections B to S, including O. The under-coverage refers to the situation when newly emerged or units with renewed activity with 1 or more employees within NACE sections B to S were not included in the sampling frame. The under-coverage was not quantified. To offset the errors that might arise from under-coverage and for purposes of the weighting procedure the framework population was updated where appropriate with the most recent situation of Business Register in 2018 to reflect major changes and fluctuations between NACE divisions and size classes of enterprises. As over-coverage are referred sampled local units that during the reference period have been already closed-down, dormant units or units without employees. The overall over-coverage rate is 5.9%. Over-coverage rates by NACE divisions are presented in 6.3.1.1. When there have been cases of over-coverage, new units have not been sampled. |
||||||||||||||||||||||||||||||||||||||||||||||||||||||||||||||||||||||||||||||||||||||||||||||||||||||||||||||||||||||||||||||||||||||||||||||||||||||||||||||||||||||||||||||||||||||||||||||||||||||||||||||||||||||||||||||||||||||||||||||||||||||||||||||||||||||||||||||||||||||||||||||||||||||||||||||||||||||||||||||||||||||||||||||||||||||||||||||||||||||||||||||||||||||||||||||||||||||||||||||||||||||||||||||||||||||||||||||||||||||||||||||||||||||||||||||||||||||||||||||||||||||||||||||||||||||||||||||||||||||||||||||||||||||||||||||||||||||||||||||||||||||||||||||||||||||||||||||||||
| 6.3.1.1. Over-coverage - rate | ||||||||||||||||||||||||||||||||||||||||||||||||||||||||||||||||||||||||||||||||||||||||||||||||||||||||||||||||||||||||||||||||||||||||||||||||||||||||||||||||||||||||||||||||||||||||||||||||||||||||||||||||||||||||||||||||||||||||||||||||||||||||||||||||||||||||||||||||||||||||||||||||||||||||||||||||||||||||||||||||||||||||||||||||||||||||||||||||||||||||||||||||||||||||||||||||||||||||||||||||||||||||||||||||||||||||||||||||||||||||||||||||||||||||||||||||||||||||||||||||||||||||||||||||||||||||||||||||||||||||||||||||||||||||||||||||||||||||||||||||||||||||||||||||||||||||||||||||||
Over-coverage in the sample by NACE section
|
||||||||||||||||||||||||||||||||||||||||||||||||||||||||||||||||||||||||||||||||||||||||||||||||||||||||||||||||||||||||||||||||||||||||||||||||||||||||||||||||||||||||||||||||||||||||||||||||||||||||||||||||||||||||||||||||||||||||||||||||||||||||||||||||||||||||||||||||||||||||||||||||||||||||||||||||||||||||||||||||||||||||||||||||||||||||||||||||||||||||||||||||||||||||||||||||||||||||||||||||||||||||||||||||||||||||||||||||||||||||||||||||||||||||||||||||||||||||||||||||||||||||||||||||||||||||||||||||||||||||||||||||||||||||||||||||||||||||||||||||||||||||||||||||||||||||||||||||||
| 6.3.1.2. Common units - proportion | ||||||||||||||||||||||||||||||||||||||||||||||||||||||||||||||||||||||||||||||||||||||||||||||||||||||||||||||||||||||||||||||||||||||||||||||||||||||||||||||||||||||||||||||||||||||||||||||||||||||||||||||||||||||||||||||||||||||||||||||||||||||||||||||||||||||||||||||||||||||||||||||||||||||||||||||||||||||||||||||||||||||||||||||||||||||||||||||||||||||||||||||||||||||||||||||||||||||||||||||||||||||||||||||||||||||||||||||||||||||||||||||||||||||||||||||||||||||||||||||||||||||||||||||||||||||||||||||||||||||||||||||||||||||||||||||||||||||||||||||||||||||||||||||||||||||||||||||||||
[Not requested] |
||||||||||||||||||||||||||||||||||||||||||||||||||||||||||||||||||||||||||||||||||||||||||||||||||||||||||||||||||||||||||||||||||||||||||||||||||||||||||||||||||||||||||||||||||||||||||||||||||||||||||||||||||||||||||||||||||||||||||||||||||||||||||||||||||||||||||||||||||||||||||||||||||||||||||||||||||||||||||||||||||||||||||||||||||||||||||||||||||||||||||||||||||||||||||||||||||||||||||||||||||||||||||||||||||||||||||||||||||||||||||||||||||||||||||||||||||||||||||||||||||||||||||||||||||||||||||||||||||||||||||||||||||||||||||||||||||||||||||||||||||||||||||||||||||||||||||||||||||
| 6.3.2. Measurement error | ||||||||||||||||||||||||||||||||||||||||||||||||||||||||||||||||||||||||||||||||||||||||||||||||||||||||||||||||||||||||||||||||||||||||||||||||||||||||||||||||||||||||||||||||||||||||||||||||||||||||||||||||||||||||||||||||||||||||||||||||||||||||||||||||||||||||||||||||||||||||||||||||||||||||||||||||||||||||||||||||||||||||||||||||||||||||||||||||||||||||||||||||||||||||||||||||||||||||||||||||||||||||||||||||||||||||||||||||||||||||||||||||||||||||||||||||||||||||||||||||||||||||||||||||||||||||||||||||||||||||||||||||||||||||||||||||||||||||||||||||||||||||||||||||||||||||||||||||||
To avoid measurement errors detailed explanatory notes with illustrative examples were attached to the questionnaire. To further help the respondents a list with contact information was posted on Internet and telephone consultations on methodological and technical issues were provided. The Regional Offices were also provided by the Head office of NSI with written and telephone guidance how to process data and deal with arising problems. Main sources of measurement and processing errors are:
|
||||||||||||||||||||||||||||||||||||||||||||||||||||||||||||||||||||||||||||||||||||||||||||||||||||||||||||||||||||||||||||||||||||||||||||||||||||||||||||||||||||||||||||||||||||||||||||||||||||||||||||||||||||||||||||||||||||||||||||||||||||||||||||||||||||||||||||||||||||||||||||||||||||||||||||||||||||||||||||||||||||||||||||||||||||||||||||||||||||||||||||||||||||||||||||||||||||||||||||||||||||||||||||||||||||||||||||||||||||||||||||||||||||||||||||||||||||||||||||||||||||||||||||||||||||||||||||||||||||||||||||||||||||||||||||||||||||||||||||||||||||||||||||||||||||||||||||||||||
| 6.3.3. Non response error | ||||||||||||||||||||||||||||||||||||||||||||||||||||||||||||||||||||||||||||||||||||||||||||||||||||||||||||||||||||||||||||||||||||||||||||||||||||||||||||||||||||||||||||||||||||||||||||||||||||||||||||||||||||||||||||||||||||||||||||||||||||||||||||||||||||||||||||||||||||||||||||||||||||||||||||||||||||||||||||||||||||||||||||||||||||||||||||||||||||||||||||||||||||||||||||||||||||||||||||||||||||||||||||||||||||||||||||||||||||||||||||||||||||||||||||||||||||||||||||||||||||||||||||||||||||||||||||||||||||||||||||||||||||||||||||||||||||||||||||||||||||||||||||||||||||||||||||||||||
In the table below are presented two types of unit response rates - the first one calculated to the total number of sampled units and the second one calculated to the total number of in-scope respondents (enterprises with one or more employees with earnings in October 2018). Rates are broken down by divisions of NACE Rev. 2 and by size classes - 1 or more employees, 1 to 9 employees (optional), 10 or more employees (mandatory). The overall unit response rate for in-scope respondents with 1 or more employees is 95.0% and for the mandatory size class of enterprises with 10 or more employees the response rate is 96.4%. The lowest is the unit response rate for small units with 1 to 9 employees - 94.4% and the rate to the total sample is even lower - 86.9%. The lower response rates for the enterprises with 1 to 9 employees could be explained with their dynamic nature featuring with frequent structural changes and instability as regards location, economic activity, financial status and employment - peculiarities for which it is difficult to maintain up to date information in the business register. The main reasons reported by the regional offices of NSI for the high non-response levels are rather “not found (out of date contact information)”, “closed down/sleeping”, “no employees in the reference period” than explicit refusals.
Regional offices reported that nearly 40% of respondents were reminded for their duty to reply by phone calls, e-mail and follow-up letters. In the official period of data collection (May - June 2019) 60% of responses were received. To improve response rate the deadline was prolonged with one month. Reminders were sent to the non-respondent units as special attention was paid to cells (NUTSxNACExSize) with low response rates. |
||||||||||||||||||||||||||||||||||||||||||||||||||||||||||||||||||||||||||||||||||||||||||||||||||||||||||||||||||||||||||||||||||||||||||||||||||||||||||||||||||||||||||||||||||||||||||||||||||||||||||||||||||||||||||||||||||||||||||||||||||||||||||||||||||||||||||||||||||||||||||||||||||||||||||||||||||||||||||||||||||||||||||||||||||||||||||||||||||||||||||||||||||||||||||||||||||||||||||||||||||||||||||||||||||||||||||||||||||||||||||||||||||||||||||||||||||||||||||||||||||||||||||||||||||||||||||||||||||||||||||||||||||||||||||||||||||||||||||||||||||||||||||||||||||||||||||||||||||
| 6.3.3.1. Unit non-response - rate | ||||||||||||||||||||||||||||||||||||||||||||||||||||||||||||||||||||||||||||||||||||||||||||||||||||||||||||||||||||||||||||||||||||||||||||||||||||||||||||||||||||||||||||||||||||||||||||||||||||||||||||||||||||||||||||||||||||||||||||||||||||||||||||||||||||||||||||||||||||||||||||||||||||||||||||||||||||||||||||||||||||||||||||||||||||||||||||||||||||||||||||||||||||||||||||||||||||||||||||||||||||||||||||||||||||||||||||||||||||||||||||||||||||||||||||||||||||||||||||||||||||||||||||||||||||||||||||||||||||||||||||||||||||||||||||||||||||||||||||||||||||||||||||||||||||||||||||||||||
Unit response rate
Unit non-response adjustment is done by means of the naive method of re-weighting - sample size is replaced with the number of the responded units in weighting:
Nh - total number of local units in strata h nh - number of sampled local units in strata h wh - weight of the sampled local units in strata h whfinal - adjusted weight of responded local units in strata h
|
||||||||||||||||||||||||||||||||||||||||||||||||||||||||||||||||||||||||||||||||||||||||||||||||||||||||||||||||||||||||||||||||||||||||||||||||||||||||||||||||||||||||||||||||||||||||||||||||||||||||||||||||||||||||||||||||||||||||||||||||||||||||||||||||||||||||||||||||||||||||||||||||||||||||||||||||||||||||||||||||||||||||||||||||||||||||||||||||||||||||||||||||||||||||||||||||||||||||||||||||||||||||||||||||||||||||||||||||||||||||||||||||||||||||||||||||||||||||||||||||||||||||||||||||||||||||||||||||||||||||||||||||||||||||||||||||||||||||||||||||||||||||||||||||||||||||||||||||||
| 6.3.3.2. Item non-response - rate | ||||||||||||||||||||||||||||||||||||||||||||||||||||||||||||||||||||||||||||||||||||||||||||||||||||||||||||||||||||||||||||||||||||||||||||||||||||||||||||||||||||||||||||||||||||||||||||||||||||||||||||||||||||||||||||||||||||||||||||||||||||||||||||||||||||||||||||||||||||||||||||||||||||||||||||||||||||||||||||||||||||||||||||||||||||||||||||||||||||||||||||||||||||||||||||||||||||||||||||||||||||||||||||||||||||||||||||||||||||||||||||||||||||||||||||||||||||||||||||||||||||||||||||||||||||||||||||||||||||||||||||||||||||||||||||||||||||||||||||||||||||||||||||||||||||||||||||||||||
See 6.3.4.1. |
||||||||||||||||||||||||||||||||||||||||||||||||||||||||||||||||||||||||||||||||||||||||||||||||||||||||||||||||||||||||||||||||||||||||||||||||||||||||||||||||||||||||||||||||||||||||||||||||||||||||||||||||||||||||||||||||||||||||||||||||||||||||||||||||||||||||||||||||||||||||||||||||||||||||||||||||||||||||||||||||||||||||||||||||||||||||||||||||||||||||||||||||||||||||||||||||||||||||||||||||||||||||||||||||||||||||||||||||||||||||||||||||||||||||||||||||||||||||||||||||||||||||||||||||||||||||||||||||||||||||||||||||||||||||||||||||||||||||||||||||||||||||||||||||||||||||||||||||||
| 6.3.4. Processing error | ||||||||||||||||||||||||||||||||||||||||||||||||||||||||||||||||||||||||||||||||||||||||||||||||||||||||||||||||||||||||||||||||||||||||||||||||||||||||||||||||||||||||||||||||||||||||||||||||||||||||||||||||||||||||||||||||||||||||||||||||||||||||||||||||||||||||||||||||||||||||||||||||||||||||||||||||||||||||||||||||||||||||||||||||||||||||||||||||||||||||||||||||||||||||||||||||||||||||||||||||||||||||||||||||||||||||||||||||||||||||||||||||||||||||||||||||||||||||||||||||||||||||||||||||||||||||||||||||||||||||||||||||||||||||||||||||||||||||||||||||||||||||||||||||||||||||||||||||||
The evaluation of quality at regional level was done by virtue of a questionnaire concerning number of issues. As regards measurement and processing errors Regional Offices were asked which variables have been most often corrected - wrong or missing. In the following table are listed variables that were reported by the 28 Regional offices (ROs) of NSI as being most problematic.
SES2018 variables most often corrected by the 28 Regional offices of NSI
In addition ROs reported that approximately 20% of responded units were contacted for reference on completeness, compliance and consistency of the data. Methods applied for correction of data that were identified as wrong (inconsistent, impossible values, missing values, not corresponding to definition, wrong format) differ depending on the type, seriousness of error and willingness of respondents to cooperate:
|
||||||||||||||||||||||||||||||||||||||||||||||||||||||||||||||||||||||||||||||||||||||||||||||||||||||||||||||||||||||||||||||||||||||||||||||||||||||||||||||||||||||||||||||||||||||||||||||||||||||||||||||||||||||||||||||||||||||||||||||||||||||||||||||||||||||||||||||||||||||||||||||||||||||||||||||||||||||||||||||||||||||||||||||||||||||||||||||||||||||||||||||||||||||||||||||||||||||||||||||||||||||||||||||||||||||||||||||||||||||||||||||||||||||||||||||||||||||||||||||||||||||||||||||||||||||||||||||||||||||||||||||||||||||||||||||||||||||||||||||||||||||||||||||||||||||||||||||||||
| 6.3.4.1. Imputation - rate | ||||||||||||||||||||||||||||||||||||||||||||||||||||||||||||||||||||||||||||||||||||||||||||||||||||||||||||||||||||||||||||||||||||||||||||||||||||||||||||||||||||||||||||||||||||||||||||||||||||||||||||||||||||||||||||||||||||||||||||||||||||||||||||||||||||||||||||||||||||||||||||||||||||||||||||||||||||||||||||||||||||||||||||||||||||||||||||||||||||||||||||||||||||||||||||||||||||||||||||||||||||||||||||||||||||||||||||||||||||||||||||||||||||||||||||||||||||||||||||||||||||||||||||||||||||||||||||||||||||||||||||||||||||||||||||||||||||||||||||||||||||||||||||||||||||||||||||||||||
Rates of corrected cases (including imputations for item non-response) are calculated for each variable by comparing data received initially from ROs or from respondents with final values of variables after validation and editing at the Head Office of NSI. In the table below are presented both number of corrected cases and rates computed as percentage from total number of cases.
Rates of corrected variables in SES2018 at the Head office of NSI
Normally, no item non-response (blank or zero values) has been accepted for any of the key variables. Only eight[1] of the collected items could possibly be zero and therefore item non-response could be supposed. In the following table are presented number of imputed cases and rate of imputed item non-response for these variables.
Item imputation rates
In addition, 1574 employees’ records (0.71% of all cases) were imputed for some of the local units that provided data for significantly less employees than required or provided data were completely unreliable (e.g. one record duplicated number of times). As main data donor was used the Register of insured persons that contains many of key variables.
[1] Variables “Irregular bonuses paid in reference month” and “Payments in kind paid in reference month” are not part of CR 1738/2005 but has direct influence on var. 4.2 Monthly gross earnings which is derived variable (see item 6.3.2. and 6.3.4. Measurement and processing errors).
|
||||||||||||||||||||||||||||||||||||||||||||||||||||||||||||||||||||||||||||||||||||||||||||||||||||||||||||||||||||||||||||||||||||||||||||||||||||||||||||||||||||||||||||||||||||||||||||||||||||||||||||||||||||||||||||||||||||||||||||||||||||||||||||||||||||||||||||||||||||||||||||||||||||||||||||||||||||||||||||||||||||||||||||||||||||||||||||||||||||||||||||||||||||||||||||||||||||||||||||||||||||||||||||||||||||||||||||||||||||||||||||||||||||||||||||||||||||||||||||||||||||||||||||||||||||||||||||||||||||||||||||||||||||||||||||||||||||||||||||||||||||||||||||||||||||||||||||||||||
| 6.3.5. Model assumption error | ||||||||||||||||||||||||||||||||||||||||||||||||||||||||||||||||||||||||||||||||||||||||||||||||||||||||||||||||||||||||||||||||||||||||||||||||||||||||||||||||||||||||||||||||||||||||||||||||||||||||||||||||||||||||||||||||||||||||||||||||||||||||||||||||||||||||||||||||||||||||||||||||||||||||||||||||||||||||||||||||||||||||||||||||||||||||||||||||||||||||||||||||||||||||||||||||||||||||||||||||||||||||||||||||||||||||||||||||||||||||||||||||||||||||||||||||||||||||||||||||||||||||||||||||||||||||||||||||||||||||||||||||||||||||||||||||||||||||||||||||||||||||||||||||||||||||||||||||||
The representative month of the Bulgarian SES is October. This month has been selected as least influenced by absences as public holidays and annual paid leave. There is no difference between fiscal and calendar year in Bulgaria. The Bulgarian SES 2018 covers the NACE Rev. 2 sections B to S. The full coverage of these activities depends on the ability of the register to reflect the changes of the target populations. Three variables (var. 1.1 Region, var. 1.3 Economic activity, var. 1.4 Economic and Financial control) were derived from Business register by linking of individual data trough unique identity number. |
||||||||||||||||||||||||||||||||||||||||||||||||||||||||||||||||||||||||||||||||||||||||||||||||||||||||||||||||||||||||||||||||||||||||||||||||||||||||||||||||||||||||||||||||||||||||||||||||||||||||||||||||||||||||||||||||||||||||||||||||||||||||||||||||||||||||||||||||||||||||||||||||||||||||||||||||||||||||||||||||||||||||||||||||||||||||||||||||||||||||||||||||||||||||||||||||||||||||||||||||||||||||||||||||||||||||||||||||||||||||||||||||||||||||||||||||||||||||||||||||||||||||||||||||||||||||||||||||||||||||||||||||||||||||||||||||||||||||||||||||||||||||||||||||||||||||||||||||||
| 6.4. Seasonal adjustment | ||||||||||||||||||||||||||||||||||||||||||||||||||||||||||||||||||||||||||||||||||||||||||||||||||||||||||||||||||||||||||||||||||||||||||||||||||||||||||||||||||||||||||||||||||||||||||||||||||||||||||||||||||||||||||||||||||||||||||||||||||||||||||||||||||||||||||||||||||||||||||||||||||||||||||||||||||||||||||||||||||||||||||||||||||||||||||||||||||||||||||||||||||||||||||||||||||||||||||||||||||||||||||||||||||||||||||||||||||||||||||||||||||||||||||||||||||||||||||||||||||||||||||||||||||||||||||||||||||||||||||||||||||||||||||||||||||||||||||||||||||||||||||||||||||||||||||||||||||
[Not requested] |
||||||||||||||||||||||||||||||||||||||||||||||||||||||||||||||||||||||||||||||||||||||||||||||||||||||||||||||||||||||||||||||||||||||||||||||||||||||||||||||||||||||||||||||||||||||||||||||||||||||||||||||||||||||||||||||||||||||||||||||||||||||||||||||||||||||||||||||||||||||||||||||||||||||||||||||||||||||||||||||||||||||||||||||||||||||||||||||||||||||||||||||||||||||||||||||||||||||||||||||||||||||||||||||||||||||||||||||||||||||||||||||||||||||||||||||||||||||||||||||||||||||||||||||||||||||||||||||||||||||||||||||||||||||||||||||||||||||||||||||||||||||||||||||||||||||||||||||||||
| 6.5. Data revision - policy | ||||||||||||||||||||||||||||||||||||||||||||||||||||||||||||||||||||||||||||||||||||||||||||||||||||||||||||||||||||||||||||||||||||||||||||||||||||||||||||||||||||||||||||||||||||||||||||||||||||||||||||||||||||||||||||||||||||||||||||||||||||||||||||||||||||||||||||||||||||||||||||||||||||||||||||||||||||||||||||||||||||||||||||||||||||||||||||||||||||||||||||||||||||||||||||||||||||||||||||||||||||||||||||||||||||||||||||||||||||||||||||||||||||||||||||||||||||||||||||||||||||||||||||||||||||||||||||||||||||||||||||||||||||||||||||||||||||||||||||||||||||||||||||||||||||||||||||||||||
Not applicable. |
||||||||||||||||||||||||||||||||||||||||||||||||||||||||||||||||||||||||||||||||||||||||||||||||||||||||||||||||||||||||||||||||||||||||||||||||||||||||||||||||||||||||||||||||||||||||||||||||||||||||||||||||||||||||||||||||||||||||||||||||||||||||||||||||||||||||||||||||||||||||||||||||||||||||||||||||||||||||||||||||||||||||||||||||||||||||||||||||||||||||||||||||||||||||||||||||||||||||||||||||||||||||||||||||||||||||||||||||||||||||||||||||||||||||||||||||||||||||||||||||||||||||||||||||||||||||||||||||||||||||||||||||||||||||||||||||||||||||||||||||||||||||||||||||||||||||||||||||||
| 6.6. Data revision - practice | ||||||||||||||||||||||||||||||||||||||||||||||||||||||||||||||||||||||||||||||||||||||||||||||||||||||||||||||||||||||||||||||||||||||||||||||||||||||||||||||||||||||||||||||||||||||||||||||||||||||||||||||||||||||||||||||||||||||||||||||||||||||||||||||||||||||||||||||||||||||||||||||||||||||||||||||||||||||||||||||||||||||||||||||||||||||||||||||||||||||||||||||||||||||||||||||||||||||||||||||||||||||||||||||||||||||||||||||||||||||||||||||||||||||||||||||||||||||||||||||||||||||||||||||||||||||||||||||||||||||||||||||||||||||||||||||||||||||||||||||||||||||||||||||||||||||||||||||||||
Not applicable. |
||||||||||||||||||||||||||||||||||||||||||||||||||||||||||||||||||||||||||||||||||||||||||||||||||||||||||||||||||||||||||||||||||||||||||||||||||||||||||||||||||||||||||||||||||||||||||||||||||||||||||||||||||||||||||||||||||||||||||||||||||||||||||||||||||||||||||||||||||||||||||||||||||||||||||||||||||||||||||||||||||||||||||||||||||||||||||||||||||||||||||||||||||||||||||||||||||||||||||||||||||||||||||||||||||||||||||||||||||||||||||||||||||||||||||||||||||||||||||||||||||||||||||||||||||||||||||||||||||||||||||||||||||||||||||||||||||||||||||||||||||||||||||||||||||||||||||||||||||
| 6.6.1. Data revision - average size | ||||||||||||||||||||||||||||||||||||||||||||||||||||||||||||||||||||||||||||||||||||||||||||||||||||||||||||||||||||||||||||||||||||||||||||||||||||||||||||||||||||||||||||||||||||||||||||||||||||||||||||||||||||||||||||||||||||||||||||||||||||||||||||||||||||||||||||||||||||||||||||||||||||||||||||||||||||||||||||||||||||||||||||||||||||||||||||||||||||||||||||||||||||||||||||||||||||||||||||||||||||||||||||||||||||||||||||||||||||||||||||||||||||||||||||||||||||||||||||||||||||||||||||||||||||||||||||||||||||||||||||||||||||||||||||||||||||||||||||||||||||||||||||||||||||||||||||||||||
[Not requested] |
||||||||||||||||||||||||||||||||||||||||||||||||||||||||||||||||||||||||||||||||||||||||||||||||||||||||||||||||||||||||||||||||||||||||||||||||||||||||||||||||||||||||||||||||||||||||||||||||||||||||||||||||||||||||||||||||||||||||||||||||||||||||||||||||||||||||||||||||||||||||||||||||||||||||||||||||||||||||||||||||||||||||||||||||||||||||||||||||||||||||||||||||||||||||||||||||||||||||||||||||||||||||||||||||||||||||||||||||||||||||||||||||||||||||||||||||||||||||||||||||||||||||||||||||||||||||||||||||||||||||||||||||||||||||||||||||||||||||||||||||||||||||||||||||||||||||||||||||||
|
||||||||||||
| 7.1. Timeliness | ||||||||||||
First survey results were published on 07 July 2020. Micro data were sent to Eurostat on 07 July 2020. The publication with detailed survey results was submitted to the printing unit at the end of November 2020 and will be printed out at the beginning of 2021. The reasons for the delays from the scheduled deadlines are complex:
|
||||||||||||
| 7.1.1. Time lag - first result | ||||||||||||
18 months |
||||||||||||
| 7.1.2. Time lag - final result | ||||||||||||
18 months |
||||||||||||
| 7.2. Punctuality | ||||||||||||
|
||||||||||||
| 7.2.1. Punctuality - delivery and publication | ||||||||||||
7 days delay |
||||||||||||
|
|||
| 8.1. Comparability - geographical | |||
There are not differences between national concepts and European concepts as regard the definition of statistical units, the reference population, classifications and definitions of variables in the transferred results. |
|||
| 8.1.1. Asymmetry for mirror flow statistics - coefficient | |||
Not applicable. |
|||
| 8.2. Comparability - over time | |||
The comparability over time is influenced mainly by changes in definitions, coverage, and methods as a result of amendments of Community legislation. The only change was undertaken by NSI after SES2002 that influences comparability between the other rounds of the SES is the extension of coverage of the survey to the enterprises with 1 or more employees. By recommendation of Eurostat NSI performed comparisons between SES2006, SES2010, SES2014, and SES2018 as regards three different structures: share of employees with less than 30 weeks during reference year; share of women; share of part-time employees; please consult attached file.
Annexes: cross vintage comparison |
|||
| 8.2.1. Length of comparable time series | |||
2006,2010,2014,2018 |
|||
| 8.3. Coherence - cross domain | |||
By recommendation of Eurostat NSI performed comparisons between the SES2018 data and annual data from LFS as regards three different dimensions: total number of employees (Figure "Number of employees in LFS and SES in 2018 by NACE Rev. 2 sections"); share of women (Figure "Share of women in LFS and SES in 2018 by NACE Rev. 2 sections"); share of part-time employees (Figure "Share of part-time employees in LFS and SES in 2018 by NACE Rev. 2 sections"). Comparisons are made for enterprises with 1 or more employees. The two sources have many methodological and conceptual differences that explain the disparities in levels and distributions of the compared variables. Some of the reasons for differences in the total number of employees by NACE sections are:
Number of employees in LFS and SES in 2018 by NACE Rev. 2 sections The greater differences in the share of women between the two sources are in sections O and M (see Figure "Share of women in LFS and SES in 2018 by NACE Rev. 2 sections"). The different share of women in section O is due to exclusion from SES of military forces and police which are male-dominated activities. In section M the absolute numbers of female employees in LFS and SES are relatively similar but the total employment in LFS is 11% lower which could be due to differences in the codification of economic activity between both surveys. See attached file: Number of employees in LFS and SES in 2018 by NACE Rev 2.
Share of women in LFS and SES in 2018 by NACE Rev. 2 sections The relative share of part-timers in SES is significantly higher for the total B to S and all NACE sections (see Figure "Share of part-time employees in LFS and SES in 2018 by NACE Rev. 2 sections"). This might be explained by the fact that some employers only formally employ persons to part-time contracts (to cut down labour costs on social security contributions) but in reality, employees work as full-timers. The LFS has captured this process where respondents are employees who report themselves their status as regards working time. See attached file: Share of women in LFS and SES in 2018 by NACE Rev. 2 sections.
Share of part-time employees in LFS and SES in 2018 by NACE Rev. 2 sections See attached file: Share of part-time employees in LFS and SES in 2018 by NACE Rev. 2 sections Annexes: Number of employees in LFS and SES in 2018 by NACE Rev 2 Share of women in LFS and SES in 2018 by NACE Rev 2 Share of part-time employees in LFS and SES in 2018 by NACE Rev. 2 |
|||
| 8.4. Coherence - sub annual and annual statistics | |||
Not applicable. |
|||
| 8.5. Coherence - National Accounts | |||
On the figure below is presented comparison between 'Average annual earnings' from SES and 'Wages and salaries' from National Accounts (NA) in 2018 by NACE Rev.2 sections. Values of annual earnings from SES for total B to S and in almost all of the NACE sections are lower than the corresponding values of wages and salaries from NA, except for sections C and E. Although the definitions of the compared variables are similar the two sources have many methodological and conceptual differences that explain the disparities in levels of earnings. Among the main reasons are:
See attached file: 'Average annual earnings' from SES and 'Wages and salaries' from NA in 2018 by NACE Rev.2 sections
Annexes: 'Average annual earnings' from SES and 'Wages and salaries' from NA in 2018 by NACE Rev.2 |
|||
| 8.6. Coherence - internal | |||
Indicators within the data set are internally coherent. |
|||
|
|||
| 9.1. Dissemination format - News release | |||
None. |
|||
| 9.2. Dissemination format - Publications | |||
Specialized publication “Structure of Earnings 2018” containing methodology, review of the main results, graphs and detailed table results was prepared for publishing on paper and CD-ROM. The publication is bilingual – in Bulgarian and English language. It is planned to upload the electronic publication on Internet. |
|||
| 9.3. Dissemination format - online database | |||
On the internet site of NSI are uploaded most important table results together with detailed methodological notes in the Bulgarian and English languages - section “Labour market”, domain “Structure of Earnings”: https://www.nsi.bg/en/content/4032/structure-earnings-%E2%80%93-national-level-4-year-periodicity |
|||
| 9.3.1. Data tables - consultations | |||
[Not requested] |
|||
| 9.4. Dissemination format - microdata access | |||
Access to the anonymised micro data is granted according to the Rules for granting access to anonymised micro-data for scientific and research purposes set by NSI. |
|||
| 9.5. Dissemination format - other | |||
Each of the respondents was informed in the dispatch note for the possibility to receive for free standard results from the SES. At about 100 sampled units expressed their will to receive results. The information is sent on a CD-ROM. |
|||
| 9.6. Documentation on methodology | |||
Detailed methodological notes are published on Internet in the Bulgarian and English languages - section “Labour market”, domain “Structure of Earnings”: https://www.nsi.bg/sites/default/files/files/metadata/Labour_Method_4.2_2018_EN.pdf . |
|||
| 9.7. Quality management - documentation | |||
[Not requested] |
|||
| 9.7.1. Metadata completeness - rate | |||
100% |
|||
| 9.7.2. Metadata - consultations | |||
[Not requested] |
|||
|
|||
[Not requested] |
|||
|
|||
| 11.1. Confidentiality - policy | |||
· Law on Statistics (Statistics Act); · Regulation (EC) No 223/2009 on European statistics (recital 24 and Article 20(4)) of 11 March 2009 (OJ L 87, p. 164), stipulates the need to establish common principles and guidelines ensuring the confidentiality of data used for the production of European statistics and the access to those confidential data with due account for technical developments and the requirements of users in a democratic society. |
|||
| 11.2. Confidentiality - data treatment | |||
Individual data are not published according to Art. 25 of Statistics Act. Dissemination of individual data is performed only according to Art. 26 of the Statistics Act. |
|||
|
|||
None. |
|||
|
|||
|
|||