|
 |
|
| For any question on data and metadata, please contact: Eurostat user support |
|
|||
| 1.1. Contact organisation | ROMANIA - NATIONAL INSTITUTE OF STATISTICS (INS) |
||
| 1.2. Contact organisation unit | Demography and Social Statistics Population and External Migration Statistics Wages, Labour Cost, Job Vacancies and Education Statistics |
||
| 1.5. Contact mail address | National Institute of Statistics (INS) 16 Libertăţii Avenue., Bucharest, District 5, ROMÂNIA |
||
|
|||
| 2.1. Data description | |||
Structure of earnings survey (SES) is carried out every four years, as a business statistical survey, having as reference periods month October and calendar year. SES was implemented and carried out for the first time in 2002. The main objective of the survey is to provide information on the number of employees, average hourly, monthly and annual earnings, working time. Indicators derived from the survey are available in different forms of aggregation, by demo-economic characteristics: gender, age, economic activity, size class of enterprises, ownership, legal status, groups of occupations, level of education, length of enterprise, duration and type of working program. The survey tools design is done in accordance with the recommendations and standards of the European Union under the European Parliament and Council Regulation no 530/1999 concerning structural statistics on earnings and labour costs and Commission Regulation no 1738/2005 amending Commission Regulation no 1916/2000 as regards the definitions and transmission of information on the structure of earnings. The survey makes available to the users essential data on hourly, monthly and annually earnings, with multiple possibilities of correlation and structuring after different demo-socio-economic characteristics, comparability across EU countries. The survey organization and data processing is performed every four years in order to develop and fulfil the national statistical information necessary for developing strategies and policies on remuneration and to ensure comparability of statistical indicators provided by all EU countries. |
|||
| 2.2. Classification system | |||
Standard classifications used:
|
|||
| 2.3. Coverage - sector | |||
Structure of Earnings Survey covers all economic sectors (section A to S, except section T according to NACE rev.2). |
|||
| 2.4. Statistical concepts and definitions | |||
The concepts and definitions of Structure of Earnings Survey 2014 variables were developed and adopted in accordance with European standards (Commission Regulation (EC) no 1738/2005 amending Regulation (EC) No 1916/2000 as regards the definition and transmission of information on the structure of earnings), but also taking into account the national legislation and features. |
|||
| 2.5. Statistical unit | |||
The unit of selection was the enterprise defined according to the communitarian rules for enterprises statistics as: “the smallest combination of legal units that is an organisational unit producing goods or services, which benefits from a certain degree of autonomy in decision-making, especially for the allocation of its current resources. An enterprise carries out one or more activities at one or more locations. An enterprise may be a sole legal unit”. The sampled enterprises provided data for sampled employees belonging to different local units. |
|||
| 2.6. Statistical population | |||
The Romanian Business Register was designed and implemented based on the administrative files (REGIS, which is the Fiscal Register, updated annually) and statistical sources in addition (Trade Register, Balance Sheet files, VAT files, feedback from other surveys, used as consultation data sources for improving the quality of the register data). According to the Council Regulations, REGIS contains the following types of statistical units: legal unit, enterprise, and local unit. All the enterprises having the main activity in the section A to S of NACE Rev.2, whatever their size (number of employees or turnover) are covered. The Romanian Business Register contains all enterprises, authorities and organisations as well as their local units in Romania that carry out any economic activity irrespective of their size or if they belong to the private or public sector. There are covered the following institutional sectors:
In respect to the budgetary institutions and public administration REGIS is the most complete register in Romania, based on Official Journal and the collaboration with many administration institutions. |
|||
| 2.7. Reference area | |||
Structure of Earnings Survey data are available and published at the national level (NUTS0). The micro data files transmitted to Eurostat are coded at NUTS1 level (as the regulation requests). |
|||
| 2.8. Coverage - Time | |||
Structure of Earnings Survey data are available every four years, starting with 2002, for the reference month (October) and for the entire reference year (2002, 2006, 2010 and 2014). |
|||
| 2.9. Base period | |||
Not the case. |
|||
|
|||
| 3.1. Source data | |||
Structure of earnings survey is a business statistical survey. |
|||
| 3.2. Frequency of data collection | |||
Structure of earnings survey is carried out every four years since 2002. |
|||
| 3.3. Data collection | |||
The method used for Structure of Earnings Survey data collection was self-registration on paper questionnaires (posted on the INS website) or on electronic questionnaire (in Excel) provided by INS (through the territorial statistical offices) to the respondent units, by request. TheStructure of Earnings Survey questionnaire was structured in two parts: Part A – information related to the enterprise (and where applicable, to the local units) and Part B – information relating to each employee in the sample. The variables in Part B were grouped into three chapters: B1 – demo-economic characteristics of the employees, B2 – the working time and the gross amounts corresponding to month October 2014, B3 – the working time and the gross amounts corresponding to whole year 2014. Detailed explanatory notes were annexed, containing: the scheme needed for the selection of the sample of employees, the definitions of the variables, the classifications of occupations (ISCO-08 at 4 digits level) and the classification of educational level (ISCED 2011). In the explanatory notes provided to the respondents there were references for all collected variables. The Electronic questionnaire was designed in Microsoft Excel in accordance with the one on paper, but logical tests were included. Data collection was made by post or e-mail to the territorial statistical offices. The majority of the respondents (86%) preferred to answer by post, using paper questionnaires. Structure of Earnings Survey is the only Romanian survey collecting the information at employee level. Generally, the respondents were guided by the statisticians from the territorial statistical offices and in some cases, even assisted by them in how to fill in the questionnaires. |
|||
| 3.4. Data validation | |||
Structure of Earnings Survey data were validated at entry (in Excel file or IT application), by the territorial statistical offices and INS headquarters level. The IT application for data entry and validation was used to find all errors and non-correlations occurred during data collection and/or data entry. The IT solution for Romanian SES was accomplished using Visual Fox and divided into two components:
The IT solution at local level allowed the data entry and validation at each county level (42 counties in total – NUTS3 level). The IT solution at central level contained the IT programs for:
Individual hourly, monthly and annually earnings were compared by occupations, levels of education, age and length of service within the selected employees of the same enterprise. Basic salaries were compared with the minimum wage guaranteed by the national legislation in force. The basic salaries which were below the minimum wage were not accepted for the employees working full-time or the corresponding proportion from the minimum wage for the employees working part-time. Monthly and annually earnings were correlated for each employee. An estimation of the annual earnings was made, taking into account the period worked during the year. This estimation was compared with the reported annual data. No more than ±30% difference was accepted between the annual earnings and monthly earnings multiplied by the number of months actually worked. In cases above or below limits, the respondent units were contacted and asked for corrections or explanations. The gross monthly earnings could differ from a month to another due to different financial and working conditions (i.e. break off work for technical or economic reasons, cancellation or new orders, plant breakdowns or raw materials shortage, financial difficulties or technical reasons etc.), which implies annual earnings much different than the one earned in the representative month (October) multiplied by the number of months actually worked. The average monthly earnings aggregated by economic activities and by ownership type and financial control of the enterprises were compared with the same indicator from other two surveys – Labour costs survey 2014, Monthly wages and salaries survey (for month October 2014). For differences more than ±30% data were analysed starting from the employee level and corrected upon the case. The average monthly earnings were checked taking into account the working program of the employees (full-time/part-time). The average annual earnings were checked taking into account the working program of the employees (full-time/part-time) and the period actually worked during the year. The distribution of employees by major groups of occupation was compared, for the common respondent units, with the same distribution from the Job vacancy survey for the 4th quarter 2014. Some problems were caused by the manner of sample selection of the employees by the respondent units. The problems occurred not for the sample size, but for the rule of respecting as much as possible the distribution of the employees of the sample (by sex, occupation groups and working program), as the distribution of the total number of employees of the respondent unit (by sex, occupation groups and working program). |
|||
| 3.5. Data compilation | |||
After validation, Structure of Earnings Survey data were analysed and corrected where necessary. In order to provide more accurate and reliable data comparisons among variables and/or with other data sources were made. At national level Structure of Earnings Survey data were tabulated using Excel pivot tables. For micro data transmission to Eurostat automatic codification of the national variables into the standard format was used. |
|||
| 3.6. Adjustment | |||
For the sampled employees who had periods of unpaid absence during the reference month, their earnings were adjusted to a full month's basis, according to the recommendations from "SES 2014 Implementing arrangements". |
|||
|
|||
| 4.1. Quality assurance | |||
The quality of the Structure of Earnings Survey data is guaranteed in accordance with the ESS Code of Practice for each stage of the survey organisation and carrying out. The questionnaire design, the detailed explanatory notes (including annexes of ISCO-08 and ISCED-2011) and the IT solutions developed had as result complete and of good quality data. |
|||
| 4.2. Quality management - assessment | |||
All the standard statistical quality criteria are met (i.e. users’ needs satisfied based on data usefulness and timeliness; various dissemination formats and breakdowns; national and Eurostat dissemination timetable respected). |
|||
|
|||
| 5.1. Relevance - User Needs | |||
Summary of core users The main Structure of Earnings Survey data users may be grouped as following: (i) internal users:
(ii) external users:
Description of users needs The Structure of Earnings Survey provides to the users important data on hourly, monthly and annually earnings, on working time, as well as on the structure of earnings. The survey results are available by multiple breakdowns on demo-socio-economical characteristics of the employees: gender, age groups, occupational groups, level of education, length in the enterprise, type and duration of the working time, economic activities, size classes of the enterprise, ownership forms. SES is the only survey conducted at employee level, providing such amount of complex information. Through the SES results the users can find the answers to diverse questions such as:
(i) internal users: The Structure of Earnings Survey outcomes, in relation with the information provided by other surveys, are used by policy makers at national level in establishing the actions and measures for economic development strategies as well as for implementing programs on active measures aimed to improve the employability and as for setting up the policies on wages and salaries.
(ii) external users:
|
|||
| 5.2. Relevance - User Satisfaction | |||
(i) internal users: In Romania, official statistics is under the responsibility of National Institute for Statistics (INS). In order to ensure the objective and the transparent and scientific character of the methodologies, indicators and classifications used in statistics, the Council of Coordinating the Statistical Activity was set-up. The Council is composed of representatives of:
The representatives of the Council meet quarterly or more frequently when is necessary, in working groups by statistical fields. During these meetings INS receives a strong feed-back from the users in terms of the results already disseminated (including the level of details, breakdowns etc.) and the requests for further needed information to be included in next statistical inquiries. Before finalising the survey tools and launching any survey on wages and labour costs, INS usually consults its main users (Ministry of Labour, Family, Social Protection and Elderly Persons, Ministry of Public Finances, National Commission for Prognosis, research institutes and universities etc.) and asks for methodological approval given by the “Commission of Methodological Approval”. The Structure of Earnings Survey questionnaire, explanatory notes and annexes with classification were submitted for approval when first launched in 2002. Because no major changes occurred for the 2006, 2010 and 2014 surveys, no other methodological approval was needed. (ii) external users:
|
|||
| 5.3. Completeness | |||
According to the Commission Regulation no 1738/2005 amending Regulation (EC) no 1916/2000, all UE member states had to conduct the Structure of Earnings Survey in 2014, collecting and providing to Eurostat a number of 34 variables (mandatory and optional). Romania collected and provided 26 mandatory variables (100% mandatory variables) and 7 optional variables (88% from all optional variables), meaning 97% of all variables requested by the Commission Regulation. The only optional variable not collected was “1.7 Affiliation of the local unit to a group of enterprises”. Apart from the variables requested by the CR, Romania introduced a number of variables for national purposes:
Information collected and provided by Romania answered to Eurostat requests in terms of classifications and breakdowns:
The variables collected and provided by Romania answer to all Commission Regulation requirements, for data transmission:
No compulsory breakdown, in terms of economic activities or size classes, is missing from the Structure of Earnings Survey 2014. Furthermore, data for NACE Rev.2 section A (which is not requested by the regulation) and for section O (which continues to be optional according to the regulation) were collected and provided by Romania. The selection of the employees in the sample was complex, done by each enterprise according to the rule recommended by INS of respecting the proportionality by sex, major groups of occupation and working program of the total number of employees of the enterprise. Thus, a clearer image of the distribution of employees from the whole enterprise was reflected by the selected sample. Even though the Structure of Earnings Survey is a complex survey, considered by the respondent units a burden, since a lot of detailed and complex information for each selected employee was asked, the response rate[2]was rather high (88.94%, refusal rate 5.91%) [1] Compared with 2002, in 2006, 2010 and 2014 apprentices were covered by national legislation in force [2] Including: units that responded, dormant units, other unit responded and other events (merger, absorption) |
|||
| 5.3.1. Data completeness - rate | |||
100%. The Structure of Earnings Survey is based on a stratified sample of enterprises instead of local units due to the fact that the Business Register is not built at local unit level. The sample of employees was selected from local units belonging to the selected enterprises according to the algorithm of selection indicated in the methodological notes, part of the survey tools. |
|||
|
|||
Detailed description in the following items: |
|||
| 6.1. Accuracy - overall | |||
Detailed description in the following items. |
|||
| 6.2. Sampling error | |||
The coefficients of variation for the key variables for the total population are:
|
|||
| 6.2.1. Sampling error - indicators | |||
The coefficients of variations requested through the Commission Regulation No. 698/2006 are presented in the attached document RO_Coefficients of variation. The computations of CVs were produced using the variance programme CLAN, a SAS macro provided by Swedish statistics. Except for the setting-up of the frame population, no data from registers were used. Annexes: RO_Coefficients of variation |
|||
| 6.3. Non-sampling error | |||
Detailed description in the following items. |
|||
| 6.3.1. Coverage error | |||
The sampling frame used to draw the sample was built using the Romanian Business Register and contained the statistical information related to the reference period, namely the calendar year of 2014. As consequence the main over/under coverage problems are related to the information quality concerning size class of enterprises by number of employees. In the weighting and adjustment process the unidentified units were assimilated to that of the non-respondent units The weighting procedures applied at enterprise level was done in order to compensate the total non-response, together with the calibration procedures applied at NACE. Rev. 2 division and with information on active enterprise in 2014. The auxiliary variable used for calibration was the number of employees (according to Labour Cost Survey). The calibration was produced also with the routine of the CLAN programme provided by Swedish statistics. In the table in the attached document RO_Misclassification are presented the measure of misclassifications by size classes by number of employees and NACE Rev.2 category to 1-digit level (section). Annexes: RO_Misclassification |
|||
| 6.3.1.1. Over-coverage - rate | |||
A percentage of 0.33% of surveyed enterprises reported a number of employees less than the limit threshold for including criteria in the reference population (at least 10 employees) but the stability of activity is at high level (over 90%). In the meantime it encounters the existence of a 1.91% of unidentified enterprises. In the adjustment procedure the unidentified enterprises were assimilated to the non-response units. |
|||
| 6.3.1.2. Common units - proportion | |||
All units covered by the statistical survey report information in the administrative sources in accordance with the scope of these sources. |
|||
| 6.3.2. Measurement error | |||
The information given below refers only to the errors and cases corrected at central level (INS), after the data files were received from all over the country. Statistics on the first level of checking (local level) are not available. One error might need several variables to be corrected or, if the figures correspond to reality due to unusual phenomena, figures were accepted as such and no changes were operated. Most frequent errors that occurred during data checking period:
The number of cases needed to be corrected was not so significant to have an impact on the accuracy of the final results. In the table in the attached document RO_Measurement erorrs are presented the percentages of cases corrected at central level by each variable. For the microdata transmitted to Eurostat the plausibility checks were applied and different inconsistencies explained. Not all the “plausibility checks” were fulfilled, but the number of these cases is not significant (all of these cases representing about 1.2% from the total number of records):
Annexes: RO_Measurement errors |
|||
| 6.3.3. Non response error | |||
The treatment of non-response is performed only for the first sampling phase (i.e. to the primary sampling unit level which is the enterprise) and is regarding to the survey status of enterprises and its response. The non-response type used to the collection data phase is presented in the attached document RO_Non-response rates. The enterprises that reported 9 employees or less were considered out of scope units. To perform the adjustments of out of scope units by weighting procedure a model assumption was used. These assumptions are made for each stratum (to first sampling phase level) and are:
Annexes: RO_Non-response rates |
|||
| 6.3.3.1. Unit non-response - rate | |||
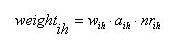
The non-response rates broken down by economic activity (NACE Rev.2 division and section level) and by size classes are presented in the attached document RO_Non-response rates (see the document attached at 6.3.3). The estimation procedure is performed in two phases, corresponding to the two sampling phases i. To the first sampling phase (i.e. to the primary sampling unit level which is the enterprise) The estimation procedure involves the multiplying of the value for each sampled business (yi) by a combination of weights, one being outlier weight (wih), one resulting from the sample design (aih) and one being the non-response adjustment (nrih). An outlier weight is computed as a Windsor weight. The normal score used to set the outlier units is computed taking into account the stratification used in sample design corresponding to the first sampling phase. The adjustment of the non-response is performed by the inverse of response probability and taking into account the stratification used in the sampling design. The overall non-response rate is about 9%. So, for each response primary unit the final weigh is
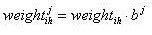
where “i” is the primary sampling unit index and “h” the stratum index. ii. To the second sampling phase (i.e. to the secondary sampling unit level which is the employee) The final weight of the employee is given by multiplying the inverse of selection probability of the employee (bj), computed separately by gender (men and women), with the enterprise final weight (weightih). So,
where “j” is the employee index. |
|||
| 6.3.3.2. Item non-response - rate | |||
Items of partial non-response were sent back to the respondent units for filling in the whole information. No item non-response was accepted. |
|||
| 6.3.4. Processing error | |||
About 200 logical tests and correlations were performed for data checking. Logical tests were focused on key variables such as: sex, date of birth, occupation, management/supervisory position, education level, type of contract, number of hours paid, monthly gross amounts paid, individual contributions, annual gross amounts paid, number of annual days of absence (holidays, sick leave, special events, vocational training). The correlations were focused on:
Also, the checks focused on:
Same tests were conducted at local level (territorial statistical offices) as well as at central level (INS). The largest part (about 75%) of the errors found was solved at local level. The figures were corrected after re-contacting the corresponding respondents. Furthermore, the same global and plausibility checks as described in the “SES 2014 Implementing arrangements” were applied for the microdata sent to Eurostat. Where the tests not passed, explanatory notes were provided at data transmission (see point 6.3.2). |
|||
| 6.3.4.1. Imputation - rate | |||
No imputations applied. |
|||
| 6.3.5. Model assumption error | |||
In Romania fiscal year fully corresponds to calendar year. No adjustment of this kind was necessary to be made. Romanian SES covered all enterprises irrespective of the economic activity performed and having 10 employees and over. According to Eurostat arrangements for implementing the Council Regulation no.530/1999 and the Commission Regulation no. 1738/2005, Romania provided data for:
No combinations between survey data and register data have been undertaken. All data are obtained from the survey. |
|||
| 6.4. Seasonal adjustment | |||
Not the case. |
|||
| 6.5. Data revision - policy | |||
Not the case. |
|||
| 6.6. Data revision - practice | |||
Not the case. |
|||
| 6.6.1. Data revision - average size | |||
Not the case. |
|||
|
|||
| 7.1. Timeliness | |||
All the activities carried out by INS during a year are scheduled through the Activity Plan with several months in advance. Annually, INS issues for the users a catalogue of statistical products and services containing the names, periodicity, short descriptions and release dates for all publications. The length period of preparing, carrying out and publishing of the final results for Structure of Earnings Survey 2014 lasted about 24 months (from November 2014 to the end November 2016), as described in the attached document RO_Timeliness. Annexes: RO_Timeliness |
|||
| 7.1.1. Time lag - first result | |||
Transmission of Structure of Earnings Survey 2014 final results: 07.06.2016. |
|||
| 7.1.2. Time lag - final result | |||
Transmission of Structure of Earnings Survey 2014 final results: 07.06.2016. |
|||
| 7.2. Punctuality | |||
The data collection period for Structure of Earnings Survey 2014 was lasted about 3.5 months:
Thus, the deadline for receiving the files from territorial statistical offices was 11th May 2015. Since not all enterprises respected the deadline requested, a high proportion of questionnaires were received with delay by the territorial statistical offices. Furthermore, due to the recalls necessary for additional information and corrections of the variables filled in by the enterprises, delays occurred in sending the data files to INS. Only the information on the delays encountered in receiving the data files from the territorial statistical offices to INS is available. Below are presented information on the proportion of data files sent from the territorial statistical offices and the dates when INS received them:
Thus, for the first transmission a delay of 30 days was registered between the scheduled and actual data files transmission. Also, due to several data corrections and delayed respondent units, the files from the territorial statistical offices were remanded several times. The last transmission registered was on 06.01.2016. Even so, no delays were registered into the data transmission to Eurostat or data dissemination at national level. The transmission to Eurostat of the final microdata files was in accordance with the legal requirements, as csv files, via eDAMIS, on the 7th of June 2016 (the deadline stipulated by the Council Regulation no. 530/1999 was 30 June 2012). Also, some explanatory notes were transmitted in order to justify the plausibility checks that failed for certain records. |
|||
| 7.2.1. Punctuality - delivery and publication | |||
No transmission or dissemination delays were recorded. |
|||
|
|||
| 8.1. Comparability - geographical | |||
There is no deviation between national and European concepts and definition on:
|
|||
| 8.1.1. Asymmetry for mirror flow statistics - coefficient | |||
Not the case. |
|||
| 8.2. Comparability - over time | |||
The Romanian Structure of Earnings Survey was carried out for the fourth time (with 2002, 2006, 2010 and 2014 as reference years). No significant changes in definitions, coverage or classifications (except ISCED 2011) used since the previous survey. The improvements made for SES 2014 in comparison with previous year refer only to more detailed methodological notes accompanying the survey questionnaire. Annexes: Comparability over time |
|||
| 8.2.1. Length of comparable time series | |||
The Structure of Earnings Survey data are available for the reference years 2002, 2006, 2010 and 2014. |
|||
| 8.3. Coherence - cross domain | |||
Detailed description in the following items. |
|||
| 8.4. Coherence - sub annual and annual statistics | |||
Not requested by the CR No 698/2006 implementing Council Regulation (EC) No 530/1999 as regards quality evaluation of structural statistics on labour costs and earnings. |
|||
| 8.5. Coherence - National Accounts | |||
The comparison between the gross annual earnings in the reference year, expressed per employee, shows some differences between Structure of Earnings Survey and National Account (NA), mainly due to the different coverage of the two data sources. In Structure of Earnings Survey, enterprises with less than 10 employees are excluded, while NA contains information also, for small enterprises and hidden economy. The comparison between the gross annual earnings from SES and NA is represented in the document RO_Coherence NA. Main data sources for the National Accounts, by NACE Rev 2 sections are:
For better data comparability sections A and O of NACE Rev.2 were excluded from Structure of Earnings Survey. Compared with Structure of Earnings Survey, for section K, the NA include persons with other kind of contracts (i.e. insurance agents, field agents), that are not paid from the salary founds. Also, sections N and R include in NA data on small enterprises and hidden economy. Section S include in NA accounting and financial data (i.e. wages and salaries) on trade unions, political parties and other kinds of non-profit institutions serving households etc. The NA data used to obtain gross annual earnings in 2014 are provisional data and might be modified in the final version. Annexes: RO_Coherence NA |
|||
| 8.6. Coherence - internal | |||
Not requested by the CR No 698/2006 implementing Council Regulation (EC) No 530/1999 as regards quality evaluation of structural statistics on labour costs and earnings. |
|||
|
|||
| 9.1. Dissemination format - News release | |||
The Structure of Earnings Survey 2014 data are disseminated through a press release, containing the main results, conclusions and also relevant methodological explanations (definition of the main indicators, classification used, and response rate). The press release is available on INS web-site (both in Romanian and English) for all interested users: http://www.insse.ro/cms/en/content/structure-earnings-october-and-year-2014 |
|||
| 9.2. Dissemination format - Publications | |||
The main publication of Structure of Earnings Survey results is called „Wage disparities – influences”, available only in Romanian language, structured into three parts:
The publication is available in the INS web-site (in Romanian) for all interested users: Also, the publication is disseminated and distributed to the main users:
|
|||
| 9.3. Dissemination format - online database | |||
Not available. |
|||
| 9.3.1. Data tables - consultations | |||
Not available. |
|||
| 9.4. Dissemination format - microdata access | |||
9.4. Dissemination format - microdata access According to the Eurostat dissemination rules, Structure of Earnings Survey 2014 microdata can be accessed:
http://www.insse.ro/cms/en/content/eurostat-access-microdata http://www.insse.ro/cms/en/content/nis-microdata-scientific-purposes |
|||
| 9.5. Dissemination format - other | |||
All the tables belonging to the national publication „Wage disparities – influences” are available in Excel files and can be accessed by all users. |
|||
| 9.6. Documentation on methodology | |||
Metadata and methodological notes are included in all Structure of Earnings Survey releases (press release, publication, ad hoc data requests). |
|||
| 9.7. Quality management - documentation | |||
The quality report on Structure of Earnings Survey 2014 is available on INS web-site (both in Romanian and English) and contains the same information as in the ESS MH. |
|||
| 9.7.1. Metadata completeness - rate | |||
100%. |
|||
| 9.7.2. Metadata - consultations | |||
No information is available. |
|||
|
|||
No information is available. |
|||
|
|||
| 11.1. Confidentiality - policy | |||
All statistics collected and published by INS are governed by the statistical Law no. 226/2009 regarding the organisation of official statistics, published in Romania's Official Journal First part, no. 397/11.06.2009,with further amendments. The Law specifies that: the official statistical services are authorised to ask for and receive free of charge statistical data and information from all natural and legal persons who are located on the Romanian territory, hold any kind of capital or carry out any type of activity. Also under the provision of this law, INS cannot publish, or otherwise make available to one individual or organisation, statistics that could enable the identification of data for any individual person or entity. INS has been officially recognised by the government as fully independent organisation: it decides by itself which data to collect, which methodology to use, and which results, methodological notes and commentaries are published. The most important aspects on the organisation of the official statistics in Romanian are posted on the National Institute of Statistics Internet website (http://www.insse.ro). Copies of the statistical laws are available in Romanian from the library of the National Institute of Statistics, 16, Libertatii Avenue, Bucharest, District 5. |
|||
| 11.2. Confidentiality - data treatment | |||
According to the Eurostat anonymisation criteria. |
|||
|
|||
No comments. |
|||
|
|||
|
|||