|
 |
|
| For any question on data and metadata, please contact: Eurostat user support |
|
|||
| 1.1. Contact organisation | Statistics Denmark |
||
| 1.2. Contact organisation unit | Personal Finances and Welfare |
||
| 1.5. Contact mail address | Statistics Denmark Sejroegade 11 DK-2100 Copenhagen OE |
||
|
|||
| 2.1. Data description | |||
The Structure of Earnings Survey (SES) 2014 results are based upon a comprehensive data material with approximately 2 million records covering almost the entire public sector and all private enterprises with at least 10 fulltime employees. Eurostat's implementation arrangements for the Structure of Earnings survey 2014 have been used to ensure compliance with Council Regulation 530/1999, the Commission Regulation 1916/2000 and 1738/2005. All mandatory variables have been constructed and delivered in line with the implementation arrangements. On the other hand, the data does not contain information on any optional variables. |
|||
| 2.2. Classification system | |||
Not available. |
|||
| 2.3. Coverage - sector | |||
Not available. |
|||
| 2.4. Statistical concepts and definitions | |||
Not available. |
|||
| 2.5. Statistical unit | |||
Not available. |
|||
| 2.6. Statistical population | |||
Not available. |
|||
| 2.7. Reference area | |||
Not available. |
|||
| 2.8. Coverage - Time | |||
Not available. |
|||
| 2.9. Base period | |||
Not available. |
|||
|
|||
| 3.1. Source data | |||
The most appropriate description of the Danish data used for compiling aggregates, is that it is based on a census, and thus have a large coverage. In accordance with the Act on Statistics Denmark the population covered is imposed the reporting of Earnings data. The population consist of the public sector and private enterprises with at least 10 employees. |
|||
| 3.2. Frequency of data collection | |||
Data is collected annually for both enterprises and organisations in the private sector, and public administration and services (public sector). |
|||
| 3.3. Data collection | |||
Earnings data for the public sector are mainly administrative data transmitted each month as a file from the public payroll systems to Statistics Denmarks server. Data from private enterprises are mainly also transferred from the enterprises' payroll systems to Statistics Denmark. A minority of enterprises upload their data in an excel file. |
|||
| 3.4. Data validation | |||
There are multiple steps through which data is validated along the way. The first validation happens when the data is collected. It is then checked whether the major variables, such as the main earnings component, are included in the file. The data is then transformed into the danish earnings components as published nationally. During this transformation several validation checks are being made. When the national results are ready for publishing, a seperate dataset is made available for European statistics. In this dataset all variables of relevance are checked for unrealistic values. Furthermore they are also validated by performing the global and plausibility checks put forward by Eurostat in the implementation arrangements. In other words, the data has gone through a number of validation checks along the way, which should ensure that the final data has sufficient quality. |
|||
| 3.5. Data compilation | |||
Not requested |
|||
| 3.6. Adjustment | |||
Not requested |
|||
|
|||
| 4.1. Quality assurance | |||
Not available. |
|||
| 4.2. Quality management - assessment | |||
Not requested |
|||
|
|||
| 5.1. Relevance - User Needs | |||
The main users of the Danish Earnings Statistics are researchers, private business enterprises, ministries, counties, municipalities, national organisations (employer- as well as employee organisations) and international organisations. The earnings results are widely used among all these users for different reasons. |
|||
| 5.2. Relevance - User Satisfaction | |||
The scale of coverage is at a level that is regarded as satisfying when it comes to user needs. The same is true with regards to the degree of detail in which the results are being published. The 2016 Reputation Survey of Statistics Denmark showed that Statistics Denmark in general has a high degree of user confidence among the population. 85 per cent of those who knew, or at least had heard about Statistics Denmark, trusted Statistics Denmark, while 6 per cent distrusted it. There has not been performed any survey on the satisfaction of users of earnings statistics only. The Reputation Survey is unfortunately not available for the public yet. Although there has not been performed any survey on user satisfaction on earnings specifically, the section on earnings in Statistics Denmark regularly holds meetings with the main users of earnings statistcs. The impression from these meetings is that the users in general are highly satisfied with both the national and the European structure of earnings survey. Read more about the Public Image Survey of Statistics Denmark here. |
|||
| 5.3. Completeness | |||
Not requested |
|||
| 5.3.1. Data completeness - rate | |||
Not requested |
|||
|
||||||||||||||||
The accuracy and reliability of the survey are both very good as the survey is a full-scale census covering all enterprises with more than 9 employees, as well as close to all employees working in public administration and services. |
||||||||||||||||
| 6.1. Accuracy - overall | ||||||||||||||||
Not requested |
||||||||||||||||
| 6.2. Sampling error | ||||||||||||||||
There has not been performed an estimate of the sampling error. The main reason for this is that the data is based on a census more than a sample. The sampling error is therefore considered to be very small. |
||||||||||||||||
| 6.2.1. Sampling error - indicators | ||||||||||||||||
The statistical process being a census leads to Statistics Denmark not calculating the coefficient of variation for the SES 2014. |
||||||||||||||||
| 6.3. Non-sampling error | ||||||||||||||||
Despite of being a census the accuracy is affected by different types and degrees of errors such as coverage-, measurement- and non-response errors. The margins of statistical errors are especially linked to hours of work, where the data on absence is especially affected. In addition to this, there may be errors in the periodic delimitation, which are essential to the compilation of hours worked as well as the agreed working time. However, efforts are continuously made to improve the data quality through feedback to enterprises and through update and improvement of the production systems. |
||||||||||||||||
| 6.3.1. Coverage error | ||||||||||||||||
The framework used in selecting the target population is Statistics Denmark’s Central Business Register. The Central Business Register contains information on all enterprises and local units in Denmark (covering both the private and public sector). Each enterprise is identified by means of an 8-digit registration number (CVR number), which is the same number used in the administrative registers operated by the tax authorities, etc. The local units are identified by a 10-digit local unit code number. The Central Business Register is continuously updated, which implies that there are only minor problems in achieving close to complete coverage. Information on firms and economic activity of the local units, geographical location and legal ownership is collected from the Central Business Register. Furthermore, the register contains information on total employment measured in full time units. When analysing the range of principal economic activities used in the SES 2014 the results shows about 20,000 private enterprises with at least 10 full time employees in the target population. The amount of employees in the study population private enterprises covers 81 per cent of the amount in the target population private enterprises. A measurement of the public sector coverage has not been made. |
||||||||||||||||
| 6.3.1.1. Over-coverage - rate | ||||||||||||||||
There is no measurement of over-coverage of the survey. Only units with more than 9 employees are included, all other units are sorted out. |
||||||||||||||||
| 6.3.1.2. Common units - proportion | ||||||||||||||||
Not requested |
||||||||||||||||
| 6.3.2. Measurement error | ||||||||||||||||
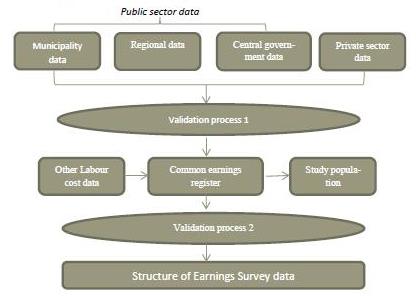
The data collection system is designed to explore the potentials of the latest computer technology for efficient and rational collection and reporting of data. In this respect, a Standard for Electronic Statistical Reporting has been developed, which is used by computer agencies and respondents utilising standard systems and by business enterprises which have set up a wage system. In addition to this, Statistics Denmark also offers an electronic questionnaire (an excel file for the enterprises to type data in), that can be uploaded through a webpage. The data reported to Statistics Denmark, which form the basis for the SES, have been collected annually since 1994, and since then Statistics Denmark has systematically contacted business enterprises in cases where they have reported inadequate or erroneous data to Statistics Denmark. This continuous contact with business enterprises has improved data reports.
Process flow leading to Structure of Earnings Survey data
Validation process 1 ensures that the data of the study population fulfill some of the most basic data quality and coding requirements. After validation process 1, the amount of data has been reduced with about 10 percent. The study population used for the SES 2014 is still erroneous despite validation process 1. This is due to the various limitations set by plausibility checks and conversions between formats which are implemented through the following SES 2014 production process. In addition, some of the variables that are essential in the European SES, is less important in the national SES, and therefore errors in these are not fully scrutinized during process 1. Of the study population after the first process of validation, 11 percent is deleted as a consequence of validation process 2. The table below outlines the six most common measurement and processing errors during validation process 2 as a percentage of the study population after process 1. It is important to keep in mind that a single record can contain more than one error and thus add to the percentage count of more than one type of measurement error. Due to these reasons it is not possible to summarize the percentages in order to reach the 11 per cent erroneous data.
Measurement and processing errors
|
||||||||||||||||
| 6.3.3. Non response error | ||||||||||||||||
The Act on Statistics Denmark makes it statutory for enterprises with at least 10 employees to report earnings statistics to Statistics Denmark. If Statistics Denmark doesn’t receive data from a target population enterprise they are legally justified to impose a fine on the enterprise not reporting data. Nevertheless not all enterprises report their earnings statistics either consciously or do to reasons that exempt them from reporting. Almost all the units to which statistics Denmark has made contact, for the purpose of making use of the enterprise or local unit’s earnings and absence data, submit information at some point. As a consequence the non-response error is found to be very low. |
||||||||||||||||
| 6.3.3.1. Unit non-response - rate | ||||||||||||||||
Not requested |
||||||||||||||||
| 6.3.3.2. Item non-response - rate | ||||||||||||||||
Not requested |
||||||||||||||||
| 6.3.4. Processing error | ||||||||||||||||
Although processing errors may occur, especially in relation to the transfer of data between systems, there has not been an overall measurement of the extent of processing errors. |
||||||||||||||||
| 6.3.4.1. Imputation - rate | ||||||||||||||||
There is no imputation done on observations, only on some of the variables included in the survey. The imputation rate of these variables vary. |
||||||||||||||||
| 6.3.5. Model assumption error | ||||||||||||||||
Statistics Denmark collects earnings data for a full year when it comes to the private sector and on a monthly basis for the public sector. In order to combine the two data sources, the earnings data are put together in the Common Earnings register which primarily contain yearly figures. As a consequence Statistics Denmark is not directly able to differentiate between different months. In order to provide EUROSTAT with the variables measured in relation to the reference month some assumptions must be made.
One employee – multiple records Statistics Denmark collects data from salary systems used by the target population enterprises. If there is a change in the employee information (fx B23 (ISCO) or (B28)) a new collection of data considering that employee will be initiated. One employee may thus appear in the dataset multiple times within a given year. As an example let’s say that an employee halfway through the year decides to change to another local unit within the same enterprise and work there for the rest of the year. Because of this change of local unit the employee will be counted twice in the dataset. In this example the two records will have the same grossing up factor and the number of weeks to which the gross annual earnings relate (B31) is 26.07 weeks in both cases. When measuring the amount of people working less than 30 weeks in the reference year the person in the above mentioned example will count twice. The data from Denmark should therefore not be used in such a comparison between countries.
Reference month A common benchmark is the reference month which is constructed on basis of the employees working period. The working period of the employee to which the gross annual earnings relate are given in variable B31 (number of weeks to which the gross annual earnings relate). This variable is constructed on the basis of information in the earnings data. B31 is then used when calculating the number of months in which the gross annual earnings relate by applying the following formula [3.1] where 4,345 is the average number of weeks per month in a full year (52,14/12). By applying this formula some observations in the dataset have a [3.1] which is less than 1. This can cause problems when calculating various variables. This will be outlined below. Number of hours paid during the reference month (B32) In the Common Earnings Register (target population) data the number of hours paid are given in yearly amounts. In order to provide the number of hours paid during the reference month, the yearly amounts are split equally throughout the year of employment, hence [3.2] When the earnings data and number of paid hours per year is related to a working period of less than a month (3.1<1), then B32 may turn out to be greater than “paid hours per year”. In these cases B32 reflects the number of paid hours during the reference month as if the person has worked a full year.
Earnings related to overtime in the reference month (B421) The earnings related to overtime are given in yearly amounts in the Common Earnings Register. In order to calculate the earnings related to overtime in the reference month (B421) the following method has been used [3.3] The same implication which may arise when calculating B32 by dividing paid hours per year with [3.1] may arise when calculating earnings related to overtime. Hence, monthly earnings related to overtime may in some cases exceed the yearly earnings related to overtime (only if 3.1<1).
Special payments for shift work in the reference month (B422) The earnings related to special payments for shift work are given in yearly amounts in the Common Earnings Register. In order to calculate the earnings related to overtime in the reference month (B422) the following method has been used [3.4] The same implication which may arise when calculating B32 by dividing paid hours per year with [3.1] may arise when calculating earnings related to special payments for shift work. Hence, monthly earnings related to special payments for shift work may in some cases exceed the yearly earnings related to overtime (only if 3.1<1).
Full-time or part-time employee (B27) There exists no information about the degree of full-time or part-time employment ship in the Common Earnings Register. In order to give a meaningful indication of this and in order to calculate the percentage share of a full-timer’s normal hours (variable B271) Denmark has adopted the following assumption: [3.5] A person is: Full-time employed if hours worked per week ≥ 29, 91 Part-time employed if hours worked per week <29, 91
Collective pay agreement (A15) Statistics Denmark collects data for a sample called Other Labour Costs. The data in this sample are being used to estimate the degree of collective pay agreement for the local unit. This is possible because the sample is randomly drawn from a representative population representing the enterprise structure in Denmark. Firstly the following conditions apply. Local units and enterprises which are members of either DA (The Confederation of Danish Employers) of FA (The Danish Employers’ Association for the Financial Sector) are all covered by a collective agreement at an industry level (code B). This is also the case with local units and enterprises in the public sector. The remaining earnings data primarily collected by Statistic Denmark has to be subject to estimation of variable A15 on the basis of information from the Other Labour Cost survey. In order to estimate the degree of collective pay agreement for the remaining data the following assumptions are made
It should be noted that in the case of SES 2014, the information on collective pay agreement is from the Other Labour Costs survey of 2015. This should not have a major implication on the results, as collective pay agreements generally do not change much over the years. |
||||||||||||||||
| 6.4. Seasonal adjustment | ||||||||||||||||
Not requested |
||||||||||||||||
| 6.5. Data revision - policy | ||||||||||||||||
Not requested |
||||||||||||||||
| 6.6. Data revision - practice | ||||||||||||||||
Not requested |
||||||||||||||||
| 6.6.1. Data revision - average size | ||||||||||||||||
Not requested |
||||||||||||||||
|
|||
| 7.1. Timeliness | |||
The initial results on national level where published on 28. September 2015. The gap between the end of the reference year and the date of publication is thus approximately 9 months. For the European SES the data was published in august 2016, which means that there was a gap here of about 20 months. |
|||
| 7.1.1. Time lag - first result | |||
Not requested |
|||
| 7.1.2. Time lag - final result | |||
Not requested |
|||
| 7.2. Punctuality | |||
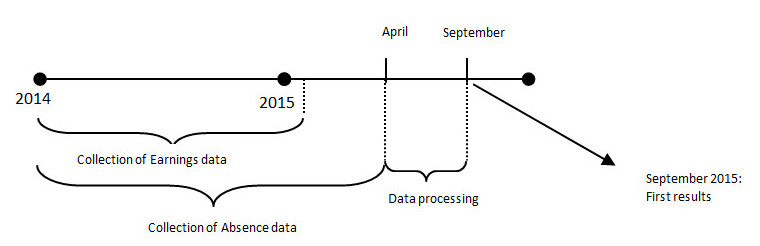
The public sector earnings data for 2014 was collected on a monthly basis beginning January 2014 ending December 2014. There is a 1 month time-lag when collecting and receiving public sector data. Hence, data concerning January 2014 is available February 2014. Figure 4.1 Public Sector (Local and central government)
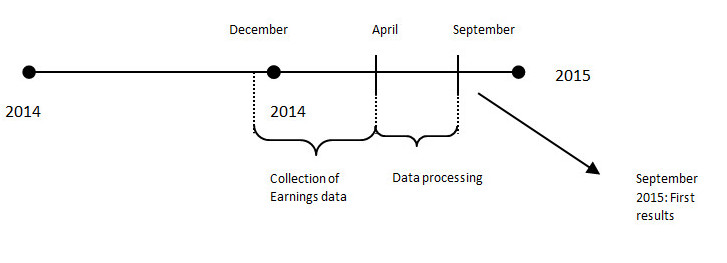
Since the earnings data only contain information concerning earnings, the time span for collecting the absence data in the public sector is a bit broader. The absence data for 2014 was received in April 2015. The total time for public sector data collection is thus 16 months. The first results based on the public sector earnings data was published on September 2015. See figure 4.1 for a graphic presentation of the process. Processing of the earnings data for the public sector including quality checks, plausibility checks etc. amounted to 6 months. The private sector data collection process consists of 2 modules. The first relates to the earnings and absence data for 2014 and the other relates to the “Other Labour Costs” data which contain information regarding the degree of collective pay agreements. The 2014 earnings and absence data collection started December 2014 stretching about 5 months. In cases where a respondent failed to report the data, extra time was given to transmit the data. If a respondent failed to supply Statistics Denmark, the Confederation of Danish Employers (DA) or the Danish Employers’ Association for the Financial Sector (FA) with earnings data within this additional time, the enterprise was reported to the police. It should be noted that data transmitted to Statistics Denmark are mainly collected in January and February 2015, and that some of the quality work and processing already starts here. The first publication based on the private earnings data was published on September 2015. See figure 4.2 below for a graphic presentation of the process. Figure 4.2 Private Sector
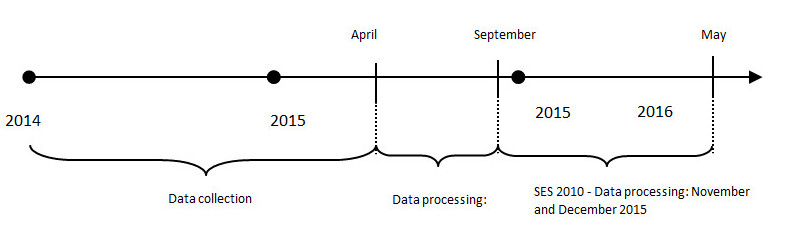
As already mentioned some of the work that relates to quality checks and processing already starts in January/February 2015. Therefore, all in all, processing of the earnings data for the private sector including quality checks, plausibility checks etc. amounted to about 7 months. Regarding the 2014 “Other Labour Costs” data the time span for data collection was February 2016 to august 2016. Due to an error, data on collective pay agreements were not collected for 2014, and therefore had to be collected in the survey on other labour costs for 2015 instead. The information in this variable is thus from a year behind what it should be. Regarding the 2015 “Other Labour Costs” data the time span for data collection was February 2016 to August 2016. But the variable on collective pay agreements was already ready for inclusion in the SES2014 in May 2016. The earnings data for the public and the private sector are combined and made available in the Common Earnings Register around the same time as the two statistics are being published, which in the case of data for 2014 was in September 2015. Figure 4.3 Common Earnings Register and SES
The data for the SES 2014 was already available in the Common Register in September 2015. The work regarding the SES 2014 started in November 2015 and continued through December 2015. At this time the data for delivery was almost ready, the only thing lacking was information on collective pay agreements from the survey on other labour costs. This was ready in May 2016, where the SES 2014 was finalized and sent to you Eurostat for validation. |
|||
| 7.2.1. Punctuality - delivery and publication | |||
Not requested |
|||
|
||||||||||||||||||||||||||||||||||||||||||||||||||||||||||||||||||||||||||||||||||||||||||||||||||||||||||||||||||||||||||||||
| 8.1. Comparability - geographical | ||||||||||||||||||||||||||||||||||||||||||||||||||||||||||||||||||||||||||||||||||||||||||||||||||||||||||||||||||||||||||||||
Denmark only constitute one region in the European SES. In the national SES information on earnings can be split up into more regions and comparisons can be made. The coverage of enterprise should be equally distributed across regions which forms a good basis for comparisons. |
||||||||||||||||||||||||||||||||||||||||||||||||||||||||||||||||||||||||||||||||||||||||||||||||||||||||||||||||||||||||||||||
| 8.1.1. Asymmetry for mirror flow statistics - coefficient | ||||||||||||||||||||||||||||||||||||||||||||||||||||||||||||||||||||||||||||||||||||||||||||||||||||||||||||||||||||||||||||||
Not requested |
||||||||||||||||||||||||||||||||||||||||||||||||||||||||||||||||||||||||||||||||||||||||||||||||||||||||||||||||||||||||||||||
| 8.2. Comparability - over time | ||||||||||||||||||||||||||||||||||||||||||||||||||||||||||||||||||||||||||||||||||||||||||||||||||||||||||||||||||||||||||||||
Variable 2.5, highest successfully completed level of education and training, is now based on the International Standard Classification of Education 2011 instead of the 1997 version. There was some problems in making sure that all varibales could be transformed to fit the new standard, and as a result a relatively large share of observations are excluded. The exact number of observations is reported under 6.3.2 Measurement Error. Comparisons between 2010 and 2014 figures for the variable highest successfully completed level of education and training should therefore be made with caution. |
||||||||||||||||||||||||||||||||||||||||||||||||||||||||||||||||||||||||||||||||||||||||||||||||||||||||||||||||||||||||||||||
| 8.2.1. Length of comparable time series | ||||||||||||||||||||||||||||||||||||||||||||||||||||||||||||||||||||||||||||||||||||||||||||||||||||||||||||||||||||||||||||||
Not requested |
||||||||||||||||||||||||||||||||||||||||||||||||||||||||||||||||||||||||||||||||||||||||||||||||||||||||||||||||||||||||||||||
| 8.3. Coherence - cross domain | ||||||||||||||||||||||||||||||||||||||||||||||||||||||||||||||||||||||||||||||||||||||||||||||||||||||||||||||||||||||||||||||
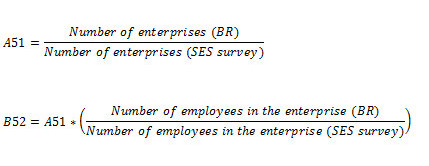
Number of employees in the SES compared to other sources The figures on employment (e.g. number of employees) in the SES are in the case of Denmark not necessarily representative for the employment situation in the country. In Denmark the SES is a survey on earnings only and not labour force. To obtain population estimates grossing-up factors are made, where A51 is the grossing-up factor for the local unit and B52 for the employee. In Denmark these are calculated in the following way: where BR=Business Register and number of employees is in full-time units. The number of employees is therefore not expressed in the actual number of employees but the number of employees in full-time units. Furthermore, for all employees and enterprises the variables are by default set to be 1 if less than 1. When these variables are summed up (as is done to obtain the number of employees in the SES), the number will be higher than the factor to which the enterprises and employees have been grossed-up to. This is why the number of employees is higher than in many other sources. An example is the employment figure in the LFS, which in the case of 2014 was only 2,640,100, while according to the SES the number of employees was 2,962,771. In other words, the SES is in the Danish case not suited for analysis and comparisons on employment figures. The survey is conducted with the single objective of giving a representative picture on the earnings situation among employees in Denmark. |
||||||||||||||||||||||||||||||||||||||||||||||||||||||||||||||||||||||||||||||||||||||||||||||||||||||||||||||||||||||||||||||
| 8.4. Coherence - sub annual and annual statistics | ||||||||||||||||||||||||||||||||||||||||||||||||||||||||||||||||||||||||||||||||||||||||||||||||||||||||||||||||||||||||||||||
Not requested |
||||||||||||||||||||||||||||||||||||||||||||||||||||||||||||||||||||||||||||||||||||||||||||||||||||||||||||||||||||||||||||||
| 8.5. Coherence - National Accounts | ||||||||||||||||||||||||||||||||||||||||||||||||||||||||||||||||||||||||||||||||||||||||||||||||||||||||||||||||||||||||||||||
In the table below, the variable number of employees and gross annual earnings in the SES 2014 are compared against the number of employees and wages and salaries (D11) in the National Accounts.
(1) Number of employees, (2) Gross annual earnings (in DKR), (3) Wages and Salaries (in DKR) and (4) Percentage difference between the annual earnings in NA and SES.
According to the article Sources and Methods in the NA, The NA Wages and salaries include any social contributions, taxes etc. payable by the employee. Wages and salaries come in cash and in kind. Wages in cash consists of regular wages plus i.e. commissions, overtime payments, bonuses, payments on public holidays and payments on other holidays. Social contributions, income taxes etc. which fall on the employee are included even when they in practice are kept back for direct payment to relevant authorities by the employee. Wages in kind – fringe benefits – consists of products which are provided freely or to reduced price by the employer to the employee as part of the conditions of employment. Fringe benefits are not necessary in the production process. If they were, they should be treated as intermediate consumption. The NA employment figures contain persons supplying their labour in the production of goods and services in Denmark regardless of their place of residence. The employment figures reflect the total number of employed persons in the course of the year. This number only depends on the employment rate of the persons employed and does not reflect decisions to work full time or only part time. Employment consists of persons above the age of fourteen earning a salary equivalent to at least 80 hours of work within one year as well as persons temporarily absent from their work but still have a formal attachment to the job, e.g. persons on maternity leave. Only the primary job is reflected in the statistics. See article on sources and methods in the NA for more information. The SES does not include social contributions paid by the employer. This fact however, should pull the discrepancy in a positive direction and therefor actually minimize the negative discrepancy. But all in all it is natural that the earnings in the NA are lower than in the SES. This is because the NA include earnings for many more employees than the SES, of which many are lower paid, e.g. employees in enterprises with less than 10 employees, employees performing undeclared work and employees in flex job subsidized by the state. |
||||||||||||||||||||||||||||||||||||||||||||||||||||||||||||||||||||||||||||||||||||||||||||||||||||||||||||||||||||||||||||||
| 8.6. Coherence - internal | ||||||||||||||||||||||||||||||||||||||||||||||||||||||||||||||||||||||||||||||||||||||||||||||||||||||||||||||||||||||||||||||
The data behind the Danish SES transmitted to Eurostat are more or less the same as the data that is used to conduct the national SES, which is collected and published every year. But as described in the section on Measurement Error (Hege tjek), a great deal of records do not fulfill some of the European validation checks, and as a result the Danish data for the European SES contain less observations than the national SES, Furthermore, there are great varieties in how the variables are constructed. While the European SES measures earnings per hours paid, the national SES has two concepts: earnings per hour worked and standardized hourly earnings. The two concepts are described in the following way in the statistical documentation on the national SES: Earnings per hour worked: Earnings per hour worked is earnings related to the number of hours worked. Earnings per hour worked indicate the employer's wage cost per hour in employing a given emloyee. Standardized hourly earnings: Standardized hourly earnings are standardized earnings related to the standardized paid hours worked. The standardized hourly earnings are the concept of earnings that is the closest concept with regard to the wages and salaries that have been "agreed" between employee and employer. The concept indicates the amount that an employee has received per hour worked, irrespective of the number of days in which the employee has been absent due to sickness or has worked hours in addition to the working time agreed. In the European SES, the average gross hourly earnings are the earnings in the reference month divided by the hours paid in the same month. Not only does the hours used differ between the three concepts, but also the way the variables are constructed, with the European being a monthly related figure, while the national figures are derived from both total earnings and hours for the whole year. The table below summarizes the results for the earnings per hour worked and the standardized hourly earnings in the national SES and compares them against the hourly earnings in the European SES.
(1) Earnings per hour worked, (2) Standardized hourly earnings, (3) Hourly earnings in the European SES and (4) Percentage difference between the standardized hourly earnings and the hourly earnings in the European SES. All figures are in DKR and from 2014. (1) and (2) are from the national SES, while (3) is the Danish results from the European SES. The national SES figures are collected from the national database. The European figures are calculated as the hourly earnings in EUR, multiplied by the factor 7.4, which is the normal exchange rate figure between the two currencies.
As the standardized hourly earnings are closest to the hourly earnings in the European SES, a percentage difference is only made between these two. As the table shows, the national figures are higher than the European figures. The two main reasons for this is the following:
|
||||||||||||||||||||||||||||||||||||||||||||||||||||||||||||||||||||||||||||||||||||||||||||||||||||||||||||||||||||||||||||||
|
|||
| 9.1. Dissemination format - News release | |||
A news release was published (in Danish) with some of the results from the national SES. The article can be read here. The article was published in September 2015, which is more than a year before the first news release on the SES 2014 was published by Eurostat (December 2016). As the SES is close to identical to the annual national survey of structural earnings – except for a slightly different combination of variables, the Danish figures from the European SES is not published. |
|||
| 9.2. Dissemination format - Publications | |||
The most detailed statistics on the structure of earnings are published in Danish in “Løn” (Statistics on earnings) appearing in the series “Statistiske Efterretninger” (Statistical News). The file is attached to the metadata as an annex. Many of the key earning figures are also published in Statistics Denmarks yearbook for 2014. Annexes: Publication on national SES results "Statistical News" |
|||
| 9.3. Dissemination format - online database | |||
The structure of earnings data is available in English via StatBank Denmark. The earnings data can be found under Earnings and Labour Costs. The 2006 data was split in public and private earnings statistics while since 2010 the earnings statistics are combined and presented in the same tables. The key series are: (Earnings; LONS20, LONS30, LONS40, LONS50 and LONS11). |
|||
| 9.3.1. Data tables - consultations | |||
Not requested |
|||
| 9.4. Dissemination format - microdata access | |||
Authorised research environments and analysis institutes may be given access to the Common Earnings register. Access is always given on a need-to-know-basis to no identifiable micro data in accordance with Statistics Denmark’s special external researchers’ scheme. We grant such authorisation pursuant to a concrete assessment, and the authorised researchers have the same duty of confidentiality as Statistics Denmark staff members. For educational use, we supply non-confidential, sample survey-based datasets that are constructed in such a way that it is not possible to identify persons or businesses. Danish microdata on earnings can only be accessed through Statistics Denmark's own service function for researchers. Microdata is not made available thorugh Eurostat's arrangements. |
|||
| 9.5. Dissemination format - other | |||
If a greater level of detail or tabular cross-tabulations is required, they can be produced on request. The register is at the level of individual employees and may be used in connection with compiling more detailed statistics or in coupling data from other statistics. Clich here for more information on these services. |
|||
| 9.6. Documentation on methodology | |||
The most thourough documentation on the national SES is available in English here. The 2014 edition can be found in the archive. For a description of the variables that are available in the national SES microdata read here (only in Danish). While the statistical documentation on the annual labour costs survey can be read here (this is the survey from which the variable on collective pay agreement is collected). |
|||
| 9.7. Quality management - documentation | |||
Not requested |
|||
| 9.7.1. Metadata completeness - rate | |||
Not requested |
|||
| 9.7.2. Metadata - consultations | |||
Not requested |
|||
|
|||
The administrative response burden for reporting data to the earnings statistics in the private sector amounted to DKK 5.33 mio in 2010. A more recent account of the costs has not yet been performed. |
|||
|
|||
| 11.1. Confidentiality - policy | |||
Not requested |
|||
| 11.2. Confidentiality - data treatment | |||
Not requested |
|||
|
|||
Not requested |
|||
|
|||
|
|||