


1.1. Contact organisation
Eurostat, the statistical office of the European Union
1.2. Contact organisation unit
E2: Environmental statistics and accounts; sustainable development
1.3. Contact name
1.4. Contact person function
1.5. Contact mail address
2920 Luxembourg LUXEMBOURG
e-mail contact: ESTAT-CIRCULAR-ECONOMY@ec.europa.eu
1.6. Contact email address
1.7. Contact phone number
1.8. Contact fax number
2.1. Metadata last certified
7 July 2022
2.2. Metadata last posted
7 July 2022
2.3. Metadata last update
7 July 2022
The indicator is part of the Circular Economy indicator set. It is used to monitor progress towards a circular economy on the thematic area of 'secondary raw materials'.
In a world of increasing demand for raw materials, the use of secondary raw materials can help to improve the EU's security of supply, reduce the extraction pressure on natural resources - and therefore, reduce related pressures on the environment, and contribute to developing a solid circular economy at sub-national, national and European scales.
The EU Action Plan for the Circular Economy states that in a circular economy, materials that can reasonably be recycled should be injected back into the economy as new raw materials, thus increasing the security of supply. These "secondary raw materials" can be generated within a national economy, and can also be traded and shipped just like primary raw materials from traditional extractive resource industries.
In contrast to the indicators of the monitoring framework on waste management, which focus on collection or recycling rates of certain waste streams, this indicator measures recycling's contribution to materials demand per type of material.
4.1. Data description
The indicator measures, for a given raw material, how much of its input into the production system comes from the recycling of "old scrap" (or “end-of-life scrap”) i.e. scrap and waste derived from the treatment of products at their end-of-life (EOL). The EOL-RIR does not take into account scrap that originates from manufacturing processes (namely, "new scrap" or "process scrap”). Indeed, process scraps have a known composition and are generally more homogeneous and not contaminated by other substances, being easier and more economically convenient to be collected and recycled.
On the other hands, EOL scraps are generally represented by a mix of several different materials (including metal alloys, plastics and biotic materials), which require complex collection, sorting and pre-processing before being transformed in secondary raw materials. Even the time horizon of old scraps before reaching the treatment facility is largely variable (from days to decades, depending on the lifetime of the products in which they are used) and making their recycling challenging and, in several cases not profitable. Therefore, monitoring the recycling of "old scrap" is relevant to track the efforts of an economy towards circularity.
Quality of data sources
Few data are available at the European and international level on the amount of secondary raw materials produced. Available data sources for the calculation of the EOL-RIR have been ranked based on the following cascade approach:
a) Material System Analysis (MSA) data for the EU are used, when available, as a first choice. MSA studies are a very reliable data source (since EU-focused and very detailed on tracking all the key material flows). Due to the complexity of the analysis, MSAs are currently carried out for limited number of materials and are not regularly updated. More information on MSA.
b) International reports (e.g. UNEP-IRP, 2011) are used when MSA data are not available. Although robust, these datasets are not necessarily representative for the European geographical context and they do not cover all the materials of interest for the European circular economy monitoring. Moreover, the main dataset was published in 2011 and not updated since then;
c) Industry data and scientific publications are used when none of the above are available. Since system boundaries and data collections practices applied in the literature are not necessarily aligned with MSA or UNEP/IRP approaches, expert judgment is necessary to assess, case-by-case, the quality, robustness and representativeness of available data. This is usually done during validation workshops regularly organised for the assessment of CRMs.
This ranking is preferential but not ‘absolute’, meaning that a cross-check of the input data with other sources and the validation of the results is still essential. For example, in a limited number of cases, some industry and literature data have been preferred (or used as complement) to available MSA data when more up-to-date or representative of the European context.
Calculation of the EOL-RIR
Figure below illustrates the system boundaries and flows for the calculation of the EOL-RIR when using MSA data. Grey boxes represent the life cycle stages of a raw material in the rest of the world (including extraction “Extr”, processing “Proc”, manufacturing “Mfg”, “Use”, collection “Coll” and recycling “Rec”), while the life cycle stages of a raw material in Europe are represented by the brown process boxes. The system boundary for the calculation of the EOL-RIR is represented in pink dashes. Flows used for the calculation of the EOL-RIR are represented in green (primary material), yellow (processed material), and purple (secondary material).
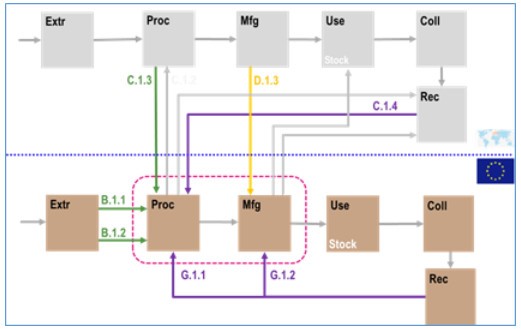
The EOL-RIR is to be calculated by applying the following formula (EC, 2017):
EOL-RIR = (G.1.1 + G.1.2) / (B.1.1 + B.1.2 + C.1.3 + D.1.3 + C.1.4 + G.1.1 + G.1.2)
where the EU ‘secondary production (old scrap)’ flows are:
- G.1.1 Production of secondary material from post-consumer functional recycling in EU sent to processing in EU
- G.1.2 Production of secondary material from post-consumer functional recycling in EU sent to manufacture in EU
the ‘Primary production’ flows are:
- B.1.1. Production of primary material as main product in EU sent to processing in EU
- B.1.2. Production of primary material as by product in EU sent to manufacturing in EU
the ‘Imports flows’ are:
- C.1.3 Imports to EU of primary material
- C.1.4 Imports to EU of secondary material
- D.1.3 Imports to EU of processed material
Recycling is considered as “functional” when the recycled material has a quality equivalent to that of primary materials and it can be used for the same (or similar) applications.
Interpretation of the indicator
The EOL-RIR is determined by several factors. The first one is the demand for raw materials, which is generally increasing for almost all materials over the time. The second one is the amount of materials in waste that are available to be recycled. The presence of these two factors make the interpretation of the indicator quite challenging. In fact, the EU can achieve higher amounts of old scrap recycled, but still being characterised by decreasing values of the EOL-RIR because of a sudden increase in the demand for certain materials (as e.g. occurring for several critical raw materials “CRM” in some low carbon or digital technologies).
Moreover, assessing the quality of recycled materials and the assumption on their functional recycling is not always straightforward. Different assumptions on the functional recycling of certain materials have implied a sudden change of some EOL-RIR values along the years. Due to the maturity of the methodology and the progressive refining of the input data used to calculated the EOL-RIR, this type of variations is likely to decrease in the future.
Several materials (as bulk metals) are largely and efficiently recycled. However, their EOL-RIR is still relatively low, mainly because they are embedded in long-life capital goods, and they could be available for recycling only in the future. Other materials have instead very high values of the EOL-RIR because the use and demand has been drastically reduced by legislative bans. For a large number of materials (including many CRMs) the EOL-RIR is null or very low because they have been introduced only recently in innovative and complex products (e.g. e-vehicles, renewable energy plants, electronics) and technologies for their recycling are still not available or not profitable.
All estimates are based on the EC studies for the revision of the CRMs list, as performed from 2014 to 2020. Values of the EOL-RIR estimated for the EU before 2014 are only partial and have therefore not been included. All the values have been peer-reviewed within so called “criticality validation workshops” (i.e. meeting for the validation of results concerning the CRMs list revision), involving experts from industry and academia
4.2. Unit of measure
Percentage.
4.3. Reference Period
Calendar year.
4.4. Accuracy - overall
Indicator from non-ESS source. For assessment of accuracy please refer to the original source (see link to the external data source and metadata in "Annexes").
4.5. Source data
4.5.1. Source data - Organisation
EC
Note that Eurostat is not the producer of these data, only republishes them. These data are not considered European statistics.
4.5.2. Source data - Comment
Data source: European Commission (EC).
Data provider: Directorate-General for Internal Market, Industry, Entrepreneurship and SMEs (DG GROW) – Critical Raw Materials.
The Joint Research Centre (JRC) has proposed the rules concerning the quality of data (2018), published the Study on the EU's list of Critical Raw Materials (2020) and the Raw Materials Scoreboard).
5.1. Frequency of dissemination
5.1.1. Frequency of dissemination - Grade
Every 3+ years5.1.2. Frequency of dissemination - Comment
Indicator is updated every 3 years. The next update is expected in 2024.
The European Commission has committed to updating the list of Critical Raw Materials every 3 years (COM (2011) 25).
5.2. Timeliness
5.2.1. Timeliness - Grade
T+1 year5.2.2. Timeliness - Comment
New data points are disseminated within one year after the reference year.
6.1. Reference area
6.1.1. Reference Area - Grade
Only EU aggregate6.1.2. Reference Area - Comment
Data are presented only for EU aggregate.
All data (from 2014, 2017 and 2020) refer to EU aggregate (i.e. including EU countries at the time of publication of list of critical raw materials). Still data on secondary materials produced can refer to more general estimations, including average sectorial and international data.
It is highlight that, with the exception of few studies from the literature, no data are available at the Member State level. On the top of the low data availability, data disaggregated at the national level could have a low relevance and representativeness. Indeed, for several raw materials (including many CRMs), the EU countries are relying on imports and export of scraps, which are finally recycled by a limited number of specialised industries not evenly distributed in the European territory.
6.2. Comparability - geographical
6.2.1. Comparability - geographical - Grade
Not Applicable6.2.2. Comparability - geographical - Comment
Data are available only for EU aggregate. No data available by Member State.
6.3. Coverage - Time
6.3.1. Time Coverage - Grade
5 to 10 years6.3.2. Time Coverage - Comment
Indicator with trhree data points.
Data refer to EC studies for the revision of the list of CRMs for the EU (2014-2020). This represents the most up-to-date and representative data source for the indicator at the European level.
6.4. Comparability - over time
6.4.1. Comparability - over time - Grade
3 to 4 data points6.4.2. Comparability - over time - Comment
Data refer to EC studies for the revision of the list of CRMs for the EU (2014-2020). However, different methodologies and data sources have been considered for the assessments before and after 2017. This implies that, so far, a direct comparison of the values over the years is not always feasible, whereas expert judgments are recommended for the interpretation of the data.
7.1. Dissemination format - Publications
Analysis of indicator is presented in Commission Staff Working Document.
Additional analysis of the indicators is provided (including partial updates, when available), on a bi-annual basis, by the European Raw Material Scoreboard.
7.2. Dissemination format - online database
See table cei_srm010
7.3. Dissemination format - other
Eurostat dedicated section on Circular Economy.
DG GROW. Critical raw materials.
Copyrights:
Eurostat Copyright/Licence Policy is applicable.
