


1.1. Contact organisation
Hungarian Central Statistical Office
1.2. Contact organisation unit
Earnings Statistics Section
1.3. Contact name
Restricted from publication1.4. Contact person function
Restricted from publication1.5. Contact mail address
P.O.B. 51, 1525 Budapest (Hungary)
1.6. Contact email address
Restricted from publication1.7. Contact phone number
Restricted from publication1.8. Contact fax number
Restricted from publication2.1. Data description
During the last 20 years a growing demand emerged for information on cost of employment from investors and other users, due to the liberalised international flow of capital and labour. The Hungarian accession to the European Union also required measuring of the cost of employment. Information on labour input, level of the cost of labour and its fluctuation is very important from the point of view of international comparisons and competitiveness. The labour costs survey was implemented first in 1992.
2.2. Classification system
Classifications used are: NACE Rev2. and the Hungarian Classification of Units by Legal Forms. Business entities, budgetary and non-profit organisations are classified to different categories of NACE Rev2 according to their main activites.
2.3. Coverage - sector
Entreprises (legal unit) and other businesses employing at least 5 persons, all budgetary organisations, and selected NGO-s are covered by the labour cost survey. (The selected NGO-s are Nace Rev 2 section E, P, Q organisations with at least 3 employeess, other sections with at least 50 employees).
2.4. Statistical concepts and definitions
We use SNA concept concerning wages and salaries, non-wage costs (together compensation of employees +,- taxes and subsidies) and hours worked.
2.5. Statistical unit
Enterprises with legal entities, other businesses, budgetary organisations, selected NGO-s.
2.6. Statistical population
The Hungarian Business register's frame covers the statistical population.
2.7. Reference area
The whole country.
2.8. Coverage - Time
The labour cost survey has been carried out since 1992.
2.9. Base period
-
3.1. Source data
Labour Cost Survey, 2016 results: The survey covered enterprises employing 5 and more persons and all budgetary organs and a set of certain non-profit institutions. The survey of enterprises with employed persons from 5 to 19 was sampled, while the ones employing more than 19 were fully observed.
3.2. Frequency of data collection
Frequency of data collection is four years.
3.3. Data collection
The deadline of the labour cost survey data collection is 150 days (enterprises) and 195 days (budgetary organisations) after the end of the reference period. The data collection takes place electronically from 1st of January 2013. The electronic data sending is obligatory for every data supplier. From this date none of the enterprises is able to send their questionnaire back via post or email, only via a special interface called ELEKTRA. The staff of the departments closes the data collection in November. In the following next two months the loaded data are check, micro and macro validated.
3.4. Data validation
HCSO has used a wide range of logic tests in the Labour Cost Survey. Hopefully the extensive list of logic tests used has revealed all errors of magnitude made by respondents. All questionnaires were approved. Re-contacts were made by the field-workers if it was necessary. For better checking we used data from the annual Structure of Business Survey and Social security payment report, too.
3.5. Data compilation
The missing data of those non-respondents were imputed.
3.6. Adjustment
-
4.1. Quality assurance
Quality assurance is a continous work, all HCSO's surveys have to use general rules of HCSO's Quality Assurance Policy.
4.2. Quality management - assessment
Data are checked for completeness and consistency. From 2013 data have been collected by a new electrical program called Electra. The quality of the data is more better because there is an integrated monitoring built in the program, so the report can be sent by the sender if the data are checked and coherent.
The Hungarian labour concepts are harmonized with the Eurostat regulation. Besides informing the Hungarian users, the result of the surveys make it possible to meet fully international demands.
5.1. Relevance - User Needs
The table contains the most important characteristics of the main users of labour cost data.
| Name of the user | Adaptation of needs |
Origin of needs |
Satisfaction of needs |
| Ministries |
They are taking part in the official statistical service, their representatives are members of the Statistical Committee |
Policy-making, strategy of development in different fields of economy, impact of price of labour on the labour demand, labour market policy, spatial decisions, impact of burden on employment (social costs) |
Publications, analysing of special fields, questionnaire design, involving new elements of labour costs Generally satisfied |
| Other governmental bodies (National Bank etc.) |
Either they have representatives in the Statistical Committee or they can apply to the SC |
Short-term and medium term forecasting, evaluation of the performance of the economy, measurement of competition |
Publications, special databases are available according to agreement Generally satisfied |
| Enterprises, and employers organisations |
They can apply to the SC based on the statistical law |
Internal and international comparisons, benefit policy, human resource management, recruitment |
Publications, meetings, etc Generally satisfied |
| Trade unions |
They can apply to the SC based on the statistical law |
To integrate different labour cost elements into collective agreement, informing their members on income from employment |
Publications, data are available by type of activity etc. Generally satisfied |
| Hungarian Academy of Science, research institutes, universities, students |
They can apply to the SC , taking part in meeting on design and development of the survey as specialists |
Research purposes for different analysis, forecasting, methodological analysis |
Publications, individual database Generally satisfied |
| Media |
They can apply to the SC |
Information based on objective data |
First release, list of publications, training for the journalists Generally satisfied |
| Forum for users on Labour Statistics |
They can apply to the SC, taking part in the job of methodologists on labour statistics |
Better understanding of labour market flows, changes, demand and supply. How to avoid too much burden or useless information. To be well informed on different labour market issues |
Publications, Extremely satisfied |
| EUROSTAT |
Council and Commission Regulations, working party on labour market task forces on wages and salaries, labour costs |
Needs of European users, ECB, transferred by the Eurostat, international comparisons, data for investors and for employees |
Publications, data transfer Hopefully satisfied |
| OECD |
Meetings for member states, requirement letter on the labour cost survey database |
International publications, requirements of researchers transferred by the delegations |
Usual database, regular data transfer Hopefully satisfied |
| ILO |
Letters, meetings, recommendations for states joining to the agreement |
Different indicators of the labour markets, transferred by experts on labour costs |
International publication electronic databases, regular data transfer Hopefully satisfied |
5.2. Relevance - User Satisfaction
We have no special user satisfaction survey on Labour Cost Survey, however we try to know user needs, their opinion. Requests concerning Labour Cost Survey sent to HCSO using mail, phone and other communication channels are taken into account during the questionnaire design or preparation of publications. Our users are generally satisfied. See 5.1. Relevance - User Needs.
5.3. Completeness
There were not any important deficiencies from the council regulation.
The statistical unit was the enterprise in the 2016 survey as it was in the previous LCS, and other institutional surveys. Scope is also fully implemented taking account of NACE sections (sections B to S of NACE Rev 2.); however data of small enterprises (the ones with less than 5 employees) are missing.
Definitions are fully implemented.
Breakdown of variables is fully implemented.
D1112: NA: This allowance is not frequent in Hungary, therefore they weren’t observed.
5.3.1. Data completeness - rate
100%
-
6.1. Accuracy - overall
not applicable
6.2. Sampling error
Probability sampling
The survey was carried out partly through a sample. The target population for the sampling survey included the active enterprises with 5–19 (in construction 5–9) employees. Enterprises with at least 20 employees were enumerated completely. (Enterprises with less than 5 employees were not surveyed.)
The sampling frame for the survey and the number of enterprises were provided by the Business Register (BR) of the Hungarian Central Statistical Office (HCSO). Observational and at the same time sampling units were the enterprises of the BR belonging to the appropriate NACE sections and size groups, and having a so-called obligatory data-supplier status (indicating that the enterprise is active). The data collection covered those units, which had been selected from the sampling frame. Data of those non-respondents were imputed by zero of which – on the basis of information on the cause of non-response – it is supposed that they would have sent a questionnaire with only zero values.
A stratified sample had been selected for the survey. The criteria for stratification were the following:
- according to NACE Rev. 2, in construction (divisions 41–43) within group 42.1 the various classes, otherwise the various groups, within divisions 45, 46, 47 and 56 groups 45.1, 46.9, 47.3 and 56.1, respectively, moreover the other groups, within divisions 10, 18, 25, 31, 49, 52 and 85 classes 10.71, 18.12, 25.11, 31.09, 49.41, 52.29 and 85.59, respectively, furthermore the other classes,
- size (categories: 10–19 and 5–9 employees),
- headquarter (categories: capital and countryside).
The total sample size had been determined by taking into account both accuracy demands and cost limitation. The sample size for the various strata had been determined by a modified Neyman allocation. The sample had been selected systematically, according to the decreasing order of the random numbers belonging to the various enterprises in the BR.It was given a preference to the enterprises belonging to the sample of the STS (Short-term Business Statistics) surveys of the HCSO.
6.2.1. Sampling error - indicators
Bias
There was not any measurable bias due to estimation method.
Variance
In the survey quality indicators were calculated for the following characteristics:
- annual labour costs (D)
- hourly labour costs (D / B1)
Calculations were made on the basis of survey data. The missing data of those non-respondents were imputed, the data of which had not been imputed by zero. The imputation was made by the mean value of the amalgamated Budapest–countryside stratum. In the course of the processing, some indicators were estimated by strata for the sampled enterprises and the enterprises enumerated completely. In case of annual labour costs, the population total was estimated directly from the elementary data. Within the various sampled strata the following was made. The sampling weight

was determined, where  was the size of the jth stratum, was the number of enterprises selected into the sample in the jth stratum. Within the various strata, the population total
  was estimated by the Horvitz-Thompson estimator with equal selection probabilities:

where  was the sample total in the jth stratum.
In case of strata enumerated completely,  , which implies that
  therefore
  .
.
Obviously, for the union of strata

The population mean for the various strata was estimated as

The population value of hourly labour costs was estimated as the quotient of the estimated population totals of annual labour costs and hours worked by all employees.
In case of annual labour costs, the term
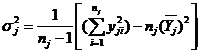
(the individual variance) was determined for the sampled strata, where  was the data of the ith sampled enterprise in the jth stratum. Within the various sampled strata, the variance
  of the population total was estimated by the formula
Obviously, the value of  was zero for the strata enumerated completely.
For the union of strata

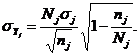
For the various sampled strata and their union, the variance of the population value of hourly labour costs was estimated as
 and
and 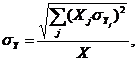
respectively, where  is the variance of the population total of annual labour costs,
  and X are the population totals of hours worked by all employees for the jth stratum and the union of strata, respectively. The term
  was calculated in the following way. Let
  and
and  be the data of annual labour costs and hours worked by all employees, respectively, for the ith sampled enterprise in the jth stratum,
  and
and  the corresponding population means,
  and
and  the individual standard deviations,
 and
and 
then the correlation coefficient of annual labour costs and hours worked by all employees is
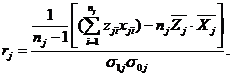
The term  was determined by the formula
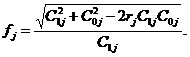
For the various sampled strata and their union, the coefficient of variation of both annual and hourly labour costs was

In annex file QLI_LCS_coefficients of variation_2016.docx show the coefficients of variation (CVs). The coefficients of variation of the Labour costs were computed:
- by NACE Rev.2 sections (for size class 1+ employees),
- by NACE Rev.2 sections (for size class 10+ employees),
- by size classes,
- by NUTS1 level (for size class 1+ employees),
- by NUTS1 level (for size class 10+ employees).
(Most of Educational and Health institutions do not belong to the business sector, they are budgetary organs.)
Annexes:
LCS 2016 coefficients of variation
6.3. Non-sampling error
Not applicable.
6.3.1. Coverage error
Frame errors: The overall sample fraction was 9,7% among enterprises employing 5-9 persons, and 14,5% among those which employing 10-19 persons. Enterprises with at least 20 employees were covered fully.
6.3.1.1. Over-coverage - rate
Over-coverage-rate: 1,4%.
6.3.1.2. Common units - proportion
-
6.3.2. Measurement error
A wide range of logic tests were introduced and used in the LCS 2016. The data were tested during data entry, and also at macro level. Statistics concerning the number of corrections have not been made, so there are not any data for measuring processing errors.
6.3.3. Non response error
For the various sampled strata and their aggregations, the unit response rate was: n/n0
| Initial sampling rate was | (S/P) | 34,3 |
| Sampling rate based on the response | (R/P) | 30,4 |
| Unadjusted sampling rate | (R/S) | 88,8 |
Where:
| Population of enterprises | (P) | 77 664 |
| Enterprises in the survey | (S) | 26 635 |
| Respondents (enterprises) | (R) | 23 646 |
Sampling and response rates achieved by industries
| Industries code |
No. of units in population |
No. of units in survey |
No. of responding units |
Initial sampling rate |
Sampling rate based on the response |
Unadjusted response rate |
| B |
139 |
94 |
91 |
67,6 |
65,5 |
96,8 |
| C |
12 534 |
5 418 |
5 037 |
43,2 |
40,2 |
93,0 |
| D |
192 |
107 |
103 |
55,7 |
53,6 |
96,3 |
| E |
646 |
422 |
392 |
65,3 |
60,7 |
92,9 |
| F |
9 031 |
2 314 |
2 083 |
25,6 |
23,1 |
90,0 |
| G |
20 832 |
4 938 |
4 402 |
23,7 |
21,1 |
89,1 |
| H |
4 419 |
1 484 |
1 324 |
33,6 |
30,0 |
89,2 |
| I |
6 330 |
1 350 |
1 190 |
21,3 |
18,8 |
88,1 |
| J |
2 503 |
861 |
768 |
34,4 |
30,7 |
89,2 |
| K |
749 |
376 |
350 |
50,2 |
46,7 |
93,1 |
| L |
2 012 |
536 |
458 |
26,6 |
22,8 |
85,4 |
| M |
5 926 |
1 353 |
1 186 |
22,8 |
20,0 |
87,7 |
| N |
4 102 |
1 708 |
1 288 |
41,6 |
31,4 |
75,4 |
| O |
1 365 |
1 365 |
1 087 |
100,0 |
79,6 |
79,6 |
| P |
2 158 |
1 819 |
1 680 |
84,3 |
77,8 |
92,4 |
| Q |
2 792 |
1 801 |
1 616 |
64,5 |
57,9 |
89,7 |
| R |
767 |
370 |
317 |
48,2 |
41,3 |
85,7 |
| S |
1 167 |
319 |
274 |
27,3 |
23,5 |
85,9 |
| B-S |
77 664 |
26 635 |
23 646 |
34,3 |
30,4 |
88,8 |
* We perform aggregate observation by the school district centers and local government agencies.
6.3.3.1. Unit non-response - rate
Unit adjusted non-response-rate: 6,6%.
6.3.3.2. Item non-response - rate
Item non-response was theoratically not allowed, because of the nature of the questionnaire, imputation of different items was not possible due to lack of information. Field-workers tried to get all information, but if an enterprise refused to give answers to the whole questionnaire, it became non-response. Item level imputation isn't used.
6.3.4. Processing error
Since 2000 HCSO and users together had been improving the questionnaire and the guidance. Using the results of this common work a wide range of logic tests were introduced and used in the LCS 2016. Hopefully the extensive list of logic tests used has revealed all errors of magnitude made by respondents. All questionnaires were approved. Re-contacts were made by the field-workers if it was necessary. The data were tested during data entry, and also at macro level. For better checking we used data from the annual survey (Annual Labour Survey) at micro level, too. All revisions made in both surveys were taking account in the data-base. The missing data of those non-respondents were imputed.
6.3.4.1. Imputation - rate
As mentioned earlier, data of the non-respondents in the fully scoped part are imputed by algorithm and in the sampled part by strata average. So the imputation rate is equal to the non-response rate.
6.3.5. Model assumption error
HCSO did not use any models.
6.4. Seasonal adjustment
-
6.5. Data revision - policy
[Not requested]
6.6. Data revision - practice
[Not requested]
6.6.1. Data revision - average size
[Not requested]
7.1. Timeliness
The deadline of returning the questionnaires is T+150 days (for budgetary organisation T+195 days).
From june to januar the data are being processed, ckecked and correcedted. Than after the data are tested further at micro and macro level.
The period of data processing was from january to june.
7.1.1. Time lag - first result
Dates of publication of first results was in August 2018 (Stadat table).
7.1.2. Time lag - final result
Results are released in January 2019 (dissemination database).
7.2. Punctuality
See 7.1 Timeliness.
7.2.1. Punctuality - delivery and publication
| Delivery | Deadline | |
| Labour Cost Survey data | 2018.06.29. | 2018.06.30. |
| Quality report | 2018.12.20. | 2018.12.31. |
Publication in January 2019.
8.1. Comparability - geographical
Definitions, coverage and methods based on the Community legislation, so it is comparable in geography.
8.1.1. Asymmetry for mirror flow statistics - coefficient
[Not requested]
8.2. Comparability - over time
Definitions, caverage and methods based on the Community legislation, so it is comparable in time.
8.2.1. Length of comparable time series
[Not requested]
8.3. Coherence - cross domain
Coherence with statistics on wages and salaries from Integrated Database (see in file QLI_LCS_annex_2016.xlsx ‘wages and salaries’,’wages and salaries per employee’, same variable in SBS)
In the Hungarian System of Statistics the frame of SBS was the Annual Integrated Survey (AIS). There are consist currently of more surveys. The coverage of AIS is larger than SBS (budgetary and non-profit organisations, agriculture public administration and non-market services are included, too) and the number of variables is also much higher than that of SBS variables, practically a labour block is also included which is almost the same as in LCS and STS and uses the same definition as the mentioned surveys. In the annex where wages and salaries are compared we did not use the original SBS data. Integrated Database is used, so the coverage is as close as possible. Variables of labour block of the AIS were used, where the definition of the variables is the same. So the coherence of wages and salaries is quiet good (average) between LCS and Integrated Database (adjusted SBS). There is a difference of 2,6% for the whole economy (NACE Rev 2 B-S by wages and saleries per employee). However the difference is larger in some industries (NACE Rev 2 M, S, L, J). The probable cause of the gaps by industries could be that the LCS is a sample survey, the AIS is not, it uses administrative sources namely tax records and an estimation model. Another cause can be: although reference periods are the same, the date of reporting is different. LCS can take into account results of the final balance sheet, so data are presumably more precise, for example benefits in kind are often estimated for AIS, but at the time of deadline of LCS precise data are already available. However definition is the same in the two surveys gap can derive from the fact that wages and salaries involve two main items: the ‘traditional wages and salaries’ and ‘other income’. In the labour block of AIS total sum of the second one is asked while in LCS questionnaire 4-5 labour costs elements are reported. Small enterprises often give more reliable data if the variables by elements are asked.
Coherence with statistics on hours worked from Labour Force Survey (LFS) (see in file QLI_LCS_annex_2016.xlsx ‘hours actually worked per employee')
Concerning the annual hours worked by an employee the coherence between the two survey is as follows. Labour Force Survey overestimate the hours worked by 61 to 522 hours in a year. There is no divergence between the definitions of hours worked used in LCS and LFS. Number of hours worked by an employee in 2016 was by 11,6% (226 hours) lower in LCS than in LFS. In five section (NACE Rev 2 B, F, G, H, I) the difference was 15% or more than 15%. The NACE Rev 2 section O Public administration and defence, compulsory social security is the only one section where annual hours of an employee are only 61 working hours higher in the LFS than the Labour Costs Survey.
Probable causes of the differences could be as follows:
- people think they have worked much than they have really done if we ask retrospectively about their hours worked,
- some enterprises do not have reliable files on hours worked by employees paid according performance (results),
- the coverage of LFS is different from LCS.
Coherence with statistics on labour cost index (LCI) (see in file QLI_LCS_annex_2016.xlsx)
The annual growth rate of hourly labour cost in LCS was lower than LCI (2,5%, 3,5%). The difference between the growth rates was the lowest difference in Transportation and storage (NACE Rev 2 H), the biggest in Administrative and support service activities (NACE Rev 2 N).
8.4. Coherence - sub annual and annual statistics
[Not requested]
8.5. Coherence - National Accounts
Coherence with SNA on compensation per employee (see in QLI_LCS_annex_2016.xlsx ‘Compensation of employees per employee: D1 in LCS, D1 National Account )
The most comprehensive statistics on compensation are defined by the SNA. All statistical sources, estimations are applied in a well-established standardised system, so comparison with this source is very important. We used a quite new method to improve the coherence: D1 variable from the Labour Cost Survey covering all economic units employing at least 5.
The difference between the two statistics was 6,1% (compensation per employee), however among industries the picture is different.
Probable causes of the differences could be as follows: National account data involve also estimation of non-observed economy.
8.6. Coherence - internal
[Not requested]
9.1. Dissemination format - News release
[Not requested]
9.2. Dissemination format - Publications
See you 9.3.
9.3. Dissemination format - online database
Dissemination format publication: standard tables and on-line database on the Hungarian Statistical Office website.
Dissemination database (Population and social statistics/Labour/Labour cost):
http://statinfo.ksh.hu/Statinfo/themeSelector.jsp?&lang=en
Stadat Tables (Labour Cost Survey of HCSO):
2.1.57., 2.1.58.
http://www.ksh.hu/stadat_annual_2_1
9.3.1. Data tables - consultations
[Not requested]
9.4. Dissemination format - microdata access
Because of the nature of Hungarian LCS we don't have microdata access.
9.5. Dissemination format - other
Information service and public relation division are responsible for transmission of demand on labour cost (LC) generated by users to subject matter department. Specialist of subject matter department are responsible for fulfilling all requirements relating on LC data, analysis and methodology.
9.6. Documentation on methodology
Documentation on methodology can be found on Hungarian Central Statistical Office's Information Document Library.
9.7. Quality management - documentation
European Statistics Code of Practice is on the website of HCSO with the Peer review on the implementation of European Statistics Code of Practice. Quality policy of HCSO is on the website of HCSO. The international legal acts prescribe the scope, the level of detail and the deadlines, furthermore the implementation of definitions of variables. The processing of manufacture of data has been developed according to these regulations.
9.7.1. Metadata completeness - rate
We don't have numerical information or the rate. Metadata completeness is quite good, and continously developed.
9.7.2. Metadata - consultations
[Not requested]
Average time for completing the Labour Cost Survey: 87 minutes.
11.1. Confidentiality - policy
Confidentiality policy of the Hungarian Central Statistical Office: https://www.ksh.hu/docs/bemutatkozas/eng/avpol_web_eng.pdf
11.2. Confidentiality - data treatment
Because of the nature of Hungarian LCI no direct rules applied for treating the data set to ensure statistical confidentiality and prevent unauthorised disclosure.
Rules have to be applied in case of the data source.
Prohibition of disclosure of individual-level information. During dissemination of statistical data taking into account the relevant provisions of the law – disclosure of individual-level information is strictly forbidden.
Sensitivity rules: A cell is considered unsafe, when the cell frequency is less than 3. We use this minimum frequency rule together with a dominance rule.
-
During the last 20 years a growing demand emerged for information on cost of employment from investors and other users, due to the liberalised international flow of capital and labour. The Hungarian accession to the European Union also required measuring of the cost of employment. Information on labour input, level of the cost of labour and its fluctuation is very important from the point of view of international comparisons and competitiveness. The labour costs survey was implemented first in 1992.
We use SNA concept concerning wages and salaries, non-wage costs (together compensation of employees +,- taxes and subsidies) and hours worked.
Enterprises with legal entities, other businesses, budgetary organisations, selected NGO-s.
The Hungarian Business register's frame covers the statistical population.
The whole country.
not applicable
The missing data of those non-respondents were imputed.
Labour Cost Survey, 2016 results: The survey covered enterprises employing 5 and more persons and all budgetary organs and a set of certain non-profit institutions. The survey of enterprises with employed persons from 5 to 19 was sampled, while the ones employing more than 19 were fully observed.
The deadline of returning the questionnaires is T+150 days (for budgetary organisation T+195 days).
From june to januar the data are being processed, ckecked and correcedted. Than after the data are tested further at micro and macro level.
The period of data processing was from january to june.
Definitions, coverage and methods based on the Community legislation, so it is comparable in geography.
Definitions, caverage and methods based on the Community legislation, so it is comparable in time.