Reference metadata describe statistical concepts and methodologies used for the collection and generation of data. They provide information on data quality and, since they are strongly content-oriented, assist users in interpreting the data. Reference metadata, unlike structural metadata, can be decoupled from the data.
Integrated Labour, Education and Training Division (SWB)
1.3. Contact name
Restricted from publication
1.4. Contact person function
Restricted from publication
1.5. Contact mail address
Via Cesare Balbo, 16 - 00184 - Rome - Italy
1.6. Contact email address
Restricted from publication
1.7. Contact phone number
Restricted from publication
1.8. Contact fax number
Restricted from publication
2.1. Data description
The quarterly Labour Cost Index (LCI) is part of the European system of multi-annual, yearly and infra-annual statistics providing, at supranational level, an harmonized, comprehensive and detailed information framework on level, structure and short-term development of the labour cost by economic activity sector. In this system the quarterly LCI measures the cost pressure arising from the production factor "labour". Data defining the LCI refer to the Total average hourly Labour Cost (TLC) and to its two components, Wages and Salaries (WAG) and employers' social security contributions plus taxes paid minus subsidies received by the employer (Labour costs other than wages and salaries) (OTH) [1] (see Regulation (EC) n. 450/2003 of the European Parliament and of the Council of 27 February 2003 concerning the labour cost index).
Data are provided within 70 days after the end of the reference quarter and are given in the form of index numbers (current base year is 2020) broken down by economic activity (Nace Rev.2). In detail:
Elementary indices are calculated for the single sections B to S;
Laspeyres chain indices, annually chain-linked back to the reference year are compiled for the B to E, B to F, B to N, B to S, B to S excluded O, G to J, G to N, G to S, K to N, P to S and O to S aggregates of the three variables.
All series are delivered in unadjusted, calendar adjusted and seasonally and calendar adjusted format. Time series are available with starting date Q1:2000. In addition to the quarterly indices, also annual weights are provided, used by Eurostat to calculate the EU aggregates. The delivery of the quarterly indices is accompanied by metadata. Since December 2016 Italy delivers on a volountary basis the four LCI component variables expressed as levels, only unadjusted. The latter are only for Eurostat internal use.
Beside the compilation of the LCI, once a year (in March) countries are in charge for the validation of an annual labour cost per hour in euros estimated for all the EU Member States by Eurostat by combining the four-yearly Labour cost survey (LCS) with the quarterly labour cost index.
The Italian LCI is compiled using pre-existent survey and administrative data.
[1] The only remaining deviation from the EU concepts is the exclusion, from the Italian LCI of the “subsidies”. At the moment, the sources used for the estimation of the other labour costs component “employers' social contributions plus taxes paid by the employer less subsidies” do not allow the exclusion of the subsidies, that in Italy are yet not present or negligible. By definition, the LCI does not by contrast include vocational training costs and other expenditures such as recruitment costs and working clothes expenditures (Commission Regulation (EC) n.1737/2005 of 21 October 2005 amending Regulation (EC) n. 1726/1999 as regards the definition and transmission of information on labour cost).
2.2. Classification system
Index numbers are made available by economic activity (Nace Rev.2) at section level, for sections from B to S. Several aggregates are also provided, in particular B to E, B to F, B to N, B to S, B to S excluded O, G to J, G to N, G to S, K to N, P to S and O to S.
2.3. Coverage - sector
The Italian LCI covers the B to S Nace Rev.2 sections.
2.4. Statistical concepts and definitions
The labour cost index shows the short-term development of the hourly labour costs incurred by the employers for paid employment and gives a measure of the cost pressure arising from the production factor “labour”. It is calculated dividing the labour costs by the number of hours worked. Labour costs are made up of costs for wages and salaries, plus non-wage costs such as employer's social contributions. The latter do not include vocational training costs or other expenditures such as recruitment costs, spending on working clothes, etc. These labour cost components and their elements are defined in Commission Regulation (EC) n. 1737/2005 of 21 October 2005 amending Regulation (EC) n. 1726/1999.
The LCI covers all business units irrespective of the number of employees and all economic activities except agriculture, forestry and fishing, private households and extra-territorial organisations. LCI data are presented in the form of index numbers (current base year is 2020). Quarterly indices of hourly labour costs are calculated first for each economic sector (Nace Rev. 2. sections) and then aggregated to the whole economy keeping a fixed structure (i.e. fixed weights) by industry (Laspeyres index). Therefore, the LCI includes the compositional effect derived from a change in the composition of employment within an economic sector. All labour cost indices are annual chain-linked Laspeyres indices. In order to obtain Nace aggregates, the hourly labour costs for each component of the aggregate are weighted by the total labour costs of that activity into the aggregate, which are fixed for one year, and then summed up.
Together with the Total Labour Cost Index, indices are also available for the labour cost components "wages and salaries" and "employers' social security contributions". Italy does not provide a version (not mandatory) of the index excluding "bonuses" (bonuses and allowances not paid in every remuneration period). In fact, the data sources at the basis of the Italian LCI does not allow an exhaustive individuation of this component of the Total Labour Cost.
In order to permit the calculation of the EU aggregates, annual weights at section level of Nace are also provided to Eurostat. Italy calculates these weights as levels expressed in euros for the three main variables (TLC, WAG, OTH). In addition, Italy provides on a volountary basis and for Eurostat internal use, quarterly levels for TLC, WAG, OTH expressed in euros and HW (hours worked) expressed in total number.
2.5. Statistical unit
The statistical units are enterprises, public and private institutions, regardless of size.
2.6. Statistical population
Enterprises and institutions with 1 employee or more belonging to the B to S Nace Rev.2 sections.
2.7. Reference area
Geographically the LCI covers the whole country. Activities outside the country are excluded.
2.8. Coverage - Time
Data are available since the 1st quarter of 2000.
2.9. Base period
In the currrent version, indices are referred to 2020 as base year.
3.1. Source data
3.1.1. The LCI as an output of an integrated system
For the compilation of the Italian LCI a unique source of data is not available. The calculation of the indicators that contribute to the index requires the use of a mix of sources that vary across economic domain (Nace Rev.2) and enterprises subpopulation, involving business surveys and National Accounts data.
Figures on the sections from B to N are compiled combining three coherent and harmonized sources that contribute to define, for the mentioned sectors, a system of statistics at Istat aimed at covering the main short term labour market indicators: the census monthly survey on large enterprises (LES) [1], the quarterly sample survey on job vacancies and hours worked (VELA) [2] and a survey on employment, wages and labour cost (OROS) mainly based on Social Security data [3]. Figure 1 shows with respect to three size classes subpopulations which each survey refers to, variables produced and sources used. The pillars of the system are (Ceccato et al 2019, Baldi et al, 2011a and 2011b):
OROS-LES which is used both as the current quarter population frame and as the census based source of information for average quarterly jobs, wages and other labour costs variables;
VELA-LES which is used as the sample based source of information for jobs at the end of the quarter, job vacancies and hours worked.
The three sources, starting from data collection to the production of the main outputs, are characterized by a deep integration that involves definitions, micro data, processing phases and target outputs. At the basis of the system a very strict scheduling of the processing time, in order to guarantee the accomplishment of the various deadlines that, however, still faces some problems in the compilation of the LCI as it will be more in depth explained later on in this paragraph.
Figure 1. The integrated OROS-LES-VELA system: sources, variables and coverage.
In this system, the LCI is one of the final outputs, where all the three sources are integrated. The following formula, expresses how each component of the quarterly per hour labour cost (hwTLCt) is calculated into the system, clearly showing the high integration level that characterizes the system:
Where is the per-capita indicator on total labour cost and is the per-capita indicator on hours actually worked. The three sources reconciliation is guaranteed by the number of jobs drawn from the OROS-LES subsystem.
Starting from the release of March 2020, to better asses the high reduction of labour input due to the massive use of the social security nets during the Covid crisis, an improvement of the estimate of jobs has been introduced.
The VELA-LES source on the hours worked exists since June 2010. Until 2012 the time series produced by the source were available starting from Q1:2004. Because of the shortness of the period covered, for the compilation of the LCI a backcasting of the series until Q1:2000 was necessary and performed by the OROS team, that is in charge of the compilation of the Italian LCI. Starting from the release of June 2013, due to an STS Regulation requirement, the length of the time series of the hours worked produced by the VELA-LES team has been extended to the period Q1:2000-Q4:2003 and used for the compilation of the LCI. An exception is section L that is not required by STS and has not consequently been reconstructed: for this section, the old reconstruction performed by the OROS team is still used.
Until the delivery of March 2013 due to a problem of time lag between the sources in the system, the last observation on the hours worked was not available into the LCI official release deadline and a forecast procedure based on the VELA-LES sources was used in order to get the denominator (for details refer to the LCI Quality Report 2012). Due to a reorganization of the VELA-LES production process, during 2013 timeliness has considerably increased implying, since the delivery of June 2013, the availability of the hours worked last observation and the abandon of the forecast procedure. This improvement has produced positive feedbacks on the quality of the LCI indicators, as it will be further explained in this Report.
The O to S aggregate estimates are drawn from ad-hoc Quarterly National Accounts figures used both for the numerator and the denominator. Data for these aggregates, at section level and covering the entire time series starting from Q1:2000, are available since March 2012. The reason for using National Accounts data is that none of the sources in the OROS-LES-VELA system completely covers the O to S aggregates, yet [4].
Figure 2 schematizes, for the overall aggregate B to S, sources used and length of the time series for which data for the compilation of the LCI are available
Figure 2. Scheme on the sources used for the LCI calculation by type and referring period
Series until reference quarter Qt:
Numerator
- Q1:2000 - Qt
- Q1:2000 - Qt
Denominator
- Q1:2000-Qt (*)
- Q1:2000-Q3:2007
- Q1:2000-Qt
Sources:
Numerator
- OROS survey (B to N)
- Preliminary and ad-hoc figures drawn from QNA (O to S)
Denominator
- VELA-LES (B to N)
- Backcasting on Structural surveys SCI-PMI (L)
- Preliminary and ad-hoc figures from QNA (O to S)
(*) Q4:2007-Qt for L section.
In the following two paragraphs more details are given on the methodology used for the estimation of each of the LCI component.
3.1.2. The numerator: labour costs
Regarding the B to N sections, the labour cost variables as well as employment are drawn from the integration of OROS-LES (figure 1). This source is aimed, at national level, at producing Fte (Full time equivalent) indicators on gross wage, other labour costs and total labour cost for Italian firms with at least one employee in the private sector (sections B to N of the Nace Rev.2 classification). Beside fulfilling the LCI Regulation, OROS-LES satisfies also the STS Regulation requirements on employment and wages variables (Rapiti et. al 2010; Istat, 2019).
The OROS-LES statistics are based on the combination of two sources: survey data are used to estimate large enterprises (hereafter LEs) and administrative data for the small and medium size enterprises (hereafter SMEs). Data on LEs (more than 500 employees) are drawn from the Monthly LES, that is a census survey. The administrative source, used for the estimate on SMEs, refers to the Social Security declarations of the employers for their employees to INPS. In order to get the target parameters the variables coming from the two sources are harmonized according to the statistical requirements and figures combined through a record linkage procedure (Congia et. al, 2008a, 2008b; Baldi et al, 2011; Istat, 2019).
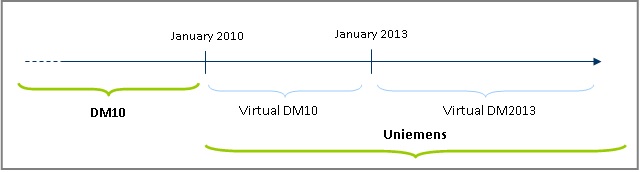
It’s worth mentioning that INPS administrative source in the last years has faced some radical changes that have affected the quality of the OROS-LES estimates in several directions: in a closest period, the adaptation to the new system had some drawback on the estimates, requiring higher efforts to guarantee the past standard of quality; in a longer perspective the overall indicators produced by the survey will highly benefit by the richer information made available by the change. The mentioned changes started in January 2010 (figure 3), when INPS abandoned the existent declaration system based on monthly forms to be compiled at firm level (the so called DM10 form) [5]. Since January 2010 INPS requires employers to compile a radically new and more complex form (Uniemens) containing information at employee level and some summary information at firm level. Moreover, several interventions aimed at rationalizing the collection of the administrative information have continuously been introduced.
The new Uniemens source would be an inestimable mine of information for Istat, but translating the new administrative data into statistical information will require a long exploration period to be mainly invested in the reconstruction of the necessary metadata, deeply changed with respect to the old system. For the OROS-LES purposes, in a first stage Istat continued asking INPS to download the so called “virtual DM10”, an aggregation of the Uniemens in the old DM10 form that INPS had, until December 2012, to perform for internal administrative aims. Starting from January 2013 INPS faced a further internal change, consisting in the abandoning of the virtual DM10 for the adoption of the new “virtual DM2013”, a more simplified and efficient reconstruction, at firm level, and for internal administrative aims, of the official Uniemes (figure 3). This further and unexpected change implied several difficulties for the OROS survey that had to adapt in a very short time the deeply complex procedures to produce, in the scheduled deadlines, the main outputs. The OROS team is still working on the simplification and reorganization of the procedures to exploit more efficiently the new DM2013 available information. This new exploitation strategy will imply, in the next future, many progresses in the production of the interest variables towards the transition, in a longer period, to the use of the Uniemens employee level information. An important advancement has been introduced in June 2024, in occasion of the transition of the main indicators produced by the three surveys to the new base year (2021=100), according to the requirements of the EBS Regulation (n. 2152/2019). In this occasion, the pre-treatment phase of the admin data (DM2013) has been completely re-disigned, implying the production of widely detailed micro data (employment and labour cost components by duration of the contract and by qualification of the employee, part time and full time).
Due to the transition to the new Uniemens system, during 2010 an unusual relatively lower number of DM10s have been received, confirming the expectation on the adaptation needed by the enterprises to the new system. The late reporters have been mainly LEs, those that have heavier administrative burden and very small enterprises, that have poorly organized bookkeeping offices. On the other hand, a greater quality (measurement errors) of the available preliminary micro data has also been verified due to a greater attention that INPS is paying on the collection of the more complex data. More recently, the transition to the DM2013 did not affect the delivery time of the models by the enterprises but implied a delay in the transmission of data by INPS, due to a significant IT reorganization in the Social Security Institute.
Figure 3 – Latest changes in the Administrative source at the basis of OROS
Regarding the availability of the administrative data for the estimates, every quarter INPS provides Istat with three data files:
a preliminary set of virtual DM2013s referred to the current quarter t, downloaded after about 45 days from the reference quarter. This set of data is used for the preliminary estimates of the target variables for quarter t;
a final set of virtual DM2013s referred to the quarter t-4, downloaded with a delay of about 1 year from the reference quarter, used to calculate the final estimate on quarter t-4;
an updated version of the INPS Business Register (INPS BR) acquired after about 45 days from the reference quarter, that gives structural information on the units at t.
The information on the firms classification by economic activity is drawn mainly from the official statistical Business Register (so called ASIA). Over the 90% of the INPS BR units match with ASIA. An additional administrative source, the Tax Register Data is additionally used to assign the activity code to those units not matched with the BR. They refer mainly to entries not found in the BR because of the updating time gap between the two sources. For the residual units a reclassification of the old Nace (Nace Rev. 1.1) codes, drawn from administrative information available in INPS BR, is carried out. In particular, the conversion from the old to the new Nace codes is based on ad hoc conversion keys that ensure a one-way attribution of the 2 digit new Nace economic activity code starting from the old ones. Finally, the BR and the Tax Register are also used to get information on the legal and institutional nature of the units aimed at the target units' identification [6]. The information on the Nace and on the other structural variables on the unit are fixed at the base year or at year the unit appears in the reference list for the first time. Information is changed only in occasion of the revision of the base year. This policy has been introduced very recently in the estimates of the Italian LCI figures in order to control for spurious short term dynamics due to reclassification of the units normally performed in the new versions of the Registers.
Each quarter the OROS-LES source releases a preliminary estimate on t and a final estimate on t-4 combining administrative data with statistical data on LEs. The final estimate differs from the preliminary because of the more complete and updated information that becomes available meanwhile. The intermediate t-1, t-2 and t-3 quarters may be affected by minor revisions, too. It is in particular the case of the release of June of each year, when the preliminary estimate on the first quarter is produced for the first time. In this occasion, due to the revision policy introduced by the LES, all the estimates referred to the last year are submitted to revision. Since April 2010, in fact, following a more severe enterprise recall practice, the estimates of the LES referred to the last year are recalculated to include the available data on the later responders. Being part of a system, data from the OROS-LES source are unavoidably subjected to all the changes that may affect both the involved sources.
As far as the O to S sections are concerned, the labour cost variables are drawn from QNA aggregates. The available administrative data are in fact not complete on the public sector, that highly characterises these sections. Data used for the LCI purposes, that are not published by the NA, are estimated through an ad hoc procedure that calculates the necessary indicators according to the LCI Regulation requests. As for the official QNA aggregates also these ad hoc estimates are obtained through a temporal disaggregation technique based on the annual NA aggregates and on quarterly reference indicators that are properly chosen. Because of in National Accounts official data are included regular and irregular workers an effort was done to estimate all figures with reference just to the regular employment. Main drawback of this choice is that the quarterly estimates so derived are not directly comparable with the official QNA aggregates.
3.1.3. The denominator: the hours worked estimate
It is in June 2010 that for the first time Istat officially began to release quarterly series on per-capita hours worked for the sectors B to N, covering a long-lasting data gap in the national statistics. This new indicator on the labour market is produced by the VELA survey integrated with the LES (figure 1).
Before the new release, very detailed monthly information on the hours worked were produced only on the basis of the LES and were limited to a specific set of firms, those with at least 500 employees (about 1.2 thousands of firms). Large Enterprises cover about the 20 per cent of the total employment in the Italian private sector (B to S excluded O Nace Rev.2 sections), but their behaviour is highly characterized in terms of seasonal pattern and overtime hours. The approximation of the per-capita hours worked of the total population with the only LEs subpopulation was therefore considered inadequate for the LCI purposes, and this is the reason why the previous method to estimate the LCI denominator used several business sources (structural and short-term) through benchmarking and quarterly disaggregation techniques [7].
VELA is a quarterly sample survey aimed at producing, together with indicators on the hours actually worked, rates on job vacancies. Until 2015's data acquisition, this survey was based on a representative set of firms covering the size classes from 10 to 499 employees (13,6 thousands of firms). Starting from 2016 the survey has been enlarged to all enterprises with at least one employee (12,4 thousands of firms have been added to the original sample). Although the new indicators representing all the sizes classes are published at national level since March 2020, the new time series are still available only starting from 2015 and longer time series have not been recostructed into the Vela production system, yet. Nevertheless, following the Covid events and the impact on labour input of the policy interventions necessary to contain the sanitary emergency, a correction to the hours worked compilation methodology into the LCI production process was necessary. In particular, since the second quarter 2020, a sharp decline in the per-capita hours worked was observed and this reduction was significantly larger in very small enterprises (those with less than 10 employees) than in the others. For this reason, the substitution of the per-capita hours worked from Vela-LES survey referred to the total population of Italian enterprises to those referred to enterprises with at least 10 employees was necessary. This intervention was introduced starting from the release of March 2020. The reconstruction of harmonized per-capita hours worked time series until 2000 was made by the Oros staff in emergency by an ad hoc procedure for the LCI purposes. This intervention is to be considered still provisional until the official time series will be available.
VELA sample is drawn from the Italian Business Register ASIA stratifying by economic activity, size class and multi-regional allocation. In the first quarter of each year, the 33 per cent of the sample is refreshed to consider firms’ demography.
The integrated VELA-LES source on the per-capita hours worked refers to hours actually worked, as normal time and overtime covering all private firms operating in the sectors of industry and services excluding agriculture (B to S excluded O Nace Rev.2 sections [8]), being the indicators on the P to S sectors published starting from December 2013 [9].
The quarterly indicators on the hours worked follow a revision policy affected by the practices of VELA, LES and OROS sources. In §2 '3.1 Source data' the OROS-LES practices have been explained. According to LES and OROS policy, VELA planned to introduce yearly revisions of the per-capita hours worked indicators, to be published with the delivery of the first quarter. Nevertheless, differently from OROS and LES, given the VELA estimation method, the last two years of the hours worked indicators will be affected by these annual revisions.
As in the OROS-LES sources used for the numerator, VELA-LES do not provide information on the hours worked for LCI on the O to S sections, mainly because the public sector is not covered by the two surveys. The lacking information is drawn, since March 2010, from NA sources. The indicators on hours worked from the NA sources are obtained through an ad hoc procedures of temporal disaggregation technique based on the annual NA aggregates and on quarterly reference indicators properly chosen. Figures may be subjected to revisions depending both on methodological interventions (non standard revisions), both on revisions of the sources used in the estimates (standard revisions).
The QNA standard revision policy of raw data, input in the LCI process, from 2017 follows the scheme reported below, detailed by quarterly release:
first quarter of a (LCI release of June a), the entire last four years (until a-4) are revised;
second quarter of a (LCI release of September a), t-1 and the entire last four years (until a-4) are revised;
third quarter of a (LCI release of December a), the entire series are revised to incorporate the Annual NA figures released at the end of September;
fourth quarter of a (LCI release of March a+1), t-1, t-2, t-3 and the entire last three years (until a-3) are revised.
Figures on the hours worked illustrated in this Report refer to annual NA series till 2023 and quarterly NA aggregates with reference to the Q1:2024 delivery.
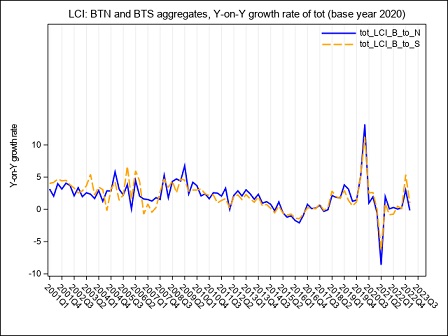
The year on year growth rates, calculated on the raw LCI index on total labour cost, referred to the B-S and B-N aggregates are compared in figure 4. The graph underlines a divergence between the index calculated on sections B to S and the index calculated on sections B to N, whose magnitude varies along the considered time series: the inclusion of the O to S aggregate in the calculation of LCI leads to a higher variability during the period Q4:2005 - Q4:2006 when the contracts for public employees were renewed. In the following years, up to 2017, it is worth noticing that the inclusion of O to S aggregate in the LCI index involves a general reduction in the evolution of the year on year growth rates probably due to a generalized freeze on the collective labour agreement in these sectors. Starting from Q1:2018 public employees were interested by a general renewal of the collective pay agreements implying the payment of arrears covering the last two years, as clearly emerges from figure 4 in Q1:2018. During 2019 it is the B to N aggregate that shows higher rates of growth of the totale LCI, due to a reduction in hours worked recorded in several private sectors.
Starting from Q1:2020, the interruption/reduction of the activity of many enterprises due to the Covid crisis, affecting particularly the months of April, May and, even if less intensely, June, implied an exceptional decrease in hours worked, observed in almost the private sectors. When smart working was not possible, this activity reduction was supported by recurring to different kind of temporary absence from the work place, like holidays, temporary leaves, at first and then, intensely, to short-time working allowance (this last scheme is supported by Social Security). As a consequence, the total labour cost decreased, too, but with a lower intensity than hours worked, implying a general increase in the LCI. During the summer months, the Italian economic activity showed a slight recovery, implying a reduction in the decreasing trend of the hours worked. Additionally, a return of the labour demand composition to the pre-crisis asset and the absence, in third quarter 2020, of additional wages’ components payed in the previous quarter, implied a recovery of the labour cost components to a lower and more regular dynamic. As a consequence, in Q3:2020 the hourly labour cost showed a very low year-on-year increase and a decrease in terms of quarter-on-quarter changes. Due to a slight epidemic recovery in the autumn months, some restriction measures were newly adopted, implying a downturn of the economic activity particularly marked in some sectors. This downturn affected hours worked, that showed a more pronounced decrease in comparison to the decline recorded in the previous quarter, when economic activity showed a slight recovery. implying a slight increase of the LCI. In the second half of 2020, particularly in Q4:2020, in order to relaunch economic activity, some measures aimed at lowering social security contributions, through various relief, were introduced in private sectors. The effect was a general decrease, until Q2:2021, of the growth rates of the hourly other costs (and by this way of the total) component that was more intense than that of the corresponding hourly wages. In Q3:2021, the growth rate of the other costs was positive but, due to the persistence of some reductions of social contributions, less intense than the increase of wages. In Q4:2021 the growth of the hours worked component was more intense than that of wages, particularly in the P to S sectors. On the other hand, other costs recorded a generalized higher growth than that of wages, as a result of the reduction of the effects of the measures aimed at lowering social security contributions.
In Q2:2022, relevant renewals of some collective agreements in Public Administration implied an exceptional increase in wages, other costs and total costs of section O affecting also the economic aggregates that include this sector.
In Q4:2022, relevant contract renewals have been applied in some Public sectors, these renewals and the related arrears, have particularly affected the dynamic of wages and consequently of other labour costs in section O and P.
In Q1:2023, both total labour costs and per-capita hours worked increased at a fast pace. In particular, wages growth was a consequence of the payment of several arrears and una-tantum while the increase of other costs was due to a gradual return to the pre Covid levels that, during the pandemic, were reduced to support enterprises.
In Q2:2023, it is the B to N aggregate to show a faster growth due to sever contract renewals particulary in the industrial sector. This growth persists for the whole year.
Figure 4 – The LCI index on hourly total labour cost in the B to N and B to S Nace Rev.2 aggregates. (y-on-y growth rates Q1:2001- Q1:2024)
3.1.4. Main changes due to the transition of the data sources to the new base 2021=100
According to the European Business Statistics Regulation (EU n.2152/2019 and related Implementing act n.1197/2020) with reference to Short-term-Statistics, in occasion of June 2024's release OROS-LES and VELA-LES sources have been involved in the change of the reference year of the main indices produced, passing from base 2015=100 to 2021=100. New time series for the sections from B to N have been calculated, quite all available from Q1:2000 at section level of the Nace Rev.2 economic activity classification [10].
As far as the LCI is concerned, 2020 will continue to be the reference year until 2027 and the transition to the new base (2024=100) will occur with the first transmission of Q1:2027, i.e. in June 2027.
Being the result of an integration of OROS-LES and VELA-LES data, the Italian LCI for the sectors from B to N, and related aggregates, has been affected by the main changes introduced with the transition of the sources to the new base:
a) in the VELA-LES source the transition to base 2021 consisted mainly in:
refreshment of the enterprises' panel, affecting the time series from Q1:2021 onwards;
acquisition, in the VELA-LES estimates, of the OROS-LES micro and macro data starting from Q1:2021, according to the new base (for the relationships between variables into the OROS-LES-VELA system see '3.1.1. The LCI as an output of an integrated system').
b) in the OROS-LES source, this transition was the chance to introduce some improvements concerning definitional and methodological aspects. Among these improvements, those that affect the LCI are:
the refreshment of the LES panel;
the improving of criteria (rules) to define the OROS target population, in particular by using updated information on the legal and institutional nature of the units from the BR (Asia 2021);
the progresses in the estimation accuracy of some components of the other labour costs and of wages in the OROS survey, to incorporate more updated and detailed administrative information useful to translate the admin forms (Social Security declarations to INPS - virtual DM2013) in statistical concepts. Additionally, a review of the methodology for the calculation on total jobs of those positions caracherized by a shorter working time (on-call and temporary workers). Finally, a complete re-design of the treatement of this source has been performed, implying the availability of a reacher detail on the single target variables.
All these improvements in the OROS-LES source have been introduced, at enterprise level, from Q1:2021 onwards. In order to get coherent time series starting from Q1:2000, the spans of the time series of the OROS-LES target variables, available according to the two different bases, have been harmonized applying link coefficients (see '8.2 Comparability - over time').
Figure 5a below puts in evidence the main effects on the LCI, in the B to N Nace Rev.2 aggregate, of the transition of the OROS-LES-VELA sources from the old to the new base. The year-on-year growth rates calculated according to the two bases, raw format, are compared. Due to the methodology used for the recontruction of the time series, differences affect only the time span starting from Q12021 and are quite negligible, both on total labour cost and on hours worked, as underlined by the graphs (figure 5a, 5b and 5c). Main responsible for the LCI revisions in this period is the refresh of the LES panel.
Figure 5a – The LCI index on the hourly total labour cost in the B to N Nace Rev.2 aggregate according to VELA-LES and OROS-LES sources, base 2015 and base 2021. (Y-on-Y growth rates Q1:2001-Q4:2023)
Figure 5b – TLC in the B to N Nace Rev.2 aggregate according to OROS-LES sources, base 2015 and base 2021. (Y-on-Y growth rates Q1:2001-Q4:2023)
Figure 5c – HW in the B to N Nace Rev.2 aggregate according to VELA-LES and OROS-LES sources, base 2015 and base 2021. (Y-on-Y growth rates Q1:2001-Q4:2023)
[1] For further details about LES refer to the Information System for Survey documentation and Quality Control (Siqual), available on Istat’s Internet website: (Siqual istat).
[2] Further details on VELA can be found in the Siqual website: (Siqual istat).
[3] For a brief description of the OROS survey see Rapiti et al. (2010), Istat (2019) and at the Siqual website: (Siqual istat).
[4] Since December 2013 the production domain of the OROS-LES-VELA system has been enlarged to the P to S aggregates, being the target population the private firms. This system has been furtherly improved in the P to S domains in occasion of the transition of the three surveys to the new base 2015=100 in June 2018. In the next future this extension would imply a gradual integration of the NA source with the OROS-LES-VELA in the estimates of the private part of the P to S aggregate for LCI. The NA source will therefore be used only to calculate the public sector aggregates. It is worth informing that the current asset of the Italian Social Security System is going to be interested by a radical change. Since the beginning of 2010 various agencies managing Social Security for various categories of workers (including the public sector) are going to be gradually centralized around INPS. This change will imply, in the future, the building and development of one complex IT architecture, where all the Social Security information will converge. This could imply the availability of a coherent system of admin data, covering all the employees and the economic aggregates for the production of more consistent official statistics. Recent studies have been set up at Istat to exploit the data flow on the public sector. Many interesting evidences have already been drawn but several studies are still necessary to translate the admin data into statistical concepts.
[5] For further details on the DM10s declaration system see the LCI 2009 Quality Report.
[6] The exploitation of this further information from the BR and the Tax Register was as essential step to allow OROS coverage extention to personal service activities (P to S Nace Rev.2 sections), implemented in December 2013 (for further details see §4 '3.1 Source data' in QR2013).
[7] For a description of the past technique to calculate the hours worked see the LCI Quality Report 2009-2012.
[8] In the “administrative and support service activities” (N section of Nace Rev.2), the temporary employment agency activities (78.2 of Nace Rev.2) are excluded both from VELA and LES.
[9] Information on the P to S sectors have been collected since the first quarter of 2010, to the limited extent of the job-vacancies and hours worked indicators. In occasion of the transition to the new base 2015=100 (STS), for large enterprises information on the P to S sectors have been enlarged also to labour cost variables starting from the first quarter of 2015.
[10] An exception is the time series of the hours worked by VELA-LES for section L, available since Q4:2007, as already explained in '3.1 Source data'.
3.2. Frequency of data collection
The following table shows, for the different components of the LCI, sources, frequency and timeliness of the data used for the quarterly compilation of the index.
Table 1 – Sources, frequency and delay for the different components of LCI
3.3. Data collection
See concept '3.1 Source data'.
3.4. Data validation
All the LCI data are processed in an extensive and complex way that ensures the most relevant statistical quality, problems are identified and addressed correctly and systematically each quarter. Thus the Oros survey is characterized by pervasive checks in all phases and the same is true for the other data (Hours worked from VELA-GI and National Account). A lot of complex preliminary checks aimed at investigating and possibly correcting errors on administrative and survey data are carried on at micro level. Final key checks on macrodata are carried out to be sure that no residual influential errors, or legislation changes not correctly reported in the previous steps are still present in the data. Validation is extended also to calendar adjusted and seasonally adjusted data. The evaluation of eventual incoherences in terms of year-on-year (CA) and quarter-on-quarter (SA) changes between components and related aggregate and of the revisions of previously released data are key steps in the validation of the adjusted data. CA coefficients (sign and magnitude) are also checked.
A final validation of the Italian LCI is also based on the comparision of figures drawn from other Istat statistical sources (Oros indicators and quarterly National Account estimates on wages and total labour cost). Some evaluations on wage bargaining effects are also possible by comparing LCI estimates to the Indices of wages according to collective agreements (contractual wages). Furthermore, certain known relationships between variables whose coherence has always to be guaranteed, as the ratio of other labour costs on wages, are deeply examined.
3.5. Data compilation
The components of the Italian labour costs are measured in Euros, current prices. The Total Labour Cost, as well as the NACE aggregates are obtained as weighted averages respectively of wages and other costs and of the single sections values. For more details see the concept '3.1 Source data'.
3.6. Adjustment
Seasonally and calendar adjusted data are also provided. For details on procedure and approach see concept '6.4 Seasonal adjustment'.
4.1. Quality assurance
LCI is based on the standard Istat systematic approach to quality following the International and European standards. Istat reference framework for quality policies relies on the 2005 European Statistics Code of Practice (last revised in 2017) on Eurostat Quality Definition and on the recommendations of the Legislation on Quality, approved by the Members States of the European Union in 2001. The Data Quality Assessment Framework, developed by the International Monetary Fund, also represents an important reference, especially for economic statistics and for National Accounts. Following the principles of the European Statistics Code of Practice, Italy has recently adopted the Italian Code of Official Statistics, O.G. n.12 of 16 December 2021 updating the previous (O.G. n. 240 of 13 October 2010), in order to promote quality improvements of the statistics produced by the Italian National Statistical System.
With the aim of strengthening the commitment to quality, in 2020 Istat set up the Quality Committee, for overseeing all quality initiatives in the Statistical Institute. In addition the role of Quality Manager was formally established. In 2021 a new quality policy for statistical production was adopted. It is consistent with the European quality framework developed by Eurostat, and transposes its main principles and definitions. The new Istat quality policy takes advantage of the results already achieved over the years. It includes concrete and operative actions to relaunch and update quality policy consistently with the new productive context. Istat continues to invest on tools for monitoring, evaluating and improving the quality of statistical processes and products, such us documentation systems, quality indicators, quality guidelines and quality reporting. A special attention is given on procedures for the quality assessment of statistical processes according to the type of statistical process, in terms of their maturity level on the quality and methodological frameworks (more details at the ISTAT website (Quality commitment).
4.2. Quality management - assessment
Quality monitoring is based on the analyses of standard quality indicators, also managed in the Information System for Survey Documentation and Quality Control (SIDI/SIQual). Both qualitative information and quality indicators related to each single phase of the production process are managed. Regular reports to the top management on process quality are prepared also by analyzing information from the SIDI/SIQual system.
Quality pilots, trained in process documentation and quality evaluation, are in charge of updating information and calculating standard quality indicators at process level. Recently, Istat worked on the set-up of a shared framework for internal governance of the quality in data and underlying processes and the development of an easily accessible platform where information on practices and measures of revisions is made available to stakeholders (Istat website at website (Revisioni) (Piras M.G., Tuzi D. 2018).
The overall quality of the Italian LCI can be considered good.
5.1. Relevance - User Needs
Referring to the satisfaction degree of the users, Italy meets the requirements defined within the European Statistical System. At the moment the LCI is not released at national level. National users frequently require these figures directly to Istat, that addresses to the EUROIND database and to the metadata available on the EU web. National users express also the need of quarterly levels instead of indices possibly with an higher Nace breakdown. Italy does not provide officially this information even at national level, yet but future enhancements are under examination: the availability, since June 2019, of hours work estimates also for the population under 10 employees opens a new and highly interesting scenario.
The LCI results should provide a sound empirical foundation for decision-makers in national wage negotiations and social and economic policy, and should also establish reliable and harmonized comparisons of the evolution of labour costs among European countries. Furthermore, until April 2015 the LCI transmitted by the Member States allows Eurostat to estimate the annual hourly Labour Cost levels (See this website Hourly labour costs) based on the Labour cost data drawn from Labour Cost Survey every four year (the last available refers to 2020).
The data had not been released at national level but main users of the indicators should be the Ministry of Labour, the Ministry of Economy, trade unions (CGIL, CISL, UIL), employers' associations (Confindustria, etc.), Members of Parliament, political parties, research centres, universities and the media. All those potential users already use the national Oros per Fte similar indicators.
At international level the hourly LCI has been delivered to Eurostat with a confidentiality status on the last quarter data until June 2011. With the delivery of September 2011, this flag has been removed, implying the diffusion of the entire time series of the Italian LCI in the Eurostat News Release on the labour cost and in Eurostat's Database. The hourly LCI referring to the O to S aggregates have been delivered to Eurostat since March 2010. At a first stage data were delivered only at aggregated level. In March 2012, thanks to the availability of the NA aggregates, time series were compiled also at section level, but delivered only in raw format. Since June 2012 also CA and SA versions are provided. The raw series as well the CA and SA series are flagged as “free”. When using the LCI data on the O to S sectors and related aggregates, it is to be considered that they are calculated on the basis of provisional figures extracted through an ad hoc procedure drawn from annual and quarterly NA aggregates (see '3.1 source data'). It is worth remarking that these data are not published by the National Accounts production sector. The LCI is the result of the integration of several sources, each characterized by its own practice in revising figures, as a consequence of methodological changes, of the availability along the time of more update information etc.. These changes are not directly under the control of the researchers compiling the LCI. As a consequence, non negligible revisions in each source may affect the LCI.
5.2. Relevance - User Satisfaction
The LCI is not published at National level. The only perceptions we have about the Italian LCI's users satisfaction are those related to the direct contacts through e-mails or telephone calls aimed at obtaining data on the hourly Labour Cost. Italian users are satisfied about the opportunity to have an index commisurated to the hours worked (published by EU at section level, NSA, CA, SA) to be compared/used instead of/combined to the full-time equivalent commisurated one (published by Istat at section level, NSA and SA).
5.3. Completeness
Since June 2005 Italy delivers to Eurostat raw, calendar adjusted and seasonally adjusted time series of the LCI per hour worked. The total number of delivered sections and related aggregates accounts for 14 indicators (thirteen sections plus the total B-N) for each variable (Total labour cost, Gross wages, Other labour costs) equal to a total of 42 time series to be delivered in raw, calendar adjusted and seasonal adjusted format (126 indicators on the whole). The starting date is Q1:2000 for the series from B to N.
Starting from December 2009 the time series on O to S and B to S aggregates were also produced for a total of further 6 indicators (2 indicators for 3 variables). Since March 2012 these aggregates are produced also at section level (further five sections for 3 variables). Initially these indicators were produced only in raw format. Starting from the delivery of June 2012 they are provided also in calendar and seasonally adjusted format. The starting date is Q1:2000 also for the series from O to S. More recently, starting from December 2016, 8 additional aggregates have been added: B to E, B to F, B to S excluded O, G to J, G to N, G to S, K to N, and P to S all in raw, calendar and seasonal adjusted format, enlarging noticeably the delivered indicators: at the moment Italy provides a total of 261 LCI quarterly indicators and 54 annual aggregates as weights. Furthermore, since December 2016, Italy delivers on a volountary basis the 4 LCI component variables expressed as levels i.e. LC_T (total labour cost), LC_WAG (wages), LC_O (other costs), HW (hours worked) all only in raw format.
The only remaining deviation from the EU concepts is the exclusion in the LCI definition of the “subsidies”. At the moment, the sources used for the estimation of the other labour costs component “employers' social contributions plus taxes paid by the employer less subsidies” do not allow the exclusion of the subsidies, that in Italy are yet not present or negligible.
5.3.1. Data completeness - rate
100%.
6.1. Accuracy - overall
In the Italian process for the compilation of the LCI a high attention is paid on the qualitative and quantitative evaluation of accuracy and reliability of the estimates. The nature of the sources used (mainly admin) implies pervasive checks and editing also according to non-standard rules because of the frequent changes in the structure or content of data due to legislative and/or IT reasons. Given the nature of the sources the attention is on non-sampling errors. Revision analysis is deeply used as a strategic tool to fine-tune the statistical process.
Assessing accuracy on the Italian LCI data requires taking into account at least two main aspects:
the index is compiled through a mix of sources (administrative, survey and National Accounts data);
each source used in the estimation of the LCI is subjected to revisions, not always following a scheduled plan, to include in the next versions of estimates more updated information.
In the paragraph the main accuracy concerns of the Italian LCI data are described. The focus is on the non-sampling errors [1] (coverage errors, measurement errors, non-response errors, processing errors). The revision process and some revision indicators on the raw data are also presented and, finally, method, practices and accuracy of the seasonally adjusted LCI data are described.
[1] In the description of the error issue, the major attention is devoted to the explanation of the problems arising from the treatment of the administrative and LES sources used for the estimation of the LCI numerator. As far as it concerns the hours worked, more details on the VELA E&I process can be found in the methodological section of the national press release available at the website: ISTAT archivio.
6.2. Sampling error
Not applicable.
6.2.1. Sampling error - indicators
Not applicable.
6.3. Non-sampling error
See sub-points.
6.3.1. Coverage error
Coverage is evaluated comparing data on regular employement used at the basis of the calculation of the Italian LCI with data from the Quarterly National Accounts. Because figures on the sectors from O to S are estimated using Quarterly National Accounts data exclusively (see '3.1 Source data', '8.5 Coherence - National accounts'), the comparison is limited to the sectors from B to N (coverage is complete on the O to S aggregates). Furthermore, because the Italian National Accounts source does not provide the detail on the number of managers, data from QNA used here for the comparision refers only to the total number of employees. Data according to the ESA 2010 are considered, at the moment available until year 2021. Excluding managers the coverage of the LCI on the B to N Nace Rev.2 aggregates is quite 100%; including managers coverage is 101% [1].
At the moment no model or estimation criterion has been considered to adjust the data on the private sector to include managers and the impact of this exclusion has never been calculated.
Table 1 - Coverage of the LCI compared to NA ESA-2010 (number of employees in the B to N Nace Rev 2 sections). Year 2021
Source
Number of employees
(A) LCI - Total employment excluding managers
11,826,561
(B) LCI - Total employment (*)
11,931,856
(C) NA – ESA10 annual data, regular employment
11,810,900
(A)/(C) %
100.1
(B)/(C) %
101
(*) From the OROS survey it is possible to estimate the number of managers but, given the current methodology, not their wages. On this aspect some enhancements are in program, regarding both the coverage of the LES survey that, since 2015, has started collecting data on the managers' labour cost and labour input, both the improvement of the methodology used to calculate the labour cost components for this category of employees from admin data.
Geographically the LCI covers the whole country.
In the LCI the labour cost is defined as the sum of two components:
gross wages, which comprises all the payments, both regular and not regular, including worker social security contributions and taxes (wages and salaries in kind are partially excluded);
employer social contributions (only actual legal contributions with the exclusion of the imputed ones).
All labour cost items included in the above definition are collected at monthly frequency from the same two sources (INPS administrative data and Istat LES survey). For a specific other labour cost component also annual data are used, deriving from INAIL (National Institute of work accidents). Only the variable “subsidies received by the employer” is still excluded in the calculation and, at the moment, the sources used do not allow the estimation of this item, yet not present or negligible in the Italian tax legislation.
[1] The discrepancy between the figures drawn from the two sources are evidently the consequence of differences in definitions and methodology. In particular, the main divergences stand in the estimation of those categories of workers that are characterized by a non standard work time (jobs on call, temporary workers and workers receiving short-time working allowance). Since June 2024, the metodology for the inclusion in the total number of Oros jobs of on-call and temporary workers has been changed (see '§3.1.2 The numerator: labour costs'). Their contribution to labour inpt has been re-evaluated according to different criteria, implying a slight increase of total employment. These changes have contributed to an improvement of the closeness between Oros and NA jobs estimates.
6.3.1.1. Over-coverage - rate
Not applicable.
6.3.1.2. Common units - proportion
Not applicable.
6.3.2. Measurement error
Once administrative data from the National Social Security Institute (INPS) are captured an extensive and complex check and editing procedure covers the whole Oros production process (for more details see Congia et al, 2008a and 2008b; Istat, 2019). The translation of administrative data into statistical information is the first step: in this phase checks are necessary not to correct administrative micro data, that have a rather good quality, but to detect eventual translation procedures and metadata errors that follow the frequent changes in administrative concept and definitions. Once the statistical variables have been made available, a more traditional micro level check procedure becomes necessary. Outliers correction may consequently be needed, particularly in the case of influential observations. Check and imputation of the outliers in the LES data follow a traditional interactive process, in which there can be a direct feedback with the firms. For the administrative INPS data extensive edit procedures check for accuracy and consistency. Given the enormous number of records to check, the editing procedures are based on selective criteria. Automatic editing is utilised in very few cases. The micro editing process includes the comparison of the values of the main variables to be published (e.g. number of employees, wages per employee, other labour costs, etc.) reported for t and t-4 (t-4 is preferably considered due to the high seasonal behaviour of the target variables and because of the availability of a final estimate on a total population on t-4) by the same unit and publication domain. The aim is to detect large changes or influential non-responses. Units are selected on the basis of the contribution of the single unit to the total growth rate of each target variable by economic activity domain (divisions of Nace Rev. 2). Thresholds for the selection of the units have been fixed on the basis of distribution analysis. Records resulting influential are isolated and furtherly checked, in order to detect if the outlier values are due to non reporting units or measuring errors generated along the process (errors in the original admin data are quite absent as a consequence of very scrupolous checks in the data input software used by enterprises to compile the admin forms (see §2 '3.1 Source data')), or are correct values (i.e. legal tranformation of the unit). If the value is considered erroneous, it is replaced by an imputed one, calculated using auxiliary information on the target variables available for the same unit at t or t-4. In principle this process ought to allow to make reliable statistics, however some errors in small size units remain undetected, and some could show up only after micro-data aggregation. The preliminary population is extremely large but the number of units which are singled out as relevant edits is very low.
6.3.3. Non response error
At the scheduled time for the acquisition of the provisional population, it may happen that some INPS data are missing for the preliminary estimates due to delays depending on firms liability or administrative system flaws. These late reporters are considered unit non-responses and, in normal conditions, range around 2-2.5% of total units recorded by Oros. During 2010 the number of available DM10s for the preliminary estimates has decreased, due to the transition to the new Uniemens system (see §2 '3.1 Source data'). High late reporting rates have been recorded during all the year 2010, with a peak in the June when delayers accounted for about the 9% of the units recorded by Oros. Non reporting has gradually reduced and a certain stabilization to the past data framework has been observed only starting from 2014: between 2011 and 2013 delayers accounted for about 3%-4%, partly due to the more complicated forms to be compiled from enterprises, partly due to an IT reorganization at INPS, that has directly influenced the availability at the programmed deadlines of preliminary data in the required format. In the overall these non-responses were and are still characterized by a MAR (Missing At Random) nature, and do not significantly affect the wage and other labour cost changes estimates. Imputation of non reporting units is thus not necessary [1].
[1] Imputation is nevertheless necessary to produce the estimates on the total number of employed persons, as required by the STS Regulation, and for the National Release, also used for the VELA calibration procedure (see §3 '3.1 Source data'). Correction for non reporting is at the moment performed through a micro level approach that exploits the reporting and non reporting behaviors of the single units over the time.
6.3.3.1. Unit non-response - rate
Not applicable.
6.3.3.2. Item non-response - rate
Not applicable.
6.3.4. Processing error
Not applicable.
6.3.4.1. Imputation - rate
Not applicable.
6.3.5. Model assumption error
Not applicable.
6.4. Seasonal adjustment
The adjustment of the Italian LCI time series is performed through a Reg-ARIMA model-based approach using TRAMO-SEATS (Linux 942 version). The seasonal adjustment strategy is based on a partial concurrent adjustment approach that implies models, filters, outliers and calendar regressors to be re-identified once a year and the respective parameters and factors re-estimated every time a new or revised data becomes available. This approach is aimed at minimising the frequency of revisions while guaranteeing accurate seasonally adjusted data at any given time point. Before the adjustment for seasonality, the series are pre-treated for calendar effects according to the ESS Guidelines on Seasonal Adjustment (Eurostat, 2015); this pre-treatment is performed only for those series showing significant and plausible effects. A country specific calendar regressor is used.
Details on the Italian LCI seasonal adjustment procedures and models are summed up in the Template for quality reporting on SA of LCI attached as Annex in this paragraph, as agreed at the LAMAS-LMI meeting of October 2019.
The calendar and seasonally adjusted Italian LCI time series are produced according to an indirect approach (Ciammola, Tuzi, 2010 and 2015): the total labour cost aggregate by section, as well as the totals of each labour cost component are derived by summing up the related adjusted component series [1]. A hierarchical calculation sequence must be followed: firstly the total labour cost by sections are calculated from wages and other costs and secondly the sum by section for each of the three variables brings to the respective LCI totals. Once the indirectly corrected series are constructed, they are checked for the presence of spurious calendar and seasonal effects.
The transition to the new seasonal adjustment approach has been stimulated by several drawbacks produced by the direct approach. This latter was, at a first stage, chosen to overtake some of the complexities of the LCI system of time series. Firstly, the volatility of the hours worked at the denominator, that would have significantly benefited by the independent adjustment of the single time series. Furthermore, to prevent the aggregates by spurious seasonality due to the low quality of the ARIMA models estimated for some of the components, particularly the other costs series by definition more volatile than wages. On the other hand, the direct approach does not guarantee consistency between the adjusted aggregate and its components [2]. In the case of the Italian LCI indices, this problem was particularly noticeable in relation to the total labour cost aggregate, because of the number of the composing variables (only two) and the fact that although highly correlated, the components may be affected by different exogenous interventions (changes in regulations that involve only the other costs, occasional payments not subjected to social security contribution, etc.).
All the time series provided to Eurostat are now delivered in raw, CA and SA format (18 sections + 11 totals: B to N, O to S and B to S and the new aggregates B to E, B to F, B to S excluded O, G to J, G to N, G to S, K to N, and P to S, see § 5.3).
[1] The transition to the indirect method has been made possible by the existence of an additive relation between the aggregates and the related components. This relation is easily obtainable for the total labour cost index by section, that can be expressed as linear combination of the simple indices of the two components, wages and other costs. As far as the aggregation over the economic sectors the question entails some more complications due to the chain linking. In fact, this passage inhibits the additive property that characterizes the Laspeyres index. As a result the indices for the totals cannot be compiled by simply aggregating the sectorial elementary indices through the original weighting system used to get the Laspeyres but they should be adjusted to include the chaining. In order to re-establish additivity a new weighting system was derived by applying a correction to the original weights that implicitly incorporates the chain links (Ciammola, Tuzi, 2010 and 2015).
[2] Referring to coherence in terms of q-on-q growth rates, inconsistency between an aggregate and its components is intended when q-on-q aggregate growth rates are not included in the range of the q-on-q growth rates calculated for the components.
The Italian LCI raw indicators are released in a preliminary version followed by revised figures. The discrepancy between the preliminary estimate and later ones depends on various factors affecting differently numerator and denominator. As illustrated in figure 2 of concept '3.1 Source data':
the numerator for the B to N sections depends on the revisions of the OROS-LES indicators. In a standard practice of revisions, figures that contribute to this aggregate’s estimate are revised four times before they become final, that occurs after one year from their first publication. The main reasons of revision are:
the final version of the administrative micro data which are checked by INPS, substitutes completely the preliminary version (which is checked and edited only by Istat);
non reporting units in the preliminary data are present in the final version;
some variables based on other external sources (e.g. Nace Rev.2 economic activity classification from different edition of the BR, the INAIL Social Security rate, etc.) are computed and estimated using the most updated version of the data;
the annual revision of the LES data referred to the previous year, included in the OROS-LES estimates yearly, in the delivery of the first quarter;
non standard revisions (any other not regular revision).
the numerator for the O to S sections depends on:
the revisions of the quarterly NA estimates that depend on the infra-annual revisions of the sources used in the context of the Quarterly National Accounts as indicators to disaggregate the Annual estimates and on the revised version of the Annual estimates normally incorporated in the quarterly data in the releases of March and December [1];
beside the revisions of the annual and quarterly sources, NA figures used for the LCI can be affected by improvements in the methodology used to calculate the ad hoc indicators. This implies that a longer span of time of the LCI time series than the standard one may be affected by revisions;
non standard revisions (any other not regular revision).
the denominator for the B to N sections depends both on the revisions in the VELA-LES indicators on the hours worked, and on revisions on the OROS-LES jobs' estimates:
as far as the VELA-LES source is concerned, a scheduled revision plan of the hours worked is now consolidating. Beside the annual revisions due to the publication of final LES data, that affect the last year figures, the VELA-LES estimates are annually revised to include the last two years OROS data on jobs;
non standard revisions (any other not regular revision).
revisions of the denominator of the O to S sections may occur because of the same reasons already explained for the related numerator.
As regards the calendar ad seasonal adjusted data, revisions take place for two reasons: first, due to the availability of revised raw data; second, because of a better estimate/identification of the seasonal pattern due to the information provided by new unadjusted data and/or due to the characteristics of the filters and procedures removing seasonal and calendar components (For further details on seasonal adjustment procedures and models see the Template for quality reporting on SA of LCI attached as .xls file in the Annex of concept '6.4. Seasonal adjustment').
[1] For details on the main changes introduced in the Annual National Accounts estimates according to ESA 2010 classification see at webiste (archive).
6.6. Data revision - practice
Revisions of the raw Italian LCI come from the revisions of the sources used for its compilation. The differences of the preliminary estimates and later ones depend on various factors affecting differently numerator and denominator, as illustrated above in concept '6.5 Data revision - policy'. The most significant revisions are registered each year in June when the first quarter of the year is released and several revisions, introduced by the different surveys, are used.
According to the partial concurrent adjustment approach (see concept '6.4'), each quarter, the appropriateness of the models identified once year and the results of the seasonal adjustment process are evaluated analysing the quality measures and diagnostics provided by TRAMO-SEATS. More in depth analysis on revisions and stability of the estimates are considered when models are re-identified once a year. In this step the diagnostic facilities available on JDemetra+ version 2.2.2 are also used (For further details on seasonal adjustment procedures and models see also the Template for quality reporting on SA of LCI attached as Annex of concept '6.4. Seasonal adjustment').
6.6.1. Data revision - average size
In this paragraph revisions are presented through some statistical measures, focusing both on unadjusted and seasonal adjusted data.
1) Unadjusted data
Revisions of raw LCI data are evaluated through the analysis of the y-on-y changes. The last five vintages of unadjusted data are compared.
Tables 1 and 2 below show the year-on-year quarterly growth rates and the revisions on the annual growth rate for each quarter of the total LCI in Nace Rev.2, respectively, for the B to N and for the B to S aggregates. Revisions reported in the tables refer to the quarters from Q1:2021- Q4:2023 and are observed along the last five deliveries. They are calculated as difference between the last release (Lt) and the previous release (Pt).
The remarkable decrease of the LCI in the first quarter of year 2021 reflects the effect of some Covid-19 support measures aimed at lowering social security contributions, through various relief, introduced in the second half of 2020 in private sectors. The effect was, until Q2:2021, a general decrease of the growth rates of the hourly other costs (and by this way of the total) component that was more intense than that of the corresponding hourly wages and that, in this last quarter, was also a counterbalance of the exceptional increase recorded in the same quarter of one year before. In Q3:2021, the growth rate of the other costs was positive but, due to the persistence of some reductions of social contributions, less intense than the increase of wages. In Q4:2021 the growth of the hours worked component was more intense than that of wages, particularly in the P to S sectors. On the other hand, other costs recorded a generalized higher growth than that of wages, as a result of the reduction of the effects of the measures aimed at lowering social security contributions. In Q1:2022 the LCI turned back to the pre-Covid (second half of 2019) growth rates levels. In quarter Q1:2023, both total labour costs and per-capita hours worked increased at a fast pace. In particular, wages growth was a consequence of the payment of several arrears and una-tantum while the increase of other costs was due to a gradual return to the pre Covid levels that, during the pandemic, were reduced to support enterprises. In coherence with the economic growth recorded in this quarter in Italy, hours worked recorded a significant increase related both to an increase of employment and of their per capita labour input.
Analysing the B to N aggregate (table 1), some relevance have the revisions recorded in the release of June 2024; that mainly depend on the methodological innovations introduced in occasion of the transition to the new base 2021=100 of the OROS-VELA-LES indices as required by the EU-STS regulation. In this occasion, while OROS has revised figures from the first quarter of 2000, VELA-LES has introduced revisions from the first quarter of 2021 (see '§3.1.4 Main changes due to the transition of the data sources to the new base 2021=100' and '§3.1 Source data').
Looking at the B to S aggregate (table 2), the O to S aggregate has not been yet involved in the changes of the transition to the new base 2021=100, because the variables involved in the LCI for these sections are drawn from National Account sources. In addition to the B to N revisions listed above, the revisions of the ad-hoc estimates of the O to S sections drawn from the NA source must be considered: the first, affecting the entire series (starting from 2000) and, consequently, the LCI base year, is the one available with the QNA estimates referring to the second quarter of the current year at t+90 (end of September), used for the LCI release of December 2023; the second, affecting years 2023, 2022, 2021, 2020 is the one due to the more standard annual NA release, available for the fourth quarter of the current year at t+60 and used for the LCI delivery of March 2024. In Q2:2022, relevant renewals of some collective agreements in Public Administration implied an exceptional increase in wages, other costs and total costs of section O affecting also the economic aggregates B to S that include this sector. In Q4:2022, relevant contract renewals have been applied in some Public sectors, these renewals and the related arrears, have particularly affected the dynamic of wages and consequently of other labour costs in section O and P. Revisions beetween the releases of March 2024 and December 2023 are not negligible in the quarters of year 2023 as effect of particularly high revisions in data of sections R and S due to the availability of more updated data on the hours worked for year 2023 when, in these sectors, a very relevant increase of this variable has been recorded.
Table 1 – Growth rates and revisions of the total LCI, Nace Rev. 2 sections B to N (raw data).
Table 2 – Growth rates and revisions of the total LCI, Nace Rev. 2 sections B to S (raw data).
2) Seasonal adjusted data
In the following Table 3, revisions of the seasonal adjusted LCI data are presented focusing on the q-on-q changes. Differently from the analysis on the unadjusted data, the last four vintages are considered but the entire time series are reported because of the length of the seasonal treatment effects.
Table 3 shows, for the period Q1:2000-Q4:2023, the revision history of the q-on-q changes of the seasonally adjusted total LCI (TLC) for the aggregate B to S observed along the last four vintages. Revisions are calculated as difference between the last release (Lt) and the previous release (Pt). In the table, some summary measures are also calculated (MPE, MAPE and RMAPE). For the sake of brevity the q-on-q changes are not reported in the table.
Small revisions affect all the vintages until quarter Q4:2020, while some less negligible revisions occur in the quarters of years 2022 and 2023, particularly in the vintages of March 2024 as a consequence both of refinements of the deterministic section of the Reg-ARIMA models used for the SA adjustment (in particular revision of outliers in the Covid period and introduction of new outliers in the last quarter due to high revisions of sectors O and P as effect of the exceptional data on wages and other costs recorded for the quarter Q4:2022).
More in general, revisions of the SA LCI data highly depend on the volatility of the hours worked, that implies a lower performance of the models used in the time series adjustment and on the higher revisions of the raw data on the O to S sections, due to the multiplicity of sources used to get these NA aggregates.
Table 3 – Revision history for seasonally adjusted TLC, Nace Rev. 2 sections B to S.
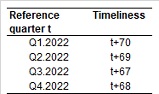
According to the Commission Regulation (EC) No 1216/2003 of 7 July 2003, Member States shall transmit the quarterly results of their LCI statistics to the Commission (Eurostat) no later than 70 days after the end of the reference period. Last year, the deliveries met timeliness (length of time between LCI data availability and their reference period) and punctuality (time lag between actual delivery of data and scheduled date of delivery), according to the calendar defined by Eurostat, in all the quarters.
Table 1 - Timeliness in the delivery of LCI.
7.1.1. Time lag - first result
See 7.1.
7.1.2. Time lag - final result
Not applicable.
7.2. Punctuality
Table 1 - Punctuality in the delivery of LCI.
7.2.1. Punctuality - delivery and publication
The number of days between the Italian delivery date of LCI and the target date on which they were scheduled for delivery by Eurostat is equal to zero or negative. Italy is perfectly compliant on punctuality.
The coherence of two or more statistical outputs refers to the degree to which the statistical processes by which they are generated use the same concepts - classifications, definitions, and target populations – and harmonised methods. Coherent statistical outputs have the potential to be validly combined and used jointly. As deeply explained in §2 and §3 '3.1 Source data' and further on this Report, coherence is at the basis of the integration of the three sources that contribute to the calculation of the Italian LCI: OROS, LES and VELA (Ceccato et al., 2019). The availability of the latter since September 2010 and the subsequent unification of the questionnaire for the LEs collected by LES and VELA have reinforced this coherence framework [1]. In the Italian LCI, OROS, LES and VELA sources are also highly integrated, given the differences in concepts, definitions, methodology, with National Accounts both because they provide strategic indicators for the quarterly NA disaggregation procedures and because the QNA source is used to compile the O to S Nace sections of the LCI. Comparability over time is get at micro and macro level.
[1] Starting from June 2019 VELA survey releases data on the whole population of enterprises, including those with less than 10 employees. This enlargement poses important opportunities of improvement on the coherence dimension. At the moment, some further work is still necessary in order to produce official long time series on the hours worked for the whole population of enterprises, usefull for the LCI purpose. Since March 2020, as described in concept '3.1 Source data' in order to have a most adequate measure of labour input in the context of the Covid pandemy, an ad-hoc recostruction of the per-capita hours worked time series for all the eterprises was perfomed by the Oros staff. Revisions are expected once the official figures will be available.
8.1. Comparability - geographical
Not applicable.
8.1.1. Asymmetry for mirror flow statistics - coefficient
Not applicable.
8.2. Comparability - over time
In occasion of the transition of the OROS-LES and VELA-LES to the new base 2015=100, in June 2018, according to the EU-STS Regulation requirements (see §4 Main changes due to the transition of the data sources to the new base 2015=100 '3.1 Source data' in in the Italian LCI QR 2017), several methodological innovations and metadata revisions have been introduced, implying changes in microdata affecting, at more levels, figures of the main target variables involved in the calculation of the LCI since Q1:2015. Innovations have not been extended at micro level to the time interval ranging from Q1:2000 to Q4:2014. In order to guarantee coherence between the two spans of the time series, linking factors have been calculated on overlapping periods and applied to the quarters estimated in old methodology [1]. This practice has been used for the target variables estimated by the OROS-LES source. As far as the per-capita hours worked drawn by VELA-LES are concerned, no linking factors have been used. As far as the aggregates calculated using NA data, no innovations have been introduced, preserving the old coherence in the O to S time series.
In June 2019 the LCI time series have been delivered in new base year 2016=100. For Italy this transition has implied only the shift of the base year in the calculation of the index and no methodological changes have been introduced. So, no linking factors have been used to re-establish coherence in the time series, because no breaks are present.
In June 2020, in order to reduce the impact of the higher non-response rates recorded by the survey on hours worked (Vela) for Q1:2020, due to the Covid emergency, some changes have been introduced in the strata used for the calibration of the sample data. These changes should have guaranteed more robust estimates of the per-capita hours worked used to compile the denominator of the B-N Italian LCI indices. Furthermore in order to comply with the higher non-reporting in admin data observed for the month of March, consequence of the dilation of the admin deadlines admitted during the Covid crisis, the total population of the employees for the B-N private sectors used to calculate total hours worked, has been estimated with the help of an additional admin source (the Compulsory Communications of the contracts’ activations and cessations). The use of this additional source should have guaranteed more robust estimates of the total hours worked. Finally, the QNA estimates used for the compilation of the O-S aggregates have been calculated in a context of reduced data sources availability, implying some ad-hoc solutions.
Starting from the release of March 2021, to better asses the high reduction of labour input (at denominator of LCI) due to the massive use of the social security nets during the Covid crisis new improvements have been introduced. In particular, these improvents regard both the estimate of jobs and the use of the per capita hours worked for total enterprises instead of those with 10+ (see concepts '3.1.1. The LCI as an output of an integrated system' and '3.1.3. The denominator: the hours worked estimate').
Harmonized time series have been reconstructed starting from 2000.
In June 2023 the LCI time series have been delivered in new base year 2020=100. For Italy this transition has implied only the shift of the base year in the calculation of the index and no methodological changes have been introduced. So, no linking factors have been used to re-establish coherence in the time series, because no breaks are present.
In occasion of the transition of the OROS-LES and VELA-LES to the new base 2021=100, in June 2024, according to the EU-STS Regulation requirements (see '§3.1.4 Main changes due to the transition of the data sources to the new base 2021=100' and '3.1 Source data' in in the Italian LCI QR 2023), several methodological innovations and metadata revisions have been introduced, implying changes in microdata affecting, at more levels, figures of the main target variables involved in the calculation of the LCI since Q1:2021. Innovations have not been extended at micro level to the time interval ranging from Q1:2000 to Q4:2020. In order to guarantee coherence between the two spans of the time series, linking factors have been calculated on overlapping periods and applied to the quarters estimated in old methodology [2]. This practice has been used for the target variables estimated by the OROS-LES source. As far as the per-capita hours worked drawn by VELA-LES are concerned, no linking factors have been used. As far as the aggregates calculated using NA data, no innovations have been introduced, preserving the old coherence in the O to S time series.
[1] The link coefficients have been calculated as ratios between the totals referred to year 2015 in old and new methodology, for each of the target variables, at the level of 2-digit Nace. These coefficients have been applied to the totals of the same variables for the quarters from Q1:2000 to Q4:2014.
[2] The link coefficients have been calculated as ratios between the totals referred to year 2021 in old and new methodology, for each of the target variables, at the level of 2-digit Nace. These coefficients have been applied to the totals of the same variables for the quarters from Q1:2000 to Q4:2020.
8.2.1. Length of comparable time series
See part 8.2.
8.3. Coherence - cross domain
Cross domain coherence of the Italian LCI is based on the comparision of figures drawn from other Istat statistical sources that partly measure similar or identical variables, such as the "Oros indicators per FTE", the "Quarterly National Account estimates on wages and total labour cost", the "Indices of wages according to collective agreements (contractual wages)". Cross domain coherence is evaluated in terms of economic activities.
8.4. Coherence - sub annual and annual statistics
Full coherence.
8.5. Coherence - National Accounts
Annex 1 of the Commission Regulation (EC) No 1216/2003 implementing the LCI regulation 450/2003 section (f) states that a comparison must be made between the LCI and the QNA (Quarterly National Account) hourly compensations of employees. In this paragraph the results of the comparison based on figures drawn from the releases of June 2023 for both sources are presented. The QNA data used in the comparison are the official ones, downloadable from Istat website database I.Stat [1] and are compiled according to the new ESA 2010 (EU Regulation no. 549/2013).
When comparing LCI and QNA indices it is important to keep in mind that the two sources use different methodologies to estimate the considered aggregates and relevant differences characterize coverage, concepts, definitions and classifications. The QNA data, in particular, include regular and irregular workers and managers. The two latter working categories are absent from the LCI data. Further, the QNA data are estimated on accrual basis, as opposite LCI data refer to cash, and the variables have some differences in definitions: in QNA gross wages include wages in kind and tips, while LCI gross wages do not cover tips and include only very partially wages in kind. Finally in QNA hours worked, for the B-N aggregates, are estimated using as indicators in the quarterly disaggregation the 10+ enterprises per-capita hours worked, while the LCI is based on the per-capita hours worked for all size enterprises. During the Covid crisis, labour input was highly carachterized by the size of the enterprises.
The comparison is based on the analysis of the y-on-y growth rates calculated on simple indices of hourly labour cost (raw format). In the comparison several aggregates are illustrated and the period from Q1:2001 to Q1:2023 is considered.
In figure 1 below graph A depicts the differences in the total aggregate B to S (aggregate B to U if QNA data are considered). The greatest divergences between the two indicators are due to the hours worked component. As already stated, in fact, the QNA estimates of the hours worked are based not only on the VELA-LES source on businesses, but also on the Labour Force Survey data, while for LCI only VELA-LES is used. Additionally, as far as this latter, while in NA estimates VELA-LES time series are the official ones (still available only for the enterprises with 10+ employees), in the calculation of the LCI from March 2021 vintage, as described in concept '3.1 Source data', the time series used include all enterprises.
In the period Q4:2008 – Q4:2009 differences appear to be relevant and are concentrated on the aggregate B to E mainly due to a different way in quantifying the short-time work allowance (Graph. C). Furthermore, in 2015 and 2016 not negligible differences are observable in all economic sectors of the business economies. These differences are to be attributed to huge reductions in labour costs other than wages and salaries in case of hiring of new jobs during 2015 and 2016 related to a radical labour market intervention policy (Law n.190 of 23th December 2014). The latter is accompanied by a recomposition among regular employment contracts and redefinition in working time. In the same years, the sudden drop in LCI total labour cost is less intense in QNA total labour cost, and this is ascribable to the above mentioned differences in methodology according to LCI cash criteria and QNA accrual basis rules. The sharp increase in Q2:2020, that is evidently recorded by both sources, is more intense according to the LCI. Main reason is in the per-capita hours worked time series used in the two sources: the reconstructed time series on all businesses used in the LCI, in this quarter, record significantly lower values than those for enterprises 10+. This divergence is more evident in the sectors of services, that have been much more influenced by the policy inteventions aimed at the economic activity suspension. During 2021 the divergences between the indicators produced in two domains were mainly counterbalances of previous year exceptional variations recorded by the two sources. As far as the year 2022 concerns differences mainly appear in section F and in the G to I aggregate as an effect of the different methodology used in the two data sources for the hours worked calculation and these are sectors were small size enterprises are very common.
The high correspondence of the LCI and QNA y-on-y growth rates in the aggregate O to S (Graph N) is due to the fact that, basically, the two indicators are drawn from the same source.
Figure 1 – A comparison between the LCI and QNA indicators on total labour cost per hour worked. y-on-y growth rates on total labour cost per hour worked for Nace Rev.2 aggregates (Period: Q1.2001-Q1.2024)
Graph A: B to S Nace Rev.2 aggregate [1]
Graph B: B to F Nace Rev.2 aggregate
Graph C: B to E Nace Rev.2 aggregate
Graph D: F Nace Rev.2 aggregate
Graph E: G to N Nace Rev.2 aggregate
Graph F: G to I Nace Rev.2 aggregate [1]
Graph G: J Nace Rev.2 aggregate [1]
Graph H: K Nace Rev.2 aggregate [1]
Graph I: L Nace Rev.2 aggregate [1]
Graph L: M to N Nace Rev.2 aggregate [1]
Graph M: B to N Nace Rev.2 aggregate [1]
Graph N: O to S Nace Rev.2 aggregate [1]
[1] In practice, this implies differences with data used to compile the LCI for these sectors. As stated in §1 and §2 of '3.1 Source data', an ad hoc procedure has been used to calculate the O to S aggregates necessary to accomplish the LCI Regulation requests. Furthermore, the aggregate O to S is not published separately from QNA source but only into the aggregate O to U. So that the comparison between the two sources when focuses on Industry, construction and services intends to exclude activities of households as employers and extra-territorial organisations and bodies if data are drawn from LCI source, while if data are drawn from QNA source these activities are included.
8.6. Coherence - internal
Internal coherence between variables and Nace aggregates for raw, calendar adjusted and seasonally adjusted indices is quite completely guaranteed by construction because of the indirect approach used to get the totals (see '6.4 Seasonal adjustment'):
total labour cost by Nace section is calculated indirectly from its components wages and other costs;
the Nace aggregates for the three variables are calculated indirectly from the respective sections' indices.
In this system coherence is not guaranteed for the Nace aggregates of the total labour cost, that are obtained by summing up their section indices. This way of calculating the total is incoherent with that obtained, alternatively, by aggregating wages and other costs for the same Nace aggregates.
9.1. Dissemination format - News release
The LCI is released only at EU level and has not yet been disseminated at national level, therefore there are no data available for the public on the Istat website. Users that contact Istat to get LCI information and data are carried to reach EU data and metadata on the specialized websites. When directly required specific methodological and technical information are given, too.
The Italian data are released on-line in the Eurostat LCI news release at the web page (Euro indicators) under Theme: Population and social conditions.
9.2. Dissemination format - Publications
Data on the Italian LCI are made available from EU to the public at the following links:
The quarterly EU news release about the hourly labour cost can be found at the webiste: (Euro indicators) under Theme: Population and social conditions.
General information and link to the data are available on the EU webpage "Statistics explained" at the website: (Hourly labour costs).
Labour Market Statistics Pocketbook, available at the website: (Products pocketbooks).
Belonging to the list of the PEEIs, information on the LCI can be found at the website: (Euro indicators). Overview - Euro-indicators - Eurostat (europa.eu)
Metadata about the Italian LCI are available at the website: (Metadata - (EN)).
The repository Database for LCI data is at the website: (database).
9.3. Dissemination format - online database
Data on the Italian LCI are made available in the Eurostat database at theme Population and social conditions\labour market\labour costs\Labour cost index at the website (Database).
9.3.1. Data tables - consultations
Not applicable.
9.4. Dissemination format - microdata access
Not applicable.
9.5. Dissemination format - other
Not applicable.
9.6. Documentation on methodology
References
Baldi C., Bellisai D., Ceccato F., Pacini S., Serbassi L., Sorrentino M., Tuzi D. (2011a), The system of short term business statistics on labour in Italy. The challenges of data integration. Paper presented at the ESSnet Data Integration Workshop in Madrid 24-25 November 2011. Website: (INE Baldi et al).
Baldi C., Bellisai D., Ceccato F., Pacini S., Serbassi L., Sorrentino M., Tuzi D. (2011b), Labour Cost Index and Job Vacancy Statistics from an integrated system based on surveys and administrative data. Presentation at the LAMAS Workshop, Eurostat 20-21 October 2011.
Ceccato F., Ciammola A. (2010), “A brief note about the Italian LCI Meta Information”, sent to LCI MS referents in 2010, October.
Ceccato F., Cimino E., Lattanzio M., Pogelli F.R. Tuzi D. (2019) "The Italian Experience in using Social Security Admin Data as Primary Source for Short-term Labour Market Statistics: the OROS Information System". Paper presented at the Workshop on the Use of Admin Data for LMI Statistics. Statistics Poland, 6 – 7 May 2019, Warsaw. website: (Papers presentations).
Ciammola A., Ceccato F., Congia M.C., Pacini S., Rapiti F., Tuzi D. (2009), “The Italian Labour Cost Index (LCI): Sources and Methods”. Contributi n.8, Istat, Rome. Website: (ISTAT files).
Ciammola A., Tuzi D. (2010), “Internal Coherence in Seasonally Adjusted Chain Laspeyres Indices: an Application to the Italian Hourly Labour Cost Indicators”. Paper presented at the European Conference on Quality in Official Statistics, Q2010. Helsinki 4-6 May 2010.
Ciammola A., Tuzi D. (2015), “Calendar and Seasonal adjustment of the LCI: direct versus indirect approach. The Italian experience”. Paper presented at the Workshop on Labour Cost Statistics. Istat, Rome 5-6 May 2015. Website: (Seasonal and working day adjustment of the LCI (IT)).
Cimino E., Cirelli M., Pogelli F.R., Tuzi D. (2024), “Results of a pilot study towards an early labour cost index: successes and failures in the multi-source Italian production system". Paper presented at the European Conference on Quality in Official Statistics, Q2024. Estoril-Portugal 4-7 June 2024. Website: (Production leading public).
Congia M.C., Pacini S., Tuzi D. (2008a), “Quality Challenges in Processing Administrative Data to Produce Short-Term Labour Cost Statistics”, Proceedings of Q2008 European Conference on Quality in Official Statistics, Rome. Website: (Pdfs semantic scholar).
Congia M.C., Pacini S., Tuzi D. (2008b), “The Editing Process in the Italian Short-Term Survey on Labour Cost based on Administrative Data”, paper presented to the UNECE - Conference of European Statisticians,Work Session on Statistical Data Editing, 21 – 23 April, Wien.
Eurostat (2015) “ESS Guidelines on Seasonal Adjustment”. Eurostat Manuals and guidelines. Website : (Documents KS GQ 15 001-EN).
Eurostat (2014) “ESS Handbook for Quality Reports”. Eurostat Manuals and guidelines. Webiste: (Documents KS GQ 1 -003-EN).
Istat (2013), “Il sistema degli indicatori congiunturali sulla domanda di lavoro e le retribuzioni in Ateco 2007 e base 2005”. Metodi. Website: (ISTAT archivio).
Istat (2018a) "Posizioni lavorative dipendenti e costo del lavoro. La nuova base 2015". Nota informativa. Webiste: (ISTAT Nota Informativa Oros base 2015).
Istat (2019) "La Rilevazione trimestrale OROS su occupazione e costo del lavoro: indicatori e metodologie". Letture Statistiche. Metodi. Rome. Website: (ISTAT archivio).
Rapiti F.M., Ceccato F., Congia M.C., Pacini S. and Tuzi D. (2010) “What have we learned in almost 10-years experience in dealing with administrative data for short term employment and wages indicators?”, ESSnet Project, Seminar “Using administrative data in the production of business statistics”, Rome, 18-19 March 2010. Webiste : (INE Session 2).
9.7. Quality management - documentation
Baldi C., Bellisai D., Ceccato F., Pacini S., Serbassi L., Sorrentino M. and D. Tuzi (2011), "The system of short term business statistics on labour in Italy. The challenges of data integration". Paper presented at the Workshop: ESSnet Data Integration, Madrid 24-25 November. Website: (INE Baldi et al).
Congia M.C., Rapiti F.M. (2010), "Quality assessment and reporting in a short-term business survey based on administrative data", Documenti Istat, n.5. Website: (ISTAT archivio).
Ciammola A., Tuzi D. (2010), “Internal Coherence in Seasonally Adjusted Chain Laspeyres Indices: an Application to the Italian Hourly Labour Cost Indicators”. Paper presented at the European Conference on Quality in Official Statistics, Q2010. Helsinki 4-6 May 2010.
Congia M.C., Pacini S., Tuzi D. (2008a), “Quality Challenges in Processing Administrative Data to Produce Short-Term Labour Cost Statistics”, Proceedings of Q2008 European Conference on Quality in Official Statistics, Rome. Website: (Semantic scholar).
Congia M.C., Pacini S., Tuzi D. (2008b), “The Editing Process in the Italian Short-Term Survey on Labour Cost based on Administrative Data”, paper presented to the UNECE - Conference of European Statisticians,Work Session on Statistical Data Editing, 21 – 23 April, Wien.
Piras M.G., Tuzi D. (2018), “Revision Policy and Revision Analysis in Short-term Statistics at Istat: Recent Developments in Standardization and Communication Innovations”, Proceedings of Q2018 European Conference on Quality in Official Statistics, Speed talk session 05, Krakov.
9.7.1. Metadata completeness - rate
Not applicable.
9.7.2. Metadata - consultations
Not applicable.
The LCI Regulation takes into account the importance of the increasing burden on enterprises [1]. But this quality component, and especially the cost and burden on enterprises due to the implementation of the regulation, is not explicitly highlighted in the annex of the Commission Regulation where quality characteristics are listed.
To produce LCI data Istat did not increase at all the burden on enterprises because pre-existent surveys (LES-Large firms Survey, VELA-Job vacancies and hours worked Survey), administrative data, National Accounts data and, in the past, other pre-existent statistical sources (LFS, etc.) have been used. None of the auxiliary Surveys used to calculate the Italian LCI requires additional information for the LCI objectives.
To get the same results with a traditional business survey, more than 15,000 firms should have been surveyed and as a result a new heavy burden on business and high costs for NSI would have emerged.
At the moment Istat has access free of charge to the administrative data thanks to a general framework agreement with INPS. This reduces very much the current production cost of the survey. The main cost item is the human resources employed, which in the last year were, on average, 3.5 full-time employees/researchers, 1.5 of them employed on the LCI compilation and developments.
[1] In the introduction the Regulation states: “The benefits of collecting, at Community level, complete data on all segments of the economy should be balanced against the reporting possibilities and the response burden on small and medium-sized enterprises (SMEs)”.
11.1. Confidentiality - policy
Istat releases microdata files referring to its own surveys free of charge. In order to make statistical secrecy and protection of personal data effective, Istat has taken appropriate organizational, logistical, methodological and statistical measures in accordance with nationally and internationally established standards. In implementation of the art. 5-ter of the legislative decree 14 March 2013, n. 33, introduced by the legislative decree 25 May 2016, n. 97, the new “Guidelines for the access for scientific purposes to the elementary data of the National Statistical System (Sistan)” - published with Directive no. 11 of the Steering and Coordination Committee for Statistical Information (Comstat) of November 7, 2018 - establish the conditions under which the bodies and offices of the National Statistical System can allow researchers to access their own elementary data for scientific purposes. The procedure defined by the aforementioned article establishes that the researcher’s institution must be recognized as a research entity by Comstat on the basis of specific criteria or it is included into the list of research entities recognized by Eurostat (Regulation (EU) No. 557/2013). The Comstat Directive n. 11/2018 establishes the adoption of the “Guidelines for the access for scientific purposes to the elementary data of the National Statistical System” and permits researchers to access for scientific purposes elementary data with anonym id. Directive n. 9 issued by Comstat, “Criteria and procedures concerning the communication of personal data within the National Statistical System”, brings Sistan fully into line with legislation concerning the protection of personal data (Legislative Decree 196/03 and ethical code of conduct). The directive deals with the transmission of previously collected personal data to a statistic bureau or agency or any other party in the System (in this specific case Istat) which requests them for statistical purposes. Such requests may be made for the purpose of:
the implementation of the National Statistical Programme (PSN);
the execution of statistical data processes in connection with the institutional activities or local area of competence of the requesting party. In this case, a brief description of the project must be provided.
The transmission of personal data with information containing unique identification data must be limited to exceptional cases in which it is absolutely and strictly necessary (in which it is impossible to achieve established objectives without information for identification). The signer of the request assumes full responsibility with regard to the applicability of this condition (for further details see at the website: (ISTAT microdata files).
11.2. Confidentiality - data treatment
In general Istat has special aggregation rules which have been developed to ensure that indirect disclosure of individual data does not occur when aggregations of data are presented. These rules, reported in a specific Gudelines Manual (available at the website : ISTAT Regole per il rilascio ADELE, in Italian only), are periodically updated to include the most significant improvements, at national and international level, of the methodological techniques aimed at the legal protection of privacy, and at the elaboration of data according to the needs of researchers and bodies keeping part to the Sistan.
In the LAMAS context the importance of monitoring the impact of the volatility of the “hours worked” component (hereinafter HW) on the variability of LCI indices is deeply stressed. Following this debate, MSs agree on the utility, in the quarterly LCI metadata template, of an indicator aimed at measuring the contribution of the HW and of the Total Labour Cost (hereinafter TLC) components on the variability of the LCI. The best format to provide the figures contributing to the indicator is the non-adjusted. The advantages of providing non-adjusted figures are discussed in the document sent from Italy to Eurostat (Ceccato and Ciammola, 2010). The following figure 1 and figure 2 depict the time series of the evolution of the HW and TLC components compared with the LCI evolution for the B to N and B to S aggregates. The time series refer to data available in the release of June 2024 when quarter Q1:2024 was produced. As stated in the LAMAS recommendations, the y-on-y growth rates of the components should be “broadly consistent” with the y-on-y growth rates of the LCI in the following way: increase in LCI should be approximately equal to the difference between the increase in TLC and the increase in HW.
As figure 1 – graph A points out, the previous relation is still guaranteed even if the y-on-y growth rates of LCI Nace sections B to N exceed the difference between the y-on-y growth rates of the components for a maximum of 3.837 point per cent in Q2:2021 while the highest negative characterizes Q3:2020 (-1.249 percentage point).
In graph B of figure 1 the evolution of the LCI is compared with the two components' dynamic. The wider need of enterprises to recur to the short-time hours allowance, or other forms of labour input reduction, had the consequence to reduce both the employees’ HW and the TLC amounts. The graph shows a slow recover during 2010 and 2011 but not a return to the levels registered before the economic crisis, that in 2012 is back again. From 2013 to 2016, the components increase again with a similar dynamic until 2015 when the growth of total labour cost reduces its speed, with respect to the hours worked, as a consequence of the firms admission to a reduced payment of other labour costs in case of hiring of new jobs during 2015 and 2016. During 2017 the two components dynamic, although similar, show moderate values due to a confirmation of the employment structure (working time, type of contract, job position, etc.) produced by the labour market policies of the previous two years. From 2018 the two components' dynamics diverge: the total labour cost increases but at a reduced speed than in 2017 as a result of the reduced wages payed for the new jobs, and decreased hours worked consequent to the economic stagnation. In Q1:2020, due to the Covid crisis, the graph shows a first sharp decrese of both components that becomes massive in Q2:2020 and an increase of the LCI due to a higher reduction of the HW than that of the TLC (see concept 6.6.1 'Data revision - average size'). The sharp increase of both components and the decrease of the LCI of Q2:2021 are essentially a rebound effect of the dynamic of the previous year, while, from Q1:2022, the dynamic of LCI seams to return to the pre pandmic levels due to the increase of a similar extent of both componenets.
Figure 1. LCI y-on-y growth rate minus the differences between the y-on-y growth rate of the TLC and HW components. Nace Rev.2 sections B to N. (Period: Q1:2001-Q1:2024)
Graph A: diff_B_N = y-on-y LCI – (y-on-y TLC – y-on-y HW) in sections Nace Rev.2 B to N
Graph B: y-on-y of LCI, TLC and HW in sections Nace Rev.2 B to N
Figure 2. LCI y-on-y growth rate minus the differences between the y-on-y growth rate of its components (TLC and HW). Nace Rev.2 sections B to S. (Period: Q1:2001-Q1:2024)
Graph A: diff_B_S = y-on-y LCI – (y-on-y TLC – y-on-y HW) in sections Nace Rev.2 B to S
Graph B: y-on-y of LCI, TLC and HW in sections Nace Rev.2 B to S
For sections from B to S the highest positive deviation of the y-on-y growth rates of the LCI towards the two components is recorded in Q2:2021 (3.564 percentage point) while the highest negative characterizes Q4:2020 (-1.135 percentage point) (figure 2). The lower deviations recorded in this aggregate are to be attributed to the presence of the public sector, where the volatility of the hours worked, in particular, is lower than in the private sector. Furthermore, the last Covid events have only marginally influenced the public. The increase of the LCI of Q4:2022 can be attribuited to the relevant contract renewals and the related arrears in some Public sectors that particularly affected the dynamic of wages and consequently of Total labour costs in sections O and P .
The quarterly Labour Cost Index (LCI) is part of the European system of multi-annual, yearly and infra-annual statistics providing, at supranational level, an harmonized, comprehensive and detailed information framework on level, structure and short-term development of the labour cost by economic activity sector. In this system the quarterly LCI measures the cost pressure arising from the production factor "labour". Data defining the LCI refer to the Total average hourly Labour Cost (TLC) and to its two components, Wages and Salaries (WAG) and employers' social security contributions plus taxes paid minus subsidies received by the employer (Labour costs other than wages and salaries) (OTH) [1] (see Regulation (EC) n. 450/2003 of the European Parliament and of the Council of 27 February 2003 concerning the labour cost index).
Data are provided within 70 days after the end of the reference quarter and are given in the form of index numbers (current base year is 2020) broken down by economic activity (Nace Rev.2). In detail:
Elementary indices are calculated for the single sections B to S;
Laspeyres chain indices, annually chain-linked back to the reference year are compiled for the B to E, B to F, B to N, B to S, B to S excluded O, G to J, G to N, G to S, K to N, P to S and O to S aggregates of the three variables.
All series are delivered in unadjusted, calendar adjusted and seasonally and calendar adjusted format. Time series are available with starting date Q1:2000. In addition to the quarterly indices, also annual weights are provided, used by Eurostat to calculate the EU aggregates. The delivery of the quarterly indices is accompanied by metadata. Since December 2016 Italy delivers on a volountary basis the four LCI component variables expressed as levels, only unadjusted. The latter are only for Eurostat internal use.
Beside the compilation of the LCI, once a year (in March) countries are in charge for the validation of an annual labour cost per hour in euros estimated for all the EU Member States by Eurostat by combining the four-yearly Labour cost survey (LCS) with the quarterly labour cost index.
The Italian LCI is compiled using pre-existent survey and administrative data.
[1] The only remaining deviation from the EU concepts is the exclusion, from the Italian LCI of the “subsidies”. At the moment, the sources used for the estimation of the other labour costs component “employers' social contributions plus taxes paid by the employer less subsidies” do not allow the exclusion of the subsidies, that in Italy are yet not present or negligible. By definition, the LCI does not by contrast include vocational training costs and other expenditures such as recruitment costs and working clothes expenditures (Commission Regulation (EC) n.1737/2005 of 21 October 2005 amending Regulation (EC) n. 1726/1999 as regards the definition and transmission of information on labour cost).
Not Applicable
The labour cost index shows the short-term development of the hourly labour costs incurred by the employers for paid employment and gives a measure of the cost pressure arising from the production factor “labour”. It is calculated dividing the labour costs by the number of hours worked. Labour costs are made up of costs for wages and salaries, plus non-wage costs such as employer's social contributions. The latter do not include vocational training costs or other expenditures such as recruitment costs, spending on working clothes, etc. These labour cost components and their elements are defined in Commission Regulation (EC) n. 1737/2005 of 21 October 2005 amending Regulation (EC) n. 1726/1999.
The LCI covers all business units irrespective of the number of employees and all economic activities except agriculture, forestry and fishing, private households and extra-territorial organisations. LCI data are presented in the form of index numbers (current base year is 2020). Quarterly indices of hourly labour costs are calculated first for each economic sector (Nace Rev. 2. sections) and then aggregated to the whole economy keeping a fixed structure (i.e. fixed weights) by industry (Laspeyres index). Therefore, the LCI includes the compositional effect derived from a change in the composition of employment within an economic sector. All labour cost indices are annual chain-linked Laspeyres indices. In order to obtain Nace aggregates, the hourly labour costs for each component of the aggregate are weighted by the total labour costs of that activity into the aggregate, which are fixed for one year, and then summed up.
Together with the Total Labour Cost Index, indices are also available for the labour cost components "wages and salaries" and "employers' social security contributions". Italy does not provide a version (not mandatory) of the index excluding "bonuses" (bonuses and allowances not paid in every remuneration period). In fact, the data sources at the basis of the Italian LCI does not allow an exhaustive individuation of this component of the Total Labour Cost.
In order to permit the calculation of the EU aggregates, annual weights at section level of Nace are also provided to Eurostat. Italy calculates these weights as levels expressed in euros for the three main variables (TLC, WAG, OTH). In addition, Italy provides on a volountary basis and for Eurostat internal use, quarterly levels for TLC, WAG, OTH expressed in euros and HW (hours worked) expressed in total number.
The statistical units are enterprises, public and private institutions, regardless of size.
Enterprises and institutions with 1 employee or more belonging to the B to S Nace Rev.2 sections.
Geographically the LCI covers the whole country. Activities outside the country are excluded.
Not Applicable
In the Italian process for the compilation of the LCI a high attention is paid on the qualitative and quantitative evaluation of accuracy and reliability of the estimates. The nature of the sources used (mainly admin) implies pervasive checks and editing also according to non-standard rules because of the frequent changes in the structure or content of data due to legislative and/or IT reasons. Given the nature of the sources the attention is on non-sampling errors. Revision analysis is deeply used as a strategic tool to fine-tune the statistical process.
Assessing accuracy on the Italian LCI data requires taking into account at least two main aspects:
the index is compiled through a mix of sources (administrative, survey and National Accounts data);
each source used in the estimation of the LCI is subjected to revisions, not always following a scheduled plan, to include in the next versions of estimates more updated information.
In the paragraph the main accuracy concerns of the Italian LCI data are described. The focus is on the non-sampling errors [1] (coverage errors, measurement errors, non-response errors, processing errors). The revision process and some revision indicators on the raw data are also presented and, finally, method, practices and accuracy of the seasonally adjusted LCI data are described.
[1] In the description of the error issue, the major attention is devoted to the explanation of the problems arising from the treatment of the administrative and LES sources used for the estimation of the LCI numerator. As far as it concerns the hours worked, more details on the VELA E&I process can be found in the methodological section of the national press release available at the website: ISTAT archivio.
Not Applicable
The components of the Italian labour costs are measured in Euros, current prices. The Total Labour Cost, as well as the NACE aggregates are obtained as weighted averages respectively of wages and other costs and of the single sections values. For more details see the concept '3.1 Source data'.
3.1.1. The LCI as an output of an integrated system
For the compilation of the Italian LCI a unique source of data is not available. The calculation of the indicators that contribute to the index requires the use of a mix of sources that vary across economic domain (Nace Rev.2) and enterprises subpopulation, involving business surveys and National Accounts data.
Figures on the sections from B to N are compiled combining three coherent and harmonized sources that contribute to define, for the mentioned sectors, a system of statistics at Istat aimed at covering the main short term labour market indicators: the census monthly survey on large enterprises (LES) [1], the quarterly sample survey on job vacancies and hours worked (VELA) [2] and a survey on employment, wages and labour cost (OROS) mainly based on Social Security data [3]. Figure 1 shows with respect to three size classes subpopulations which each survey refers to, variables produced and sources used. The pillars of the system are (Ceccato et al 2019, Baldi et al, 2011a and 2011b):
OROS-LES which is used both as the current quarter population frame and as the census based source of information for average quarterly jobs, wages and other labour costs variables;
VELA-LES which is used as the sample based source of information for jobs at the end of the quarter, job vacancies and hours worked.
The three sources, starting from data collection to the production of the main outputs, are characterized by a deep integration that involves definitions, micro data, processing phases and target outputs. At the basis of the system a very strict scheduling of the processing time, in order to guarantee the accomplishment of the various deadlines that, however, still faces some problems in the compilation of the LCI as it will be more in depth explained later on in this paragraph.
Figure 1. The integrated OROS-LES-VELA system: sources, variables and coverage.
In this system, the LCI is one of the final outputs, where all the three sources are integrated. The following formula, expresses how each component of the quarterly per hour labour cost (hwTLCt) is calculated into the system, clearly showing the high integration level that characterizes the system:
Where is the per-capita indicator on total labour cost and is the per-capita indicator on hours actually worked. The three sources reconciliation is guaranteed by the number of jobs drawn from the OROS-LES subsystem.
Starting from the release of March 2020, to better asses the high reduction of labour input due to the massive use of the social security nets during the Covid crisis, an improvement of the estimate of jobs has been introduced.
The VELA-LES source on the hours worked exists since June 2010. Until 2012 the time series produced by the source were available starting from Q1:2004. Because of the shortness of the period covered, for the compilation of the LCI a backcasting of the series until Q1:2000 was necessary and performed by the OROS team, that is in charge of the compilation of the Italian LCI. Starting from the release of June 2013, due to an STS Regulation requirement, the length of the time series of the hours worked produced by the VELA-LES team has been extended to the period Q1:2000-Q4:2003 and used for the compilation of the LCI. An exception is section L that is not required by STS and has not consequently been reconstructed: for this section, the old reconstruction performed by the OROS team is still used.
Until the delivery of March 2013 due to a problem of time lag between the sources in the system, the last observation on the hours worked was not available into the LCI official release deadline and a forecast procedure based on the VELA-LES sources was used in order to get the denominator (for details refer to the LCI Quality Report 2012). Due to a reorganization of the VELA-LES production process, during 2013 timeliness has considerably increased implying, since the delivery of June 2013, the availability of the hours worked last observation and the abandon of the forecast procedure. This improvement has produced positive feedbacks on the quality of the LCI indicators, as it will be further explained in this Report.
The O to S aggregate estimates are drawn from ad-hoc Quarterly National Accounts figures used both for the numerator and the denominator. Data for these aggregates, at section level and covering the entire time series starting from Q1:2000, are available since March 2012. The reason for using National Accounts data is that none of the sources in the OROS-LES-VELA system completely covers the O to S aggregates, yet [4].
Figure 2 schematizes, for the overall aggregate B to S, sources used and length of the time series for which data for the compilation of the LCI are available
Figure 2. Scheme on the sources used for the LCI calculation by type and referring period
Series until reference quarter Qt:
Numerator
- Q1:2000 - Qt
- Q1:2000 - Qt
Denominator
- Q1:2000-Qt (*)
- Q1:2000-Q3:2007
- Q1:2000-Qt
Sources:
Numerator
- OROS survey (B to N)
- Preliminary and ad-hoc figures drawn from QNA (O to S)
Denominator
- VELA-LES (B to N)
- Backcasting on Structural surveys SCI-PMI (L)
- Preliminary and ad-hoc figures from QNA (O to S)
(*) Q4:2007-Qt for L section.
In the following two paragraphs more details are given on the methodology used for the estimation of each of the LCI component.
3.1.2. The numerator: labour costs
Regarding the B to N sections, the labour cost variables as well as employment are drawn from the integration of OROS-LES (figure 1). This source is aimed, at national level, at producing Fte (Full time equivalent) indicators on gross wage, other labour costs and total labour cost for Italian firms with at least one employee in the private sector (sections B to N of the Nace Rev.2 classification). Beside fulfilling the LCI Regulation, OROS-LES satisfies also the STS Regulation requirements on employment and wages variables (Rapiti et. al 2010; Istat, 2019).
The OROS-LES statistics are based on the combination of two sources: survey data are used to estimate large enterprises (hereafter LEs) and administrative data for the small and medium size enterprises (hereafter SMEs). Data on LEs (more than 500 employees) are drawn from the Monthly LES, that is a census survey. The administrative source, used for the estimate on SMEs, refers to the Social Security declarations of the employers for their employees to INPS. In order to get the target parameters the variables coming from the two sources are harmonized according to the statistical requirements and figures combined through a record linkage procedure (Congia et. al, 2008a, 2008b; Baldi et al, 2011; Istat, 2019).
It’s worth mentioning that INPS administrative source in the last years has faced some radical changes that have affected the quality of the OROS-LES estimates in several directions: in a closest period, the adaptation to the new system had some drawback on the estimates, requiring higher efforts to guarantee the past standard of quality; in a longer perspective the overall indicators produced by the survey will highly benefit by the richer information made available by the change. The mentioned changes started in January 2010 (figure 3), when INPS abandoned the existent declaration system based on monthly forms to be compiled at firm level (the so called DM10 form) [5]. Since January 2010 INPS requires employers to compile a radically new and more complex form (Uniemens) containing information at employee level and some summary information at firm level. Moreover, several interventions aimed at rationalizing the collection of the administrative information have continuously been introduced.
The new Uniemens source would be an inestimable mine of information for Istat, but translating the new administrative data into statistical information will require a long exploration period to be mainly invested in the reconstruction of the necessary metadata, deeply changed with respect to the old system. For the OROS-LES purposes, in a first stage Istat continued asking INPS to download the so called “virtual DM10”, an aggregation of the Uniemens in the old DM10 form that INPS had, until December 2012, to perform for internal administrative aims. Starting from January 2013 INPS faced a further internal change, consisting in the abandoning of the virtual DM10 for the adoption of the new “virtual DM2013”, a more simplified and efficient reconstruction, at firm level, and for internal administrative aims, of the official Uniemes (figure 3). This further and unexpected change implied several difficulties for the OROS survey that had to adapt in a very short time the deeply complex procedures to produce, in the scheduled deadlines, the main outputs. The OROS team is still working on the simplification and reorganization of the procedures to exploit more efficiently the new DM2013 available information. This new exploitation strategy will imply, in the next future, many progresses in the production of the interest variables towards the transition, in a longer period, to the use of the Uniemens employee level information. An important advancement has been introduced in June 2024, in occasion of the transition of the main indicators produced by the three surveys to the new base year (2021=100), according to the requirements of the EBS Regulation (n. 2152/2019). In this occasion, the pre-treatment phase of the admin data (DM2013) has been completely re-disigned, implying the production of widely detailed micro data (employment and labour cost components by duration of the contract and by qualification of the employee, part time and full time).
Due to the transition to the new Uniemens system, during 2010 an unusual relatively lower number of DM10s have been received, confirming the expectation on the adaptation needed by the enterprises to the new system. The late reporters have been mainly LEs, those that have heavier administrative burden and very small enterprises, that have poorly organized bookkeeping offices. On the other hand, a greater quality (measurement errors) of the available preliminary micro data has also been verified due to a greater attention that INPS is paying on the collection of the more complex data. More recently, the transition to the DM2013 did not affect the delivery time of the models by the enterprises but implied a delay in the transmission of data by INPS, due to a significant IT reorganization in the Social Security Institute.
Figure 3 – Latest changes in the Administrative source at the basis of OROS
Regarding the availability of the administrative data for the estimates, every quarter INPS provides Istat with three data files:
a preliminary set of virtual DM2013s referred to the current quarter t, downloaded after about 45 days from the reference quarter. This set of data is used for the preliminary estimates of the target variables for quarter t;
a final set of virtual DM2013s referred to the quarter t-4, downloaded with a delay of about 1 year from the reference quarter, used to calculate the final estimate on quarter t-4;
an updated version of the INPS Business Register (INPS BR) acquired after about 45 days from the reference quarter, that gives structural information on the units at t.
The information on the firms classification by economic activity is drawn mainly from the official statistical Business Register (so called ASIA). Over the 90% of the INPS BR units match with ASIA. An additional administrative source, the Tax Register Data is additionally used to assign the activity code to those units not matched with the BR. They refer mainly to entries not found in the BR because of the updating time gap between the two sources. For the residual units a reclassification of the old Nace (Nace Rev. 1.1) codes, drawn from administrative information available in INPS BR, is carried out. In particular, the conversion from the old to the new Nace codes is based on ad hoc conversion keys that ensure a one-way attribution of the 2 digit new Nace economic activity code starting from the old ones. Finally, the BR and the Tax Register are also used to get information on the legal and institutional nature of the units aimed at the target units' identification [6]. The information on the Nace and on the other structural variables on the unit are fixed at the base year or at year the unit appears in the reference list for the first time. Information is changed only in occasion of the revision of the base year. This policy has been introduced very recently in the estimates of the Italian LCI figures in order to control for spurious short term dynamics due to reclassification of the units normally performed in the new versions of the Registers.
Each quarter the OROS-LES source releases a preliminary estimate on t and a final estimate on t-4 combining administrative data with statistical data on LEs. The final estimate differs from the preliminary because of the more complete and updated information that becomes available meanwhile. The intermediate t-1, t-2 and t-3 quarters may be affected by minor revisions, too. It is in particular the case of the release of June of each year, when the preliminary estimate on the first quarter is produced for the first time. In this occasion, due to the revision policy introduced by the LES, all the estimates referred to the last year are submitted to revision. Since April 2010, in fact, following a more severe enterprise recall practice, the estimates of the LES referred to the last year are recalculated to include the available data on the later responders. Being part of a system, data from the OROS-LES source are unavoidably subjected to all the changes that may affect both the involved sources.
As far as the O to S sections are concerned, the labour cost variables are drawn from QNA aggregates. The available administrative data are in fact not complete on the public sector, that highly characterises these sections. Data used for the LCI purposes, that are not published by the NA, are estimated through an ad hoc procedure that calculates the necessary indicators according to the LCI Regulation requests. As for the official QNA aggregates also these ad hoc estimates are obtained through a temporal disaggregation technique based on the annual NA aggregates and on quarterly reference indicators that are properly chosen. Because of in National Accounts official data are included regular and irregular workers an effort was done to estimate all figures with reference just to the regular employment. Main drawback of this choice is that the quarterly estimates so derived are not directly comparable with the official QNA aggregates.
3.1.3. The denominator: the hours worked estimate
It is in June 2010 that for the first time Istat officially began to release quarterly series on per-capita hours worked for the sectors B to N, covering a long-lasting data gap in the national statistics. This new indicator on the labour market is produced by the VELA survey integrated with the LES (figure 1).
Before the new release, very detailed monthly information on the hours worked were produced only on the basis of the LES and were limited to a specific set of firms, those with at least 500 employees (about 1.2 thousands of firms). Large Enterprises cover about the 20 per cent of the total employment in the Italian private sector (B to S excluded O Nace Rev.2 sections), but their behaviour is highly characterized in terms of seasonal pattern and overtime hours. The approximation of the per-capita hours worked of the total population with the only LEs subpopulation was therefore considered inadequate for the LCI purposes, and this is the reason why the previous method to estimate the LCI denominator used several business sources (structural and short-term) through benchmarking and quarterly disaggregation techniques [7].
VELA is a quarterly sample survey aimed at producing, together with indicators on the hours actually worked, rates on job vacancies. Until 2015's data acquisition, this survey was based on a representative set of firms covering the size classes from 10 to 499 employees (13,6 thousands of firms). Starting from 2016 the survey has been enlarged to all enterprises with at least one employee (12,4 thousands of firms have been added to the original sample). Although the new indicators representing all the sizes classes are published at national level since March 2020, the new time series are still available only starting from 2015 and longer time series have not been recostructed into the Vela production system, yet. Nevertheless, following the Covid events and the impact on labour input of the policy interventions necessary to contain the sanitary emergency, a correction to the hours worked compilation methodology into the LCI production process was necessary. In particular, since the second quarter 2020, a sharp decline in the per-capita hours worked was observed and this reduction was significantly larger in very small enterprises (those with less than 10 employees) than in the others. For this reason, the substitution of the per-capita hours worked from Vela-LES survey referred to the total population of Italian enterprises to those referred to enterprises with at least 10 employees was necessary. This intervention was introduced starting from the release of March 2020. The reconstruction of harmonized per-capita hours worked time series until 2000 was made by the Oros staff in emergency by an ad hoc procedure for the LCI purposes. This intervention is to be considered still provisional until the official time series will be available.
VELA sample is drawn from the Italian Business Register ASIA stratifying by economic activity, size class and multi-regional allocation. In the first quarter of each year, the 33 per cent of the sample is refreshed to consider firms’ demography.
The integrated VELA-LES source on the per-capita hours worked refers to hours actually worked, as normal time and overtime covering all private firms operating in the sectors of industry and services excluding agriculture (B to S excluded O Nace Rev.2 sections [8]), being the indicators on the P to S sectors published starting from December 2013 [9].
The quarterly indicators on the hours worked follow a revision policy affected by the practices of VELA, LES and OROS sources. In §2 '3.1 Source data' the OROS-LES practices have been explained. According to LES and OROS policy, VELA planned to introduce yearly revisions of the per-capita hours worked indicators, to be published with the delivery of the first quarter. Nevertheless, differently from OROS and LES, given the VELA estimation method, the last two years of the hours worked indicators will be affected by these annual revisions.
As in the OROS-LES sources used for the numerator, VELA-LES do not provide information on the hours worked for LCI on the O to S sections, mainly because the public sector is not covered by the two surveys. The lacking information is drawn, since March 2010, from NA sources. The indicators on hours worked from the NA sources are obtained through an ad hoc procedures of temporal disaggregation technique based on the annual NA aggregates and on quarterly reference indicators properly chosen. Figures may be subjected to revisions depending both on methodological interventions (non standard revisions), both on revisions of the sources used in the estimates (standard revisions).
The QNA standard revision policy of raw data, input in the LCI process, from 2017 follows the scheme reported below, detailed by quarterly release:
first quarter of a (LCI release of June a), the entire last four years (until a-4) are revised;
second quarter of a (LCI release of September a), t-1 and the entire last four years (until a-4) are revised;
third quarter of a (LCI release of December a), the entire series are revised to incorporate the Annual NA figures released at the end of September;
fourth quarter of a (LCI release of March a+1), t-1, t-2, t-3 and the entire last three years (until a-3) are revised.
Figures on the hours worked illustrated in this Report refer to annual NA series till 2023 and quarterly NA aggregates with reference to the Q1:2024 delivery.
The year on year growth rates, calculated on the raw LCI index on total labour cost, referred to the B-S and B-N aggregates are compared in figure 4. The graph underlines a divergence between the index calculated on sections B to S and the index calculated on sections B to N, whose magnitude varies along the considered time series: the inclusion of the O to S aggregate in the calculation of LCI leads to a higher variability during the period Q4:2005 - Q4:2006 when the contracts for public employees were renewed. In the following years, up to 2017, it is worth noticing that the inclusion of O to S aggregate in the LCI index involves a general reduction in the evolution of the year on year growth rates probably due to a generalized freeze on the collective labour agreement in these sectors. Starting from Q1:2018 public employees were interested by a general renewal of the collective pay agreements implying the payment of arrears covering the last two years, as clearly emerges from figure 4 in Q1:2018. During 2019 it is the B to N aggregate that shows higher rates of growth of the totale LCI, due to a reduction in hours worked recorded in several private sectors.
Starting from Q1:2020, the interruption/reduction of the activity of many enterprises due to the Covid crisis, affecting particularly the months of April, May and, even if less intensely, June, implied an exceptional decrease in hours worked, observed in almost the private sectors. When smart working was not possible, this activity reduction was supported by recurring to different kind of temporary absence from the work place, like holidays, temporary leaves, at first and then, intensely, to short-time working allowance (this last scheme is supported by Social Security). As a consequence, the total labour cost decreased, too, but with a lower intensity than hours worked, implying a general increase in the LCI. During the summer months, the Italian economic activity showed a slight recovery, implying a reduction in the decreasing trend of the hours worked. Additionally, a return of the labour demand composition to the pre-crisis asset and the absence, in third quarter 2020, of additional wages’ components payed in the previous quarter, implied a recovery of the labour cost components to a lower and more regular dynamic. As a consequence, in Q3:2020 the hourly labour cost showed a very low year-on-year increase and a decrease in terms of quarter-on-quarter changes. Due to a slight epidemic recovery in the autumn months, some restriction measures were newly adopted, implying a downturn of the economic activity particularly marked in some sectors. This downturn affected hours worked, that showed a more pronounced decrease in comparison to the decline recorded in the previous quarter, when economic activity showed a slight recovery. implying a slight increase of the LCI. In the second half of 2020, particularly in Q4:2020, in order to relaunch economic activity, some measures aimed at lowering social security contributions, through various relief, were introduced in private sectors. The effect was a general decrease, until Q2:2021, of the growth rates of the hourly other costs (and by this way of the total) component that was more intense than that of the corresponding hourly wages. In Q3:2021, the growth rate of the other costs was positive but, due to the persistence of some reductions of social contributions, less intense than the increase of wages. In Q4:2021 the growth of the hours worked component was more intense than that of wages, particularly in the P to S sectors. On the other hand, other costs recorded a generalized higher growth than that of wages, as a result of the reduction of the effects of the measures aimed at lowering social security contributions.
In Q2:2022, relevant renewals of some collective agreements in Public Administration implied an exceptional increase in wages, other costs and total costs of section O affecting also the economic aggregates that include this sector.
In Q4:2022, relevant contract renewals have been applied in some Public sectors, these renewals and the related arrears, have particularly affected the dynamic of wages and consequently of other labour costs in section O and P.
In Q1:2023, both total labour costs and per-capita hours worked increased at a fast pace. In particular, wages growth was a consequence of the payment of several arrears and una-tantum while the increase of other costs was due to a gradual return to the pre Covid levels that, during the pandemic, were reduced to support enterprises.
In Q2:2023, it is the B to N aggregate to show a faster growth due to sever contract renewals particulary in the industrial sector. This growth persists for the whole year.
Figure 4 – The LCI index on hourly total labour cost in the B to N and B to S Nace Rev.2 aggregates. (y-on-y growth rates Q1:2001- Q1:2024)
3.1.4. Main changes due to the transition of the data sources to the new base 2021=100
According to the European Business Statistics Regulation (EU n.2152/2019 and related Implementing act n.1197/2020) with reference to Short-term-Statistics, in occasion of June 2024's release OROS-LES and VELA-LES sources have been involved in the change of the reference year of the main indices produced, passing from base 2015=100 to 2021=100. New time series for the sections from B to N have been calculated, quite all available from Q1:2000 at section level of the Nace Rev.2 economic activity classification [10].
As far as the LCI is concerned, 2020 will continue to be the reference year until 2027 and the transition to the new base (2024=100) will occur with the first transmission of Q1:2027, i.e. in June 2027.
Being the result of an integration of OROS-LES and VELA-LES data, the Italian LCI for the sectors from B to N, and related aggregates, has been affected by the main changes introduced with the transition of the sources to the new base:
a) in the VELA-LES source the transition to base 2021 consisted mainly in:
refreshment of the enterprises' panel, affecting the time series from Q1:2021 onwards;
acquisition, in the VELA-LES estimates, of the OROS-LES micro and macro data starting from Q1:2021, according to the new base (for the relationships between variables into the OROS-LES-VELA system see '3.1.1. The LCI as an output of an integrated system').
b) in the OROS-LES source, this transition was the chance to introduce some improvements concerning definitional and methodological aspects. Among these improvements, those that affect the LCI are:
the refreshment of the LES panel;
the improving of criteria (rules) to define the OROS target population, in particular by using updated information on the legal and institutional nature of the units from the BR (Asia 2021);
the progresses in the estimation accuracy of some components of the other labour costs and of wages in the OROS survey, to incorporate more updated and detailed administrative information useful to translate the admin forms (Social Security declarations to INPS - virtual DM2013) in statistical concepts. Additionally, a review of the methodology for the calculation on total jobs of those positions caracherized by a shorter working time (on-call and temporary workers). Finally, a complete re-design of the treatement of this source has been performed, implying the availability of a reacher detail on the single target variables.
All these improvements in the OROS-LES source have been introduced, at enterprise level, from Q1:2021 onwards. In order to get coherent time series starting from Q1:2000, the spans of the time series of the OROS-LES target variables, available according to the two different bases, have been harmonized applying link coefficients (see '8.2 Comparability - over time').
Figure 5a below puts in evidence the main effects on the LCI, in the B to N Nace Rev.2 aggregate, of the transition of the OROS-LES-VELA sources from the old to the new base. The year-on-year growth rates calculated according to the two bases, raw format, are compared. Due to the methodology used for the recontruction of the time series, differences affect only the time span starting from Q12021 and are quite negligible, both on total labour cost and on hours worked, as underlined by the graphs (figure 5a, 5b and 5c). Main responsible for the LCI revisions in this period is the refresh of the LES panel.
Figure 5a – The LCI index on the hourly total labour cost in the B to N Nace Rev.2 aggregate according to VELA-LES and OROS-LES sources, base 2015 and base 2021. (Y-on-Y growth rates Q1:2001-Q4:2023)
Figure 5b – TLC in the B to N Nace Rev.2 aggregate according to OROS-LES sources, base 2015 and base 2021. (Y-on-Y growth rates Q1:2001-Q4:2023)
Figure 5c – HW in the B to N Nace Rev.2 aggregate according to VELA-LES and OROS-LES sources, base 2015 and base 2021. (Y-on-Y growth rates Q1:2001-Q4:2023)
[1] For further details about LES refer to the Information System for Survey documentation and Quality Control (Siqual), available on Istat’s Internet website: (Siqual istat).
[2] Further details on VELA can be found in the Siqual website: (Siqual istat).
[3] For a brief description of the OROS survey see Rapiti et al. (2010), Istat (2019) and at the Siqual website: (Siqual istat).
[4] Since December 2013 the production domain of the OROS-LES-VELA system has been enlarged to the P to S aggregates, being the target population the private firms. This system has been furtherly improved in the P to S domains in occasion of the transition of the three surveys to the new base 2015=100 in June 2018. In the next future this extension would imply a gradual integration of the NA source with the OROS-LES-VELA in the estimates of the private part of the P to S aggregate for LCI. The NA source will therefore be used only to calculate the public sector aggregates. It is worth informing that the current asset of the Italian Social Security System is going to be interested by a radical change. Since the beginning of 2010 various agencies managing Social Security for various categories of workers (including the public sector) are going to be gradually centralized around INPS. This change will imply, in the future, the building and development of one complex IT architecture, where all the Social Security information will converge. This could imply the availability of a coherent system of admin data, covering all the employees and the economic aggregates for the production of more consistent official statistics. Recent studies have been set up at Istat to exploit the data flow on the public sector. Many interesting evidences have already been drawn but several studies are still necessary to translate the admin data into statistical concepts.
[5] For further details on the DM10s declaration system see the LCI 2009 Quality Report.
[6] The exploitation of this further information from the BR and the Tax Register was as essential step to allow OROS coverage extention to personal service activities (P to S Nace Rev.2 sections), implemented in December 2013 (for further details see §4 '3.1 Source data' in QR2013).
[7] For a description of the past technique to calculate the hours worked see the LCI Quality Report 2009-2012.
[8] In the “administrative and support service activities” (N section of Nace Rev.2), the temporary employment agency activities (78.2 of Nace Rev.2) are excluded both from VELA and LES.
[9] Information on the P to S sectors have been collected since the first quarter of 2010, to the limited extent of the job-vacancies and hours worked indicators. In occasion of the transition to the new base 2015=100 (STS), for large enterprises information on the P to S sectors have been enlarged also to labour cost variables starting from the first quarter of 2015.
[10] An exception is the time series of the hours worked by VELA-LES for section L, available since Q4:2007, as already explained in '3.1 Source data'.
Not Applicable
According to the Commission Regulation (EC) No 1216/2003 of 7 July 2003, Member States shall transmit the quarterly results of their LCI statistics to the Commission (Eurostat) no later than 70 days after the end of the reference period. Last year, the deliveries met timeliness (length of time between LCI data availability and their reference period) and punctuality (time lag between actual delivery of data and scheduled date of delivery), according to the calendar defined by Eurostat, in all the quarters.
Table 1 - Timeliness in the delivery of LCI.
Not applicable.
In occasion of the transition of the OROS-LES and VELA-LES to the new base 2015=100, in June 2018, according to the EU-STS Regulation requirements (see §4 Main changes due to the transition of the data sources to the new base 2015=100 '3.1 Source data' in in the Italian LCI QR 2017), several methodological innovations and metadata revisions have been introduced, implying changes in microdata affecting, at more levels, figures of the main target variables involved in the calculation of the LCI since Q1:2015. Innovations have not been extended at micro level to the time interval ranging from Q1:2000 to Q4:2014. In order to guarantee coherence between the two spans of the time series, linking factors have been calculated on overlapping periods and applied to the quarters estimated in old methodology [1]. This practice has been used for the target variables estimated by the OROS-LES source. As far as the per-capita hours worked drawn by VELA-LES are concerned, no linking factors have been used. As far as the aggregates calculated using NA data, no innovations have been introduced, preserving the old coherence in the O to S time series.
In June 2019 the LCI time series have been delivered in new base year 2016=100. For Italy this transition has implied only the shift of the base year in the calculation of the index and no methodological changes have been introduced. So, no linking factors have been used to re-establish coherence in the time series, because no breaks are present.
In June 2020, in order to reduce the impact of the higher non-response rates recorded by the survey on hours worked (Vela) for Q1:2020, due to the Covid emergency, some changes have been introduced in the strata used for the calibration of the sample data. These changes should have guaranteed more robust estimates of the per-capita hours worked used to compile the denominator of the B-N Italian LCI indices. Furthermore in order to comply with the higher non-reporting in admin data observed for the month of March, consequence of the dilation of the admin deadlines admitted during the Covid crisis, the total population of the employees for the B-N private sectors used to calculate total hours worked, has been estimated with the help of an additional admin source (the Compulsory Communications of the contracts’ activations and cessations). The use of this additional source should have guaranteed more robust estimates of the total hours worked. Finally, the QNA estimates used for the compilation of the O-S aggregates have been calculated in a context of reduced data sources availability, implying some ad-hoc solutions.
Starting from the release of March 2021, to better asses the high reduction of labour input (at denominator of LCI) due to the massive use of the social security nets during the Covid crisis new improvements have been introduced. In particular, these improvents regard both the estimate of jobs and the use of the per capita hours worked for total enterprises instead of those with 10+ (see concepts '3.1.1. The LCI as an output of an integrated system' and '3.1.3. The denominator: the hours worked estimate').
Harmonized time series have been reconstructed starting from 2000.
In June 2023 the LCI time series have been delivered in new base year 2020=100. For Italy this transition has implied only the shift of the base year in the calculation of the index and no methodological changes have been introduced. So, no linking factors have been used to re-establish coherence in the time series, because no breaks are present.
In occasion of the transition of the OROS-LES and VELA-LES to the new base 2021=100, in June 2024, according to the EU-STS Regulation requirements (see '§3.1.4 Main changes due to the transition of the data sources to the new base 2021=100' and '3.1 Source data' in in the Italian LCI QR 2023), several methodological innovations and metadata revisions have been introduced, implying changes in microdata affecting, at more levels, figures of the main target variables involved in the calculation of the LCI since Q1:2021. Innovations have not been extended at micro level to the time interval ranging from Q1:2000 to Q4:2020. In order to guarantee coherence between the two spans of the time series, linking factors have been calculated on overlapping periods and applied to the quarters estimated in old methodology [2]. This practice has been used for the target variables estimated by the OROS-LES source. As far as the per-capita hours worked drawn by VELA-LES are concerned, no linking factors have been used. As far as the aggregates calculated using NA data, no innovations have been introduced, preserving the old coherence in the O to S time series.
[1] The link coefficients have been calculated as ratios between the totals referred to year 2015 in old and new methodology, for each of the target variables, at the level of 2-digit Nace. These coefficients have been applied to the totals of the same variables for the quarters from Q1:2000 to Q4:2014.
[2] The link coefficients have been calculated as ratios between the totals referred to year 2021 in old and new methodology, for each of the target variables, at the level of 2-digit Nace. These coefficients have been applied to the totals of the same variables for the quarters from Q1:2000 to Q4:2020.


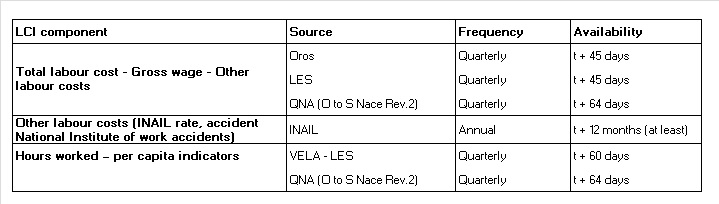
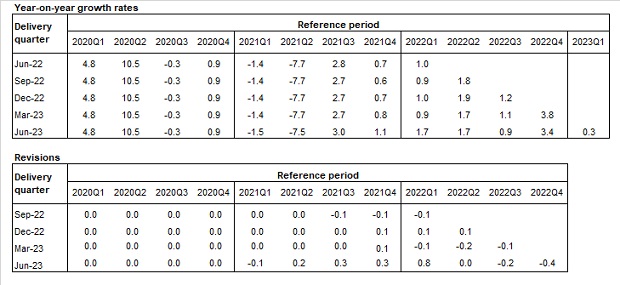
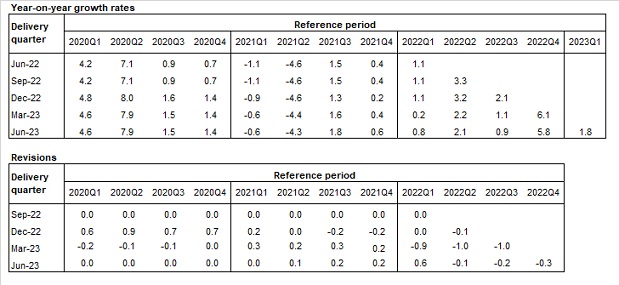
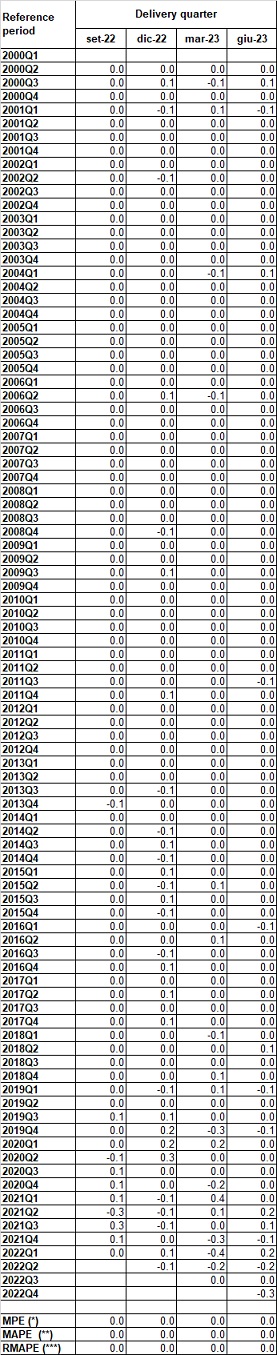
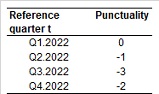
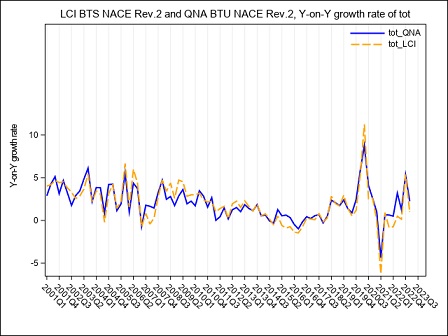
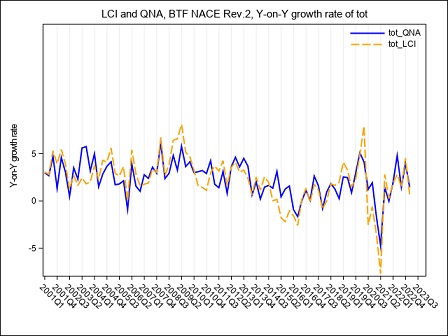
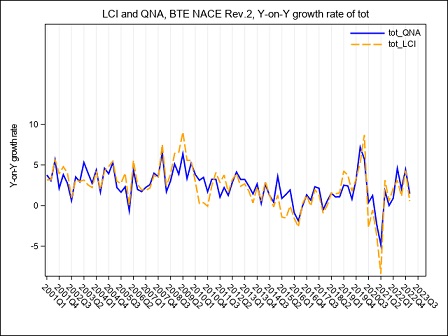
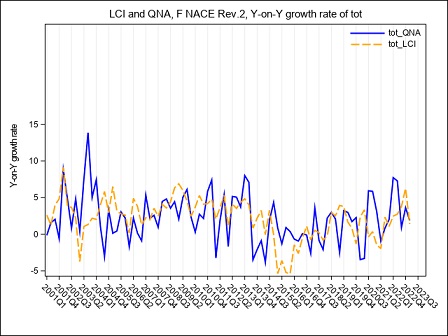
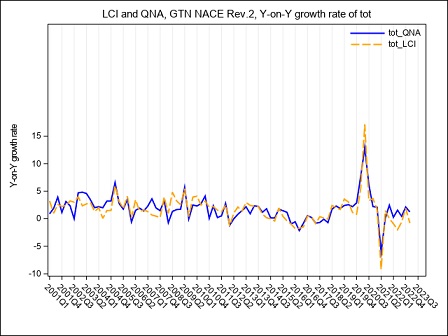
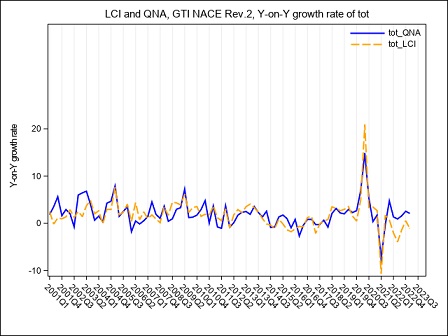
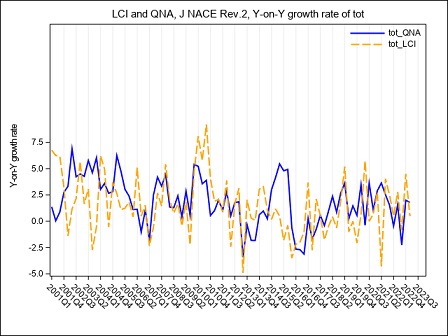
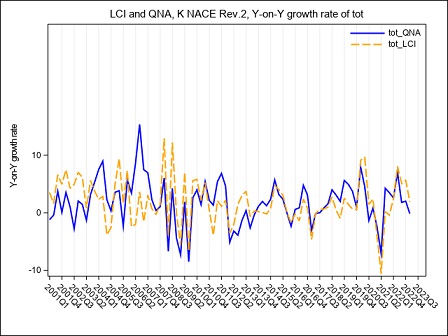
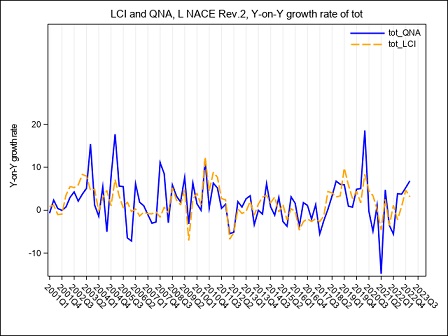
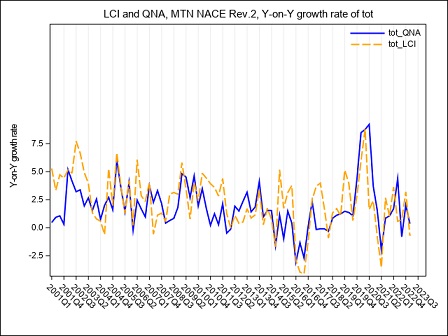
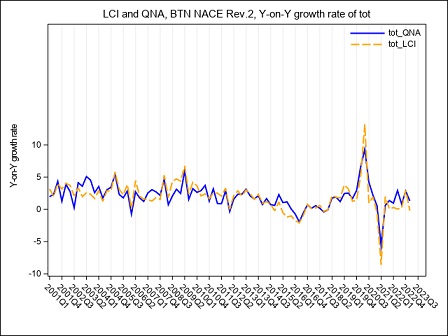
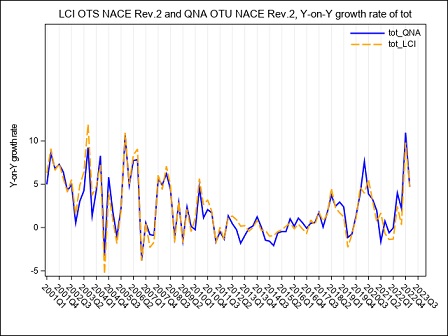
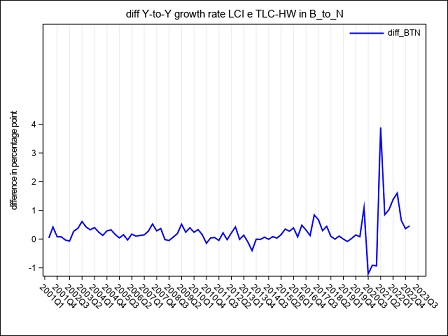
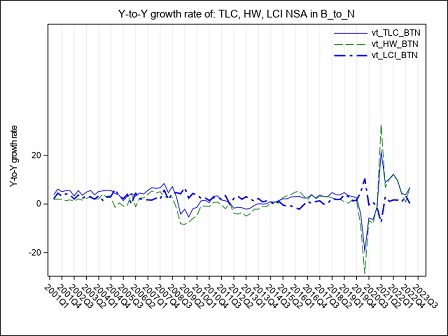
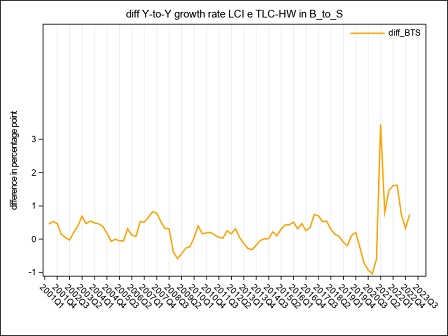
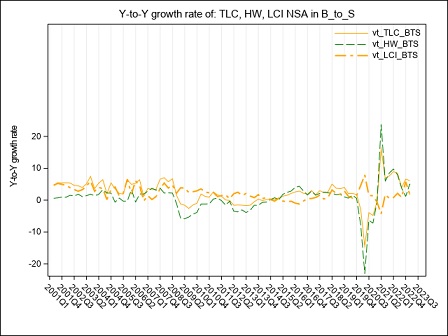
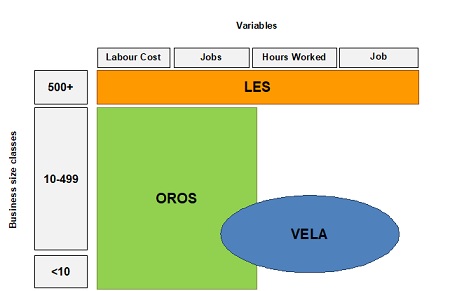
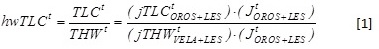
 is the per-capita indicator on total labour cost and
  is the per-capita indicator on hours actually worked. The three sources reconciliation is guaranteed by the number of jobs
  drawn from the OROS-LES subsystem.