Reference metadata describe statistical concepts and methodologies used for the collection and generation of data. They provide information on data quality and, since they are strongly content-oriented, assist users in interpreting the data. Reference metadata, unlike structural metadata, can be decoupled from the data.
The quarterly data are broken down by economic activity (at section level) in accordance with NACE Rev. 2 - Statistical classification of economic activities in the European Community.
2.3. Coverage - sector
All economic activities defined by NACE Rev. 2 are covered, with the exception of the activities of households as employers (T) and the activities of extraterritorial organisations and bodies (U).
2.4. Statistical concepts and definitions
A 'job vacancy' is defined as a paid post that is newly created, unoccupied, or about to become vacant:
(a) for which the employer is taking active steps and is prepared to take further steps to find a suitable candidate from outside the enterprise concerned; and
(b) which the employer intends to fill either immediately or within a specific period of time.
‘Active steps´ to find a suitable candidate include:
notifying the job vacancy to the public employment services,
contacting a private employment agency/head hunters,
advertising the vacancy in the media (for example internet, newspapers, magazines),
advertising the vacancy on a public notice board,
approaching, interviewing or selecting possible candidates/potential recruits directly,
approaching employees and/or personal contacts,
using internships.
'Specific period of time’ refers to the maximum time the vacancy is open and intended to be filled. That period shall be unlimited; all vacancies for which active steps are continuing on the reference date shall be reported.
An 'occupied post’ means a paid post within an enterprise/institution to which an employee has been assigned.
2.5. Statistical unit
Enterprise, institution or organisation.
2.6. Statistical population
List of economically active units, excluding sole proprietors without employees. The list is generated from the Business Register for Statistical Purposes.
2.7. Reference area
Estonia as whole
2.8. Coverage - Time
From 2008 (the aggregated NACE sections B-S from 2005).
2.9. Base period
Not applicable.
3.1. Source data
Identification of the source of the data
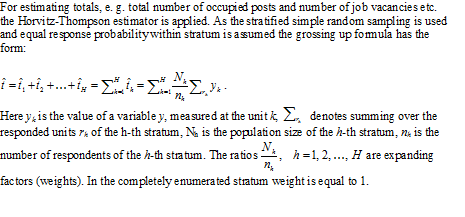
The survey on job vacancies and labour turnover in Estonia was implemented as a probability sample survey. The target population of the survey consisted of enterprises, institutions and organisations. Non-profit organisations and foundations with less than 50 employees and self-employed entrepreneurs with number of employees zero are excluded from the survey.
The sampling frame of the survey was the register of economically active enterprises, institutions and organisations. This register is held and updated once a year by Statistics Estonia. Before sample selection the population was stratified with respect to economic activity and number of employees. In each stratum a simple random sample was selected. All enterprises, institutions and organisations with 50 or more employees were completely enumerated.
Coverage
Geographical
The whole country is covered.
NACE
Sections A-S of NACE Rev. 2 are covered.
Enterprise size
Enterprises with one and more employees (statistical units by size classes 1-9, 10-49 and 50+ employees are covered)
Definition of the statistical unit
Statistical unit is an enterprise, institution or organisation.
Remarks
None.
Sampling design
Base used for the sample
In 2024 the survey population consisted of 94, 679 statistical units.
Sampling design
State-owned and municipal institutions as well as enterprises and non-profit organisations with 50 and more employees, totally 1, 925 units, were selected into the survey with probability 1. The remaining part of the survey units was divided into two parts:
enterprises with 1 - 9 employees (84, 818 units),
enterprises with 10 - 49 employees (7, 936 units).
Retention/renewal of sampling units
For selecting samples and in order to rotate samples, permanent random numbers and coordinating by response burden are used. Method accounts with response burden over all surveys with similar sample design beginning from year 2020. Sample is taken from sorted frame, where units are sorted from lower to higher response burden and permanent random numbers. Overlapping rate between two consecutive year samples is 50-70%, depending on changes in frame.
Sample size
The final total sample size was 3,814. The survey population and samples broken down by economic activity and number of employees and respective sampling fractions are given in Table 1.
Stratification
The population of the both parts was stratified with respect to economic activity basing on section level of NACE Rev. 2 and number of employees using 2 classes. The survey population and samples broken down by economic activity and number of employees and respective sampling fractions are given in Table 1.
Other sources
Maintenance agency
Not applicable
Updating frequency
Not applicable
Rules for clearance (of outdated information)
Not applicable
Voluntary/compulsory reporting and sanctions
Not applicable
Remarks
Table 1. The survey population and samples broken down by economic activity and number of employees and respective sampling fractions, 2024
Sampled part (Enterprises with 1-9 employees excluding state-owned and municipal institutions)
Sampled part (Enterprises with 10-49 employees excluding state-owned and municipal institutions)
Completely enumerated part (State-owned and municipal institutions and enterprises with 50 and more employees)
Statistical population
Sample size
Sample coverage %
Statistical population
Sample size
Sample coverage %
Statistical population
Sample size
TOTAL
84818
1009
1%
7936
880
11%
1925
1925
A
3281
34
1%
268
30
11%
22
22
B
72
30
42%
38
30
79%
11
11
C
5148
62
1%
1250
118
9%
458
458
D
158
30
19%
35
30
86%
12
12
E
166
30
18%
59
30
51%
17
17
F
11537
125
1%
937
79
8%
62
62
G
12000
129
1%
1092
97
9%
224
224
H
4705
51
1%
505
44
9%
96
96
I
2443
30
1%
571
50
9%
59
59
J
4959
46
1%
298
30
10%
100
100
K
961
30
3%
83
30
36%
32
32
L
10201
86
1%
129
30
23%
14
14
M
11642
104
1%
436
38
9%
57
57
N
3863
39
1%
381
35
9%
94
94
O
63
30
48%
100
30
30%
121
121
P
1905
30
2%
769
76
10%
374
374
Q
1834
30
2%
465
43
9%
108
108
R
3455
35
1%
305
30
10%
53
53
S
6425
58
1%
215
30
14%
11
11
3.2. Frequency of data collection
Reference dates
The data is collected monthly. The reference date of collected data is the last calendar day of the reference month. From enterprises, institutions and organisations with over 50 employees data is collected every month and from enterprises, institutions and organisations in sampled part data is collected once in quarter. Quarterly data is put together using monthly data.
3.3. Data collection
Brief description of the data collection method(s)
Remarks
1) Job vacancies
Data to estimate vacant posts are collected through eSTAT (the web channel for electronic data submission). eSTAT is also used to monitor the completion of questionnaires. The questionnaires have been designed for completion in eSTAT by the respondents themselves and they include instructions and controls. The questionnaires and information about data submission are available on Statistics Estonia’s website (in English).
From 2018 onwards, data about vacant posts are collected with the quarterly statistical questionnaire "Wages and salaries and labour force". The statistical unit is an enterprise, institution or organisation. The population of a survey consists of all economically active units. The register of economically active units is based on the Estonian Enterprise Register. The register of economically active units is updated every year.
Since 1997 the completely surveyed part is formed of enterprises with 50 or more employees and of all state and municipal organisations and institutions. From the remaining part of the population, i.e. from enterprises with less than 50 employees a stratified simple random sample is selected. Non-profit organisations with less than 50 employees were excluded from the survey until 2018. Since the 1st quarter of 2018 non-profit organisations with less than 50 employees were included in the population. Since the 1st quarter of 2020 state and municipal organisations and institutions with less than 50 employees are not included in completely surveyed part.
From the completely enumerated part, data are collected every month.
For the sampled part the quarterly data is collected once in a quarter - the units are divided between the three months where for each unit one month represents the whole quarter.
For selecting samples and in order to rotate samples, permanent random numbers are used. Each year the number 0.02 is added to the starting point of a sample. It means that on the average in stratum where sampling fraction is 10%, one fifth of units are changed. So, after 5 years can expect that the whole sample is replaced entirely.
For selecting samples and in order to rotate samples, permanent random numbers and coordinating by response burden are used. Method accounts with response burden over all surveys with similar sample design beginning from year 2020. Sample is taken from sorted frame, where units are sorted from lower to higher response burden and permanent random numbers. Overlapping rate between two consecutive year samples is 50-70%, depending on changes in frame.
Data are collected electronically and a very small part by telephone.
2) Occupied posts
From 2018 onwards, to estimate the number of occupied posts and labour turnover, Statistics Estonia uses the data of the employment register of the Estonian Tax and Customs Board.
Until 2018, data to estimate the number of occupied posts and labour turnover were collected through eSTAT.
From 2018 onwards, the number of vacant and occupied posts were published as on the 15th day of the second month of a quarter. From 2018 onwards, the quarterly average number of job vacancies and occupied posts are published as at the end of the month. The number of job vacancies is the quarterly average number of job vacancies as at the end of the month.
3.4. Data validation
The first quality validation rules are activated in eStat. After all the data form eStat are loaded to the system, second quality controls are activated.
3.5. Data compilation
Brief description of the weighting method
Weighting dimensions
Outliers:
Outliers are identified separately for employees and for vacancies using thresholds. In the size class of enterprises with less than 10 employees enterprises are considered as outliers if their number of employees is more than 49 or their number of vacancies is more than 9. In the size class of enterprises with between 10 and 49 employees enterprises are considered as outliers if their number of employees is more than 99, or their number of vacancies is more than 49. Outliers were treated by being given a weight of one.
3.6. Adjustment
Since 2013 Estonia has transmitted seasonally adjusted data.
Seasonal adjustment of all time series is done with the aid of the program JDEMETRA+ and applying the method TRAMO/SEATS (using direct approach).
4.1. Quality assurance
To assure the quality of processes and products, Statistics Estonia applies the EFQM Excellence Model, EU Statistics Code of Practice and the ESS Quality Assurance Framework (QAF). Statistics Estonia is also guided by the requirements provided for in § 7. „Principles and quality criteria of producing official statistics” of the Official Statistics Act.
4.2. Quality management - assessment
Statistics Estonia performs all statistical activities according to an international model (Generic Statistical Business Process Model – GSBPM). According to the GSBPM, the final phase of statistical activities is overall evaluation using information gathered in each phase or sub-process (this information includes, among other things, feedback from users, process metadata, system metrics and suggestions from employees). This information is used to prepare the evaluation report which outlines all the quality problems related to the specific statistical activity and serves as input for improvement actions.
5.1. Relevance - User Needs
Description of the national users and their main needs
Remarks
Main users are Estonian Government, different ministries (mainly Ministry of Finance, Ministry of Social Affairs, etc.), Estonian Unemployment Insurance Fund, scientific institutions, foreign and local employer's associations, trade unions, media, Eurostat and other EU institutions and Statistics Estonia itself.
Above mentioned users are more interested in the job vacancies and occupied posts. As our survey questionnaire includes variables about labour turnover, they are also interested in the engaged and left employees.
Suggestions made by users and information on how Statistics Estonia will take these into account are available on the Statistics Estonia website.
None
5.2. Relevance - User Satisfaction
Extent to which the needs of national users are satisfied (voluntary)
Remarks
Since 1996 Statistics Estonia conducts reputation surveys and user surveys. Results are available on the website.
None
5.3. Completeness
Description of missing variables and missing breakdowns of the variables
Report progress on the implementation measures regarding quarterly job vacancies statistics of Regulation (EC) No 453/2008, including:
a detailed plan and timetable for completing implementation
a summary of the remaining deviations from EU concepts
There are no missing variables or breakdowns.
Methodology corresponds to the target methodology of the European Job Vacancies.
The number of job vacancies on the last day of the reference month is newly created, unoccupied or about to become vacant paid post for which the employer is taking active steps and is prepared to take further steps to find a suitable candidate from outside an enterprise/institution/organisation concerned and which the employer intends to fill either immediately or within a specific period of time.
Number of occupied posts is equal to the number of paid posts within an enterprise/institution/organisation to which an employee has been assigned on the last day of the reference month. Employee is a person with whom a contract has been signed for a fixed or unfixed period (incl. contracts of seasonal work); a person working under employment contract, service contract or Public Service Act.
5.3.1. Data completeness - rate
100%
6.1. Accuracy - overall
The type of survey and the data collection methods ensure sufficient coverage and timeliness.
6.2. Sampling error
See point 6.2.1.
6.2.1. Sampling error - indicators
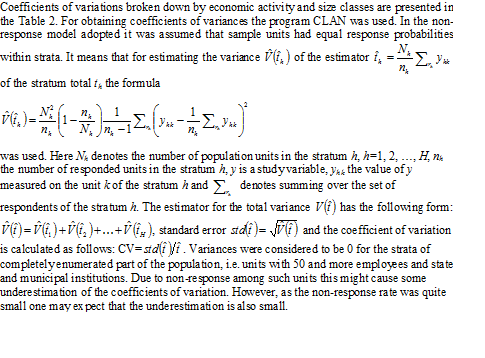
Coefficient of variation (taking into account the sampling design) or estimated sampling error for the number of job vacancies (see guidelines).
The standard errors, coefficients of variation and response rates were calculated (see the tables attached)
Information on variables with non-negligible measurement and processing errors
Information on main sources of (non-negligible) measurement and processing errors and, if available, on methods applied for correction
Estimation bias: An assessment of the non-sampling errors, in terms of the absolute number of vacant posts, for the total number of job vacancies and, where possible, for aggregation level of NACE Rev. 2 specified in Annex 1 to this Regulation and size classes (1-9, 10 + employees).
Remarks
The procedures include also a logical checking process after the data entry process. Contacts with the respondents are made to explain or correct data. After contacts with respondents and corrections the logic tests were used again. There are some problems with reporting the variable of job vacancies in private sector. The variable of job vacancies is under extra priority. Coherence checks are applied. The number of job vacancies is compared with the data of previous quarter.
None
Bias is difference between true and estimated value. True value is not known for variable vacant post. Assessment of bias caused by non-sampling errors is based on the number of employed persons which is known for each unit in the frame. Total number of employed persons in the frame is compared with estimated value of the same variable based on the responded units using non-response adjusted weights.
Table attached shows estimated values for the first quarter of 2023 and estimated bias. The total number of employed persons is slightly overestimated which shows that responded units are on average larger than non-responded units.
Description of any difference between the reference population and the study population
Description of classification errors
Description of any difference between the reference dates and the reference quarter
Any other relevant information
Under-coverage of the sampling frame is caused by delay between selection of the sample and data collection. Sample for all quarters of 2024 is selected from the frame updated at the 01 November 2023. Population frame included 94,679 units. During 2024 when survey was conducted new units were born which causes under-coverage error. There were 1,456 new units in the frame in November 2023.
As of 2018, changes have been made in the population and sample. Since 2018, the population includes economic entities with at least one employee (previously the population was based on persons employed) and non-profit associations and foundations with less than 50 employees (previously they were excluded). The changes affected the most sectors L, R and S. Sector O was also influenced by the administrative reform.
From the 1st quarter of 2018 data on job vacancies are collected with the new questionnaire “Wages and salaries and labour force”, which replaced the previous questionnaires “Labour turnover, occupied and vacant posts” and “Labour turnover, occupied and vacant posts by county”.
From the 1st quarter of 2018 only administrative data is used for occupied post. Data on occupied posts are received from the Employment Register of the Estonian Tax and Customs Board.
Since the 1st quarter of 2020 state and municipal organisations and institutions with less than 50 employees are not included in completely surveyed part.
Not applicable
6.3.1.1. Over-coverage - rate
Over-coverage rates in 2024:
1st quarter – 5.1%
2nd quarter – 6.5%
3rd quarter – 7.7%
4th quarter – 8.9%
Those rates are calculated as ratios of the estimated number of non-active units over the total number of units in the population. Number of non-active units is estimated based on the sample using non-response adjusted weights.
6.3.1.2. Common units - proportion
Not applicable.
6.3.2. Measurement error
See 6.3 non-sampling error.
6.3.3. Non response error
See points below.
6.3.3.1. Unit non-response - rate
Unit response rate
The Table attached presents response rates by quarters in year 2024. Respondents include also enterprises and institutions, which have informed us of their liquidation.
Item imputation rate and methods and, where possible, the effect of imputation on the estimates for the variables transmitted
Let us consider the part of the population which is investigated by sample survey. It is assumed that among the nonrespondents of each stratum there are relatively as many economically active units as among the respondents of this stratum. The missing data of those assumed to be active nonrespondents are imputed by the corresponding means of the active respondents. As a matter of fact, within a stratum equal response probability is assumed. Missing data of nonrespondents belonging to the completely enumerated part of the population are imputed by using the hot deck method. If the number of employees of a nonrespondent is 100 and more employees, the missing data of this unit are imputed by the data of the previous period of the same unit.
The rate of imputed units from completely enumerated strata varied between 0.1 - 0.3% by quarters in 2024.
6.3.5. Model assumption error
If modelling is used, include a description of the models used. Particular emphasis should be given to models for imputation or grossing-up to correct for unit non-response.
The main error caused by the choice of a certain model is probably concerned with the non-response model among sampled units. The assumption is made that the distribution of non-respondents is similar to that of respondents but this assumption may not be true in some strata.
No data from administrative sources were used. All results presented are based on the data that has been collected only with the survey.
6.4. Seasonal adjustment
Brief description of seasonal adjustment procedures, in particular with regard to the European Statistical System guidelines on seasonal adjustment which have been endorsed and supported by the SPC.
Since 2013 Estonia has transmitted seasonally adjusted data.
Seasonal adjustment of all time series is done with the aid of the program JDEMETRA+ and applying the method TRAMO/SEATS (using direct approach).
Provide a revision history, including the revisions in the published number of job vacancies and a summary of the reasons for the revisions.
Quarterly data are not revised. Databases are closed at the deadline.
6.6.1. Data revision - average size
not applicable
7.1. Timeliness
See point below.
7.1.1. Time lag - first result
Information on the time span between the release of data at national level and the reference period of the data.
The quarterly data on job vacancies and occupied posts in 2024 were published by Statistics Estonia within 70 days after the end of the reference quarter. There were no delays.
7.1.2. Time lag - final result
See point 7.1.1.
7.2. Punctuality
See point 7.2.1.
7.2.1. Punctuality - delivery and publication
Deadlines for the respondents to reply, also covering recalls and follow-ups
Period of the fieldwork
Period of data processing
Dates of publication of first results
Remarks
The sample was selected in November 2023 by NACE Rev. 2. At the end of the year 2023 the questionnaire and explanatory notes were uploaded in the website of Statistics Estonia and in e-STAT (environment for electronic data submission of Statistics Estonia).
The time of recording job vacancies is the last calendar day of the reference month. The deadline for returning completed questionnaires was set to the 18th calendar day after the reference month.
28 working days.
The data entry process was started immidiately when the completed questionnaires were being received. The completed questionnaires were mostly received via e-STAT.
The data checking process was started approximately one week after the deadline.
After recontacts with respondents and corrections, the logic tests were used again.
The first results of data were published at the national level in accordance with dates announced in official release calendars with no delays.
None
8.1. Comparability - geographical
Information on differences between national and European concepts, and — to the extent possible — their effects on the estimation.
Definitions of variables and classifications used in Estonia coincide with corresponding European definitions and classifications. The quarterly job vacancy and labour turnover survey was implemented in compliance with Regulation (EC) No 453/2008 of the European Parliament and of the Council.
8.1.1. Asymmetry for mirror flow statistics - coefficient
Not applicable.
8.2. Comparability - over time
Information on changes in definitions, coverage and methods in any two consecutive quarters, and their effects on the estimation.
Remarks
No changes were made in definitions, coverage and methods in any two consecutive quarters.
None
8.2.1. Length of comparable time series
Not applicable.
8.3. Coherence - cross domain
Comparisons of data on the number of vacant jobs from other relevant sources when available, in total and broken down by NACE at section level when relevant, and reasons if the values differ considerably.
There were no other sources to compare the data of job vacancies by economic activity (NACE Rev. 2) in Estonia.
The Unemployment Insurance Fund reflects only these vacant jobs, which are transmitted by employers, who need their help to find suitable staff.
The news releases are made public on the web site of Statistics Estonia at 8 a.m. on the day announced in advance in the release calendar. The news releases of Statistics Estonia are available on the web site and in the Information Centre of Statistics Estonia (51 Tatari Str, Tallinn). The news releases are published quarterly.
After processing and analysing the data of job vacancies and labour turnover, the results of the survey are published in public database in the website of Statistics Estonia . The public database allows quick and easy access to statistics, besides it is possible to retrieve updated data for previous periods, to view selected data on the computer screen and download/save them in one’s own computer in different formats (Excel, PC-AXIS, HTML, etc.).
The data will be published quarterly with press release. The latest press releases can be found in this link.
9.2. Dissemination format - Publications
Dissemination scheme, including to whom the results are sent
Periodicity of national publication
References for publications of core results, including those with commentary in the form of text, graphs, maps, etc.
Information on what results, if any, are sent to reporting units included in the sample
After processing and analysing the data of job vacancies and labour turnover, the results of the survey are published in public database in the website of Statistics Estonia . The public database allows quick and easy access to statistics, besides it is possible to retrieve updated data for previous periods, to view selected data on the computer screen and download/save them in one’s own computer in different formats (Excel, PC-AXIS, HTML, etc.).
The news releases are made public on the web site of Statistics Estonia at 8 a.m. on the day announced in advance in the release calendar. The news releases of Statistics Estonia are available on the web site and in the Information Centre of Statistics Estonia (51 Tatari Str, Tallinn).
Quarterly
The latest press releases can be found in this link.
Results are not sent to the reporting units, however, the results were sent to Eurostat.
9.3. Dissemination format - online database
Data are published under the heading „Economy/ Wages and salaries and labour costs” in the Statistical Database in this link.
9.3.1. Data tables - consultations
Not applicable.
9.4. Dissemination format - microdata access
The dissemination of data collected for the purpose of producing official statistics is guided by the requirements provided for in § 34, § 35, § 36, § 37, § 38 of the Official Statistics Act. Access to micro-data and anonymisation of micro-data are regulated by Statistics Estonia’s „Procedure for dissemination of confidential data for scientific purposes”: in this link.
9.5. Dissemination format - other
Not applicable.
9.6. Documentation on methodology
Not applicable.
9.7. Quality management - documentation
Description of and references for metadata provided
References for core methodological documents relating to the statistics provided
Description of main actions carried out by the national statistical services to inform users about the data
Remarks
A description of the methodology and definitions are published on the website of Statistics Estonia. Quality Report is submitted to Eurostat.
Methodology corresponds to the target methodology of the Regulation (EC) No 453/2008 of the European Parliament and of the Council of 23 April 2008 on quarterly statistics on Community job vacancies.
Data on the population, sample and respondents, and the error estimates are published in the Statistical Database. Information to users about updating the statistical database is available on the website in the official release calendars.
None
9.7.1. Metadata completeness - rate
Not applicable.
9.7.2. Metadata - consultations
Not applicable.
Not applicable.
11.1. Confidentiality - policy
The dissemination of data collected for the purpose of producing official statistics is guided by the requirements provided for in § 34 and § 35 of the Official Statistics Act.
11.2. Confidentiality - data treatment
Disclosure rules: Brief description of when data have to be deleted for reasons of confidentiality
The treatment of confidential data is regulated by the Procedure for Protection of Data Collected and Processed by Statistics Estonia: . Statistics Estonia Privacy Policy weblink.
Certain data (by economic activity) are not published at a national level in next cases: number of job vacancies is less than 100, the coefficient of variation is more than 49% or frequency of number of job vacancies is less than 15 (see also point 6.2.1)
Special remarks
A job vacancies and labour turnover survey has been carried out since 1999 as national survey.
Harmonisation in this field was started in 2005 and was based on available documents of Eurostat.
The survey on job vacancies and labour turnover in Estonia was implemented as a probability sample survey.
Since 2005 the same sources, coverage by economic activity, number of employees (i.e size classes) and definitions of variables used in Estonia coincide with corresponding European definitions. The same methodology was employed.
A 'job vacancy' is defined as a paid post that is newly created, unoccupied, or about to become vacant:
(a) for which the employer is taking active steps and is prepared to take further steps to find a suitable candidate from outside the enterprise concerned; and
(b) which the employer intends to fill either immediately or within a specific period of time.
‘Active steps´ to find a suitable candidate include:
notifying the job vacancy to the public employment services,
contacting a private employment agency/head hunters,
advertising the vacancy in the media (for example internet, newspapers, magazines),
advertising the vacancy on a public notice board,
approaching, interviewing or selecting possible candidates/potential recruits directly,
approaching employees and/or personal contacts,
using internships.
'Specific period of time’ refers to the maximum time the vacancy is open and intended to be filled. That period shall be unlimited; all vacancies for which active steps are continuing on the reference date shall be reported.
An 'occupied post’ means a paid post within an enterprise/institution to which an employee has been assigned.
Enterprise, institution or organisation.
List of economically active units, excluding sole proprietors without employees. The list is generated from the Business Register for Statistical Purposes.
Estonia as whole
Not Applicable
The type of survey and the data collection methods ensure sufficient coverage and timeliness.
Not Applicable
Brief description of the weighting method
Weighting dimensions
Outliers:
Outliers are identified separately for employees and for vacancies using thresholds. In the size class of enterprises with less than 10 employees enterprises are considered as outliers if their number of employees is more than 49 or their number of vacancies is more than 9. In the size class of enterprises with between 10 and 49 employees enterprises are considered as outliers if their number of employees is more than 99, or their number of vacancies is more than 49. Outliers were treated by being given a weight of one.
Identification of the source of the data
The survey on job vacancies and labour turnover in Estonia was implemented as a probability sample survey. The target population of the survey consisted of enterprises, institutions and organisations. Non-profit organisations and foundations with less than 50 employees and self-employed entrepreneurs with number of employees zero are excluded from the survey.
The sampling frame of the survey was the register of economically active enterprises, institutions and organisations. This register is held and updated once a year by Statistics Estonia. Before sample selection the population was stratified with respect to economic activity and number of employees. In each stratum a simple random sample was selected. All enterprises, institutions and organisations with 50 or more employees were completely enumerated.
Coverage
Geographical
The whole country is covered.
NACE
Sections A-S of NACE Rev. 2 are covered.
Enterprise size
Enterprises with one and more employees (statistical units by size classes 1-9, 10-49 and 50+ employees are covered)
Definition of the statistical unit
Statistical unit is an enterprise, institution or organisation.
Remarks
None.
Sampling design
Base used for the sample
In 2024 the survey population consisted of 94, 679 statistical units.
Sampling design
State-owned and municipal institutions as well as enterprises and non-profit organisations with 50 and more employees, totally 1, 925 units, were selected into the survey with probability 1. The remaining part of the survey units was divided into two parts:
enterprises with 1 - 9 employees (84, 818 units),
enterprises with 10 - 49 employees (7, 936 units).
Retention/renewal of sampling units
For selecting samples and in order to rotate samples, permanent random numbers and coordinating by response burden are used. Method accounts with response burden over all surveys with similar sample design beginning from year 2020. Sample is taken from sorted frame, where units are sorted from lower to higher response burden and permanent random numbers. Overlapping rate between two consecutive year samples is 50-70%, depending on changes in frame.
Sample size
The final total sample size was 3,814. The survey population and samples broken down by economic activity and number of employees and respective sampling fractions are given in Table 1.
Stratification
The population of the both parts was stratified with respect to economic activity basing on section level of NACE Rev. 2 and number of employees using 2 classes. The survey population and samples broken down by economic activity and number of employees and respective sampling fractions are given in Table 1.
Other sources
Maintenance agency
Not applicable
Updating frequency
Not applicable
Rules for clearance (of outdated information)
Not applicable
Voluntary/compulsory reporting and sanctions
Not applicable
Remarks
Table 1. The survey population and samples broken down by economic activity and number of employees and respective sampling fractions, 2024
Sampled part (Enterprises with 1-9 employees excluding state-owned and municipal institutions)
Sampled part (Enterprises with 10-49 employees excluding state-owned and municipal institutions)
Completely enumerated part (State-owned and municipal institutions and enterprises with 50 and more employees)
Statistical population
Sample size
Sample coverage %
Statistical population
Sample size
Sample coverage %
Statistical population
Sample size
TOTAL
84818
1009
1%
7936
880
11%
1925
1925
A
3281
34
1%
268
30
11%
22
22
B
72
30
42%
38
30
79%
11
11
C
5148
62
1%
1250
118
9%
458
458
D
158
30
19%
35
30
86%
12
12
E
166
30
18%
59
30
51%
17
17
F
11537
125
1%
937
79
8%
62
62
G
12000
129
1%
1092
97
9%
224
224
H
4705
51
1%
505
44
9%
96
96
I
2443
30
1%
571
50
9%
59
59
J
4959
46
1%
298
30
10%
100
100
K
961
30
3%
83
30
36%
32
32
L
10201
86
1%
129
30
23%
14
14
M
11642
104
1%
436
38
9%
57
57
N
3863
39
1%
381
35
9%
94
94
O
63
30
48%
100
30
30%
121
121
P
1905
30
2%
769
76
10%
374
374
Q
1834
30
2%
465
43
9%
108
108
R
3455
35
1%
305
30
10%
53
53
S
6425
58
1%
215
30
14%
11
11
Not Applicable
See point below.
Information on differences between national and European concepts, and — to the extent possible — their effects on the estimation.
Definitions of variables and classifications used in Estonia coincide with corresponding European definitions and classifications. The quarterly job vacancy and labour turnover survey was implemented in compliance with Regulation (EC) No 453/2008 of the European Parliament and of the Council.
Information on changes in definitions, coverage and methods in any two consecutive quarters, and their effects on the estimation.
Remarks
No changes were made in definitions, coverage and methods in any two consecutive quarters.