


1.1. Contact organisation
Turkish Statistical Institute (TurkStat)
1.2. Contact organisation unit
Science and Technology Statistics Group
1.3. Contact name
Confidential because of GDPR
1.4. Contact person function
Confidential because of GDPR
1.5. Contact mail address
Türkiye İstatistik Kurumu, Devlet Mah. Necatibey Cad. No:114 06420 Çankaya/ANKARA
1.6. Contact email address
Confidential because of GDPR
1.7. Contact phone number
Confidential because of GDPR
1.8. Contact fax number
Confidential because of GDPR
9 August 2021
2.1. Metadata last certified
30 May 2024
2.2. Metadata last posted
30 May 2024
2.3. Metadata last update
30 May 2024
3.1. Data description
The Community Innovation Survey (CIS) is a survey about innovation activities in enterprises. The survey is designed to collect the information on types of innovation, processes of development of innovation like cooperation patterns, financing and expenditure, objectives of innovation activities or barriers for initiating or implementing innovation.
The CIS provides statistics by type of innovators, economic activity and size class of enterprises. The survey is currently carried out every two years across the EU Member States, EFTA countries and EU candidate countries.
In order to ensure comparability across countries, Eurostat together with the countries develops a Harmonised Data Collection (HDC) questionnaire and drafts the methodological recommendations for implementation of each survey round.
CIS 2020 is a second in a row to implement concepts and methodology of the Oslo Manual 4th Edition revised in 2018. The changes in the CIS driven by the revision of the manual and their impact on collected indicators are described in the Statistics Explained article: Community Innovation Survey – new features.
The legal framework for CIS since 2012 is the Commission Regulation No 995/2012 that establishes the quality conditions for the data collection and transmission and identifies the obligatory cross-coverage of economic sectors, size class of enterprises and innovation indicators. The target population are enterprises with at least 10 employees classified in the core NACE economic sectors (see 3.3). Further activities may be covered on a voluntary basis in national datasets. Most statistics are based on the 3-year reference period (t, t-1, t-2), but some use only one calendar year (t or t-2). Please refer to the Annex section of the European metadata (ESMS) for details of the time coverage of collected indicators.
3.2. Classification system
Indicators related to the enterprises are classified by country, economic activity (NACE Rev. 2), size class of enterprises and type of innovation.
The main typology of classification of enterprises in reference to innovation is the distinction between innovation-active enterprises (INN) and not innovation-active enterprises (NINN).
The enterprise is considered as innovative (INN) if during the reference period it successfully introduced a a) product or a) business process innovation, c) completed but not yet implemented the innovation, d) had ongoing innovation activities, e) abandoned innovation activities or was f) engaged in in-house R&D or R&D contracted out. Non-innovative (NINN) enterprises had no innovation activity mentioned above whatsoever during the reference period.
3.3. Coverage - sector
CIS covers main economic sectors according to NACE Rev.2 broken down by size class of enterprises and type of innovation activity.
3.3.1. Main economic sectors covered - NACE Rev.2
In accordance with Commission Regulation 995/2012 on innovation statistics, the following industries and services are included in the core target population. Results are made available with these following breakdowns :
All NACE – Core NACE (NACE Rev. 2 sections & divisions B-C-D-E-46-H-J-K-71-72-73 )
CORE INDUSTRY (excluding construction) (NACE Rev. 2 SECTIONS B_C_D_E)
10-12: Manufacture of food products, beverages and tobacco
13-15: Manufacture of textiles, wearing apparel, leather and related products
16-18: Manufacture of wood, paper, printing and reproduction
20: Manufacture of chemicals and chemical products
21: Manufacture of basic pharmaceutical products and pharmaceutical preparations
19-22: Manufacture of petroleum, chemical, pharmaceutical, rubber and plastic products
23: Manufacture of other non-metallic mineral products
24: Manufacture of basic metals
25: Manufacture of fabricated metal products, except machinery and equipment
26: Manufacture of computer, electronic and optical products
25-30: Manufacture of fabricated metal products (except machinery and equipment), computer, electronic and optical products, electrical equipment, motor vehicles and other transport equipment
31-33: Manufacture of furniture; jewellery, musical instruments, toys; repair and installation of machinery and equipment
D: ELECTRICITY, GAS, STEAM AND AIR CONDITIONING SUPPLY
E: WATER SUPPLY; SEWERAGE, WASTE MANAGEMENT AND REMEDIATION ACTIVITIES
36: Water collection, treatment and supply
37-39: Sewerage, waste management, remediation activities
CORE SERVICES (NACE Rev. 2 sections & divisions 46-H-J-K-71-72-73)(NACE code in the tables = G46-M73_INN)
46: Wholesale trade, except of motor vehicles and motorcycles
H: TRANSPORTATION AND STORAGE
49-51: Land transport and transport via pipelines, water transport and air transport
52-53: Warehousing and support activities for transportation and postal and courier activities
J: INFORMATION AND COMMUNICATION
58: Publishing activities
61: Telecommunications
62: Computer programming, consultancy and related activities
63: Information service activities
K: FINANCIAL AND INSURANCE ACTIVITIES
64: Financial service activities, except insurance and pension funding
65: Insurance, reinsurance and pension funding, except compulsory social security
66: Activities auxiliary to financial services and insurance activities
M: PROFESSIONAL, SCIENTIFIC AND TECHNICAL ACTIVITIES
71: Architectural and engineering activities; technical testing and analysis
72: Scientific research and development
73: Advertising and market research
71-73: Architectural and engineering activities; technical testing and analysis; Scientific research and development; Advertising and market research
3.3.1.1. Main economic sectors covered - NACE Rev.2 - national particularities
There is no additional breakdown for national survey. It is compatible with main sectors covered for Eurostat methodology.
3.3.2. Sector coverage - size class
In accordance with Commission Regulation 995/2012 on innovation statistics, the following size classes of enterprises according to number of employees are included in the core target population of the CIS:
- 10 - 49 employees
- 50 - 249 employees
- 250 or more employees
3.3.2.1. Sector coverage - size class - national particularities
There is no additional size class added for national survey. It is compatible with the size classes covered for Eurostat methodology.
3.4. Statistical concepts and definitions
The description of concepts, definitions and main statistical variables is available in CIS 2020 European metadata file (ESMS) Results of the community innovation survey 2020 (CIS2020) (inn_cis12) in Eurostat database.
3.5. Statistical unit
Enterprise
3.6. Statistical population
Core target population are all enterprises in CORE NACE activities (see 3.3.1) with 10 or more employees.
3.7. Reference area
Geographical coverage regardless of their population size as with all provincial and district centres located in the Republic of Turkey's border villages have been covered.
There is no regional dimension available.
3.8. Coverage - Time
Several rounds of Community Innovation Survey have been conducted so far at two-year interval since end of 90’s.
3.8.1. Participation in the CIS waves
| CIS wave | Reference period | Participation | Comment (deviation from reference period) |
| CIS2 | 1994-1996 | Yes | (1995-1997) |
| CIS3 | 1998-2000 | Yes | No deviation |
| CIS light | 2002-2003* | No | - |
| CIS4 | 2002-2004 | Yes | No deviation |
| CIS2006 | 2004-2006 | Yes | No deviation |
| CIS2008 | 2006-2008 | Yes | No deviation |
| CIS2010 | 2008-2010 | Yes | No deviation |
| CIS2012 | 2010-2012 | Yes | No deviation |
| CIS2014 | 2012-2014 | Yes | No deviation |
| CIS2016 | 2014-2016 | Yes | No deviation |
| CIS2018 | 2016-2018 | Yes | No deviation |
| CIS2020 | 2018-2020 | Yes | No deviation |
*two reference periods can be distinguished for CIS light: 2000-2002 and 2001-2003
3.9. Base period
Not relevant.
CIS indicators are available according to 3 units of measure:
NR: Number for number of enterprises and number of persons employed.
THS_EUR: Thousands of euros. All financial variables are provided in thousands of euros, i.e. Turnover or Innovation expenditure.
PC: Percentage. The percentage is the ratio between the selected combinations of indicators.
For CIS 2020, the time covered by the survey is the 3-year period from the beginning of 2018 to the end of 2020.
Some questions and indicators refer to one year — 2020.
The list of indicators covering the 3-year period and referring to one year according to the HDC is available in the Annex section of the European metadata (ESMS).
6.1. Institutional Mandate - legal acts and other agreements
CIS surveys are based on the Commission Regulation No 995/2012, implementing Decision No 1608/2003/EC of the European Parliament and of the Council on the production and development of Community statistics on science and technology.
This Regulation establishes innovation statistics on a statutory basis and makes the delivery of certain variables compulsory e.g. innovation activities, cooperation, development, expenditures and turnover (see the Regulation). Each survey wave may additionally include further variables.
In addition, the Regulation defines the obligatory cross-coverage of economic sectors and size class of enterprises.
6.1.1. National legislation
National legislation for CIS 2020 survey is based on the Turkish Statistical Institute Official Statistics Programme 2017-2021.
6.2. Institutional Mandate - data sharing
Not requested.
CIS data are transmitted to Eurostat via EDAMIS using the secured transmission system.
7.1. Confidentiality - policy
Statistical Law of Turkey, Article No:13. "Confidential data can be accessed only by the ones involved in the production of official statistics, to the extent that they need for performing their duties properly. If the number of the statistical unit in any cell of the data table formed by aggregating the individual data is less than three or one or two of the statistical units are dominant even if the number of units is three or more, the data in the concerned cell is considered confidential. The confidential data compiled, processed and preserved for the production of official statistics cannot be delivered to any administrative, judiciary or military authority or person, can not be used for purposes other than statistics or as an instrument of proof. Civil servants and other staff in charge of compiling and processing these data are obliged to comply with this rule. This obligation continues after the related personnel leave their duties and posts. The rulers of the institutions and organisations producing official statistics shall take all measures to prevent any illicit access, use or revelation of the confidential data. Data or information obtained from sources that are open to all people shall not be deemed confidential. Data confidentiality ceases when a statistical unit gives written approval for the revelation of confidential data concerning itself. Confidential data can be published only as combined with other data so as not to allow any direct or indirect identification."
7.2. Confidentiality - data treatment
Statistical Law of Turkey, Article No:13. " If the number of the statistical unit in any cell of the data table formed by aggregating the individual data is less than three or one or two of the statistical units are dominant even if the number of units is three or more, the data in the concerned cell is considered confidential. "
Due to this regulation, aggregation process is performed by combining data.
The information is collected to be used only for statistical work, privacy is guaranteed by Law No. 5429. It can not be used as evidence for emergence of any liability or investigation. This privacy is the legal responsibility of Turkish Statistical Institute.
8.1. Release calendar
Press Release Date: 24 December 2021
The other related issues were explained in sections 8.2 and 8.3
8.2. Release calendar access
https://data.tuik.gov.tr/Bulten/Index?p=Innovation-Survey-2020-37457&dil=2
It is the press release for Innovation Survey, 2020 results.
Annexes:
Innovation_Survey2020_Release_Calendar
8.3. Release policy - user access
TurkStat have Data Release Calendar based upon 5429 No. Turkey Statistics Law and Official Statistics Program.
The calendar offers users the specific dates for surveys to be published and has been updated regularly every year since 2007.
The link for data release calendar:
https://data.tuik.gov.tr/Bulten/Index?p=Innovation-Survey-2020-37457&dil=2
CIS is conducted and disseminated at two-year interval in pair years.
Accessibility and clarity refer to the simplicity and ease for users to access statistics using simple and user-friendly procedure, obtaining them in an expected form and within an acceptable time period, with the appropriate user information and assistance: a global context which finally enables them to make optimum use of the statistics.
10.1. Dissemination format - News release
https://data.tuik.gov.tr/Bulten/Index?p=Innovation-Survey-2020-37457&dil=2
The PDF file of the press release was attached below.
Annexes:
Innovationsurvey_2020
10.1.1. Availability of the releases
| Dissemination and access | Availability | Comments, links, ... |
| Press release | Yes | https://data.tuik.gov.tr/Bulten/Index?p=Innovation-Survey-2020-37457&dil=2 The results are published in press release (PDF, MS Excel and Word spreadsheets). Statistical tables are presented to the user under the survey details. |
| Access to public free of charge | Yes | |
| Access to public restricted (membership/password/part of data provided, etc) | Yes | There is option for users to sign in to be informed about statistics. Members are informed via e-mail in consideration with the topics requested. There is no restriction for any users or special access to any part of data except press release results. |
10.2. Dissemination format - Publications
- Online database (containing all/most results) : The users can access all the survey results, statistical tables and press release results from the web site. There is no specific online database for the survey.
https://data.tuik.gov.tr/Kategori/GetKategori?p=bilgi-teknolojileri-ve-bilgi-toplumu-102&dil=2
- Analytical publication (referring to all/most results) : There is no analytical publication.
- Analytical publication (referring to specific results, e.g. only for one sector or one specific aspect) : There is no analytical publication.
10.3. Dissemination format - online database
See the link and click Metadata / Scope of Data section https://data.tuik.gov.tr/Kategori/GetKategori?p=bilgi-teknolojileri-ve-bilgi-toplumu-102&dil=2
- Mining and quarrying (NACE B: 05-09)
- Manufacturing (NACE C: 10-33)
- Electricity, gas steam and air conditioning supply (NACE D: 35)
- Water supply; sewerage, waste management and remediation activities (NACE E: 36-39) (NACE E: 36-39)
- Wholesale trade, except of motor vehicles and motorcycles (NACE 46)
- Transportation and storage (NACE H: 49-53)
- Information and communication (NACE J: 58-63)
- Financial and insurance activities (NACE K: 64-66)
- Architectural and engineering activities; technical testing and analysis (NACE 71)
- Scientific research and development (NACE 72)
- Advertising and market research (NACE 73)
10.3.1. Data tables - consultations
Not requested.
10.4. Dissemination format - microdata access
The users can access the micro data from Micro Data Research Centers located in central building and regional offices.
10.4.1. Dissemination of microdata
| Mean of dissemination | Availability of microdata | Comments, links, ... |
| Eurostat SAFE centre | No | |
| National SAFE centre | Yes | |
| Eurostat: partially anonymised data (SUF) | Yes | Confidentiallity is considered during the data transmission to international organisations. |
| National : partially anonymised data | Yes | The information is collected to be used only for statistical work, privacy is guaranteed by Law No. 5429. It can not be used as evidence for emergence of any liability or investigation. This privacy is the legal responsibility of Turkish Statistical Institute. |
10.5. Dissemination format - other
There is no other dissemination format.
10.5.1. Metadata - consultations
Not requested.
10.6. Documentation on methodology
Analytical Framework, concepts, definitions, classifications, scope of the data, characteristics of basic data sources accounting conventions, compilation practices, revisions.
Everyone can access these related issues on "https://data.tuik.gov.tr/Kategori/GetKategori?p=bilgi-teknolojileri-ve-bilgi-toplumu-102&dil=2".
10.6.1. Metadata completeness - rate
Not requested.
10.7. Quality management - documentation
There is no on-line manual about the survey. The reference documentation is Oslo Manual and Regulations.
Some explanations about conceptual and methodological issues have been published in national website as metadata. Everyone can access these related issues on "https://data.tuik.gov.tr/Bulten/Index?p=Innovation-Survey-2020-37457".
11.1. Quality assurance
A national quality report is prepared by Science and Technology Statistics Group.
The statistics group in charge calculate the estimates for main variables; standard errors, confidence limits are examined by Quality Audit Group.
11.2. Quality management - assessment
- Response burden
- Difficult to understand some questions and/or concepts (using pop-up and/or more detailed clarifications from Oslo Manual)
- Interviewing with the most responsible person for the part of the survey. Especially for the 250+ size class enterprises (acquiring appointments from the top managers as much as we can)
- Schedule of sending data to Eurostat (By designing SAS codes, this lag has been tried to descreased)
- Data coherence (using some edit codes with the assistance of a software into the our survey)
- Obtaining turnover data from administrative records
Relevance is the degree to which statistics meet current and potential users’ needs. It includes the production of all needed statistics and the extent to which concepts used (definitions, classifications etc.) reflect user needs. The aim is to describe the extent to which the statistics are useful to, and used by, the broadest array of users. For this purpose, statisticians need to compile information, firstly about their users and their needs.
The CIS is based on a common questionnaire and a common survey methodology in order to achieve comparable, harmonised and high quality results for EU Member States, EFTA countries, Candidates and Associated countries.
12.1. Relevance - User Needs
Presidency Science, Technology and Innovation Policies Board: the main body for policy making related to R&D and innovation topics.
Ministry of Science and Technology: Organization of grant schemes for enterprises, tax incentives and exemptions based on related laws.
The Scientific and Technological Research Council of Turkey: Organization of grant schemes for enterprises.
Turkish Industry and Business Assosication, Technology Development Foundation of Turkey: Organization of grant schemes for enterprises.
Researchers and/or students: Micro data usage and following press release results.
12.1.1. Needs at national level
| User group | Short description of user group | Main needs for CIS data of the user group Users’ needs |
| 1. Institution - National level | Decision maker Presidency Science, Technology and Innovation Policies Board |
Science, Technology and Innovation Policies, Innovation Statistics |
| 2. Institution - National level | Grant provider Ministry of Science and Technology, The Scientific and Technological Research Council of Turkey |
Innovation Statistics, co-operations and SMEs |
| 3. Institution - National level | Decision maker Presidental Digital Transformation Office |
Innovation Statistics, co-operations and SMEs |
| 4. Social actors | Grant provider Turkish Industry and Business Assotiation, Technology Development Foundation of Turkey |
Innovation Statistics, co-operations and SMEs |
| 5. Researchers and/or students | - | Innovation Statistics |
12.2. Relevance - User Satisfaction
Not available
12.3. Completeness
The respondents must fill the questionnaire according to Turkey Statistical Law No. 5429 "7, 8, 9 and 10 of" harvested in accordance.
If the questionnaires are not completed at the desired time, or if they are answered incorrectly, administrative fines shall be applied according to Articles 53 and 54 of the related law.
The implementation of administrative monetary penalties and other penalties does not remove the statistical unit's obligation to provide information.
All mandatory sectors and indicators are covered in national CIS to comply with model questionnaire.
12.3.1. Data completeness - rate
Not requested.
13.1. Accuracy - overall
Accuracy in the statistical sense denotes the closeness of computations or estimates to the exact or true values. Statistics are not equal with the true values because of variability (the statistics change from implementation to implementation of the survey due to random effects) and bias (the average of the possible values of the statistics from implementation to implementation is not equal to the true value due to systematic effects).
13.2. Sampling error
That part of the difference between a population value and an estimate thereof, derived from a random sample, which is due to the fact that only a subset of the population is enumerated.
13.2.1. Sampling error - indicators
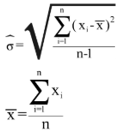
The main indicator used to measure sampling errors for CIS data is the coefficient of variation (CV).
Coefficient of Variation= (Square root of the estimate of the sampling variance) / (Estimated value)
Formula:
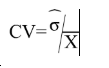
where
13.2.1.1. Coefficient of variations for key variables
Coefficient of variation (%) for key variables by NACE categories and for enterprises with 10 and more employees
| NACE |
Size class |
(1) |
(2) |
(3) |
| Core NACE (B-C-D-E-46-H-J-K-71-72-73) |
Total |
1.682 |
2.165 |
0.273 |
| Core industry (B_C_D_E - excluding construction) |
Total |
2.016 |
2.656 |
0.301 |
| Core Services (46-H-J-K-71-72-73) |
Total |
2.791 |
3.429 |
0.493 |
[1] = Coefficient of variation for the percentage of innovative enterprises (INN) in the total population of enterprises (ENT20)
[2] = Coefficient of variation for the turnover of product innovative enterprises with new or improved products (TUR_PRD_NEW_MKT), as a percentage of total turnover of product innovative enterprises [TUR20,INNO_PRD].
[3] = Coefficient of variation for percentage of product and/or process innovative enterprises (incl. enterprises with abandoned and or on-going activities) involved in any innovation co-operation arrangement [COOP_ALL,INN], as a percentage of innovative enterprises (INN).
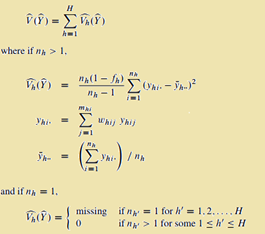
13.2.1.2. Variance estimation method
Standard error is calculated by the module survey freq and survey means under SAS 9.1.3 version. The standard error calculations related to proportions under this module is based on Taylor Series Linearization method. This module is a useful SAS procedure for generating results on the basis of both frequency tables and cross tables and their standard errors. In this module weighting procedures have also been taken into account. Formula used in the module is given below.
13.3. Non-sampling error
Non-sampling errors occur in all phases of a survey. They add to the sampling errors (if present) and contribute to decreasing overall accuracy. It is important to assess their relative weight in the total error and devote appropriate resources for their control and assessment.
13.3.1. Coverage error
Coverage errors (or frame errors) are due to divergences between the target population and the frame population. The frame population is the set of target population members that has a chance to be selected into the survey sample. It is a listing of all items in the population from which the sample is drawn that contains contact details as well as sufficient information to perform stratification and sampling.
13.3.1.1. Over-coverage - rate
Not requested.
13.3.1.2. Common units - proportion
Not requested.
13.3.1.3. Under covered groups of the target population
Under covered groups of the target population are compatible with the sum of core NACE.
13.3.1.4. Coverage errors in coefficient variation
Not available.
13.3.2. Measurement error
Measurement errors occur during data collection and generate bias by recording values different than the true ones. The survey questionnaire used for data collection may have led to the recording of wrong values, or there may be respondent or interviewer bias.
13.3.2.1. Measures for reducing measurement errors
Putting warnings into on-line questionnaire, preparing descriptive brochures to respondents, testing on-line questionnaire both in our centre and regional offices.
13.3.3. Non response error
Non response occurs when a survey fails to collect data on all survey variables from all the population units designated for data collection in a sample or complete enumeration.
There are two types of non-response:
1) Unit non-response, which occurs when no data (or so little as to be unusable) are collected about a population unit designated for data collection.
a) Un-weighted unit non-response rate (%) = 100*(Number of units with no response or not usable response) / (Total number of in-scope (eligible) units in the sample)
b) Weighted unit non-response rate (%) = 100*(Number of weighted units with no response or not usable response) / (Total number of in-scope (eligible) units in the sample)
2) Item non-response, which occurs when only data on some, but not all survey data items are collected about a population unit designated for data collection.
a) Un-weighted item non-response rate (%) = 100*(Number of units with no response at all for the item) / (Total number of eligible, for the item, units in the sample i.e. filters have to be taken into account)
There is no item non response for the survey.
Unit non response rates were shared under the related sub-items of the quality report.
13.3.3.1. Unit non-response - rate
See below.
13.3.3.1.1. Un-weighted and weighted unit non-response rate by NACE categories and for enterprises with 10 or more employed persons
Un-weighted and weighted unit non-response rate by NACE categories and for enterprises with 10 or more employees
| NACE | Number of eligible units with no response | Total number of eligible units in the sample | Un-weighted unit non-response rate (%) | Weighted unit non-response rate (%) |
| Core NACE (B-C-D-E-46-H-J-K-71-72-73) | 61 | 10811 | 0.564 | 0.942 |
| Core industry (B_C_D_E - excluding construction) | 27 | 6508 | 0.414 | 0.865 |
| Core Services (46-H-J-K-71-72-73) | 34 | 4303 | 1.790 | 1.040 |
The number of eligible units is the number of sample units, which indeed belong to the target population.
Number of eligible units in survey data is 10811. Weighted unit non-response rate is %0.942.
13.3.3.1.2. Maximum number of recalls/reminders before coding
2
13.3.3.2. Item non-response - rate
See below.
13.3.3.2.1. Item non-response rate for Turnover (in Core NACE: B-C-D-E-46-H-J-K-71-72-73 enterprises with 10 or more employed persons)
Item non-response rate for Turnover (in Core NACE: B-C-D-E-46-H-J-K-71-72-73 enterprises with 10 or more employees).
| Item non-response rate (un-weighted) | Imputation | If imputed, describe method used, mentioning which auxiliary information or stratification is used | |
| Turnover | 0 | There is no item non response. Turnovers are compiled by using administrative sources. |
13.3.3.2.2. Item non response rate for new questions
Item non-response rate for new questions in CIS t (in Core NACE: B-C-D-E-46-H-J-K-71-72-73 enterprises with 10 or more employees)
| NEW QUESTIONS IN CIS 2020 | Inclusion in national questionnaire | Item non response rate (un-weighted) | Comments |
| 2.2 Market environment | No | ||
| 2.8 Consequences of climate change for business activities | No | ||
| 3.16 Innovations with environmental benefits | No | ||
| 3.17 Drivers for innovations with environmental benefits | No |
13.3.4. Processing error
Data is entered by respondents via on-line survey. The user name and password are provided by TurkStat.
13.3.5. Model assumption error
Not requested.
Timeliness and punctuality refer to time and dates, but in a different manner.
14.1. Timeliness
The timeliness of statistics reflects the length of time between data availability and the event or phenomenon they describe.
14.1.1. Time lag - first result
Timeliness of national data – date of first release of national level : 24.11.2021
14.1.2. Time lag - final result
Not requested.
14.2. Punctuality
Punctuality refers to the time lag between the release date of data and the target date on which they were scheduled for release as announced officially.
14.2.1. Punctuality - delivery and publication
Date of transmission of complete and validated data to Eurostat (Number of days between that data and 16 September 2022) :
Comparability aims at measuring the impact of differences in applied statistical concepts and definitions on the comparison of statistics between geographical areas, non-geographical domains, or over time.
The coherence of statistical outputs refers to the degree to which the statistical processes by which they were generated used the same concepts (classifications, definitions, and target populations) and harmonised methods. Coherent statistical outputs have the potential to be validly combined and used jointly.
15.1. Comparability - geographical
The results are not published at regional level.
15.1.1. Asymmetry for mirror flow statistics - coefficient
Not requested.
15.1.2. National questionnaire – compliance with Eurostat model questionnaire
Methodological deviations from the CIS Harmonised Data Collection (HDC)
| Questions not included in national questionnaire compared to HDC | Comment |
| 2.2 / 2.3 / 2.4 / 2.6 / 2.7 / 2.8 / 2.10 / 2.11 | |
| 3.5 / 3.8 / 3.11 / 3.17 / 4.5 / 4.6 /4.7 / 4.8 / 4.9 |
15.1.3. National questionnaire – additional questions
Methodological deviations from the CIS Harmonised Data Collection (HDC)
| Additional questions in national questionnaire (not included in HDC) | Comment |
| No |
15.2. Comparability - over time
Due to important methodological changes driven by Oslo Manual 2018, only CIS 2018 and CIS 2020 can be directly compared with previous CIS waves.
15.2.1. Length of comparable time series
Not requested.
15.3. Coherence - cross domain
See the comparison between SBS and CIS data in the section 15.3.3 below.
15.3.1. Coherence - sub annual and annual statistics
Not requested.
15.3.2. Coherence - National Accounts
Not requested.
15.3.3. Coherence – Structural Business Statistics (SBS)
This part compares key variables for aggregated CIS data with SBS data
Definition of relative difference between CIS and SBS data: DIFF = (SBS/CIS)*100
Comparison between SBS and CIS data (relative difference) by NACE categories and for enterprises with 10 or more employees
| NACE | Size class | Number of enterprises (SBS/CIS)* | Number of employees (SBS/CIS)* | Total Turnover (SBS/CIS)* |
| Core NACE (B-C-D-E-46-H-J-K-71-72-73) | Total | 100 | 100 | 100 |
| Core industry (B_C_D_E - excluding construction) | Total | 100 | 100 | 100 |
| Core Services (46-H-J-K-71-72-73) | Total | 100 | 100 | 100 |
* Numbers are to be provided for the last year of the reference period (t)
NOTE: TurkStat have protocol with related institutions to set a frame for business registers. All surveys determine the target population / samples from the same database for the reference period. Therefore there is no difference from Structural Business Statistics.
15.4. Coherence - internal
Not requested.
Confidential information on the production cost of the CIS.
16.1. Cost
The assessment of costs associated with a statistical product is a rather complicated task since there must exist a mechanism for appointing portions of shared costs (for instance the business register or shared IT resources and dissemination channels) and overheads (office space, utility bills etc). The assessment must become detailed and clear enough so that international comparisons among agencies of different structures are feasible.
For measuring the cost on statistical offices, Eurostat proposes to make use of the following very short calculation, even if Eurostat is aware of the fact that such a measure may be complicated.
| Costs for the statistical authority | In thousands of national currency |
| Total cost (in thousand currency units) | 790,14 |
| Staff cost (in %) | 94.8 |
| Other direct cost (in %) | 5.2 |
| Overheads (in %) | - |
National currency used for this amount: TRY
NOTES:
- Total expenditures calculated for the staff working in the office and field work.
- Other current expenses are for the rental vehicle during fieldwork.
- General expenses could not be calculated.
17.1. Data revision - policy
Not requested.
17.2. Data revision - practice
Not requested.
17.2.1. Data revision - average size
Not requested.
18.1. Source data
See below:
18.1.1. Sampling frame (or census frame)
National business register is used for the sampling frame
18.1.2. Sampling design
A sample of 10,849 enterprises was drawn. Enterprises with 10 and more employed persons were fully enumerated, 48.2% of those with 10-49 employed persons, and 27.36% of enterprises with 50 to 249 employed persons etc. Stratification variables were NACE classes (30 strata), size class (3 strata). Altogether 90 strata were were filled with at least one enterprise.
18.1.3. Target population and sample size
| Sample/census indicator | Number of enterprises |
| Target population | 100544 |
| Sample | 10849 |
| In case of combination sample/census: | |
| Sampled units | 7880 |
| Enumerated units/census | 2969 |
| Overall sample rate (overall sample/target population) | 10.79% |
18.1.4. Data source for pre-filled variables
Variables and indicators filled or prefilled from other sources.
| Variables/Indicators | Source | Reference year |
| Turnover | TurkStat - Business Register System | 2020 |
| Average number of persons employed | TurkStat - Labour Input Indicators Group | 2020 |
18.1.5. Data source and variables used for derivation and weighting
| Item | Response |
| Data source used for deriving population totals | Business Register System |
| Variables used for weighting | Size class, sectoral breakdown offered in Oslo Manual |
18.2. Frequency of data collection
According to the Commission Regulation (UE) 995/2012, the innovation statistics shall be provided to Eurostat every two years in each even year t+18.
18.3. Data collection
Web based questionnaire is performed to respondents.
18.3.1. Survey participation
Mandatory
18.3.2. Survey type
Data are collected through combination of census (for 250+ size class) and sample survey. On-line survey is used.
18.3.3. Combination of sample survey and census data
Sampling method is used for the enterprises with 10-49 and 50-249 employees. Census is carried out for the enterprises with greater than 250 employees.
18.3.4. Census criteria
Census is carried out for the enterprises with greater than 250 employees.
18.3.5. Data collection method
Data collection method
| Survey method | Yes/No | Comment |
|---|---|---|
| Face-to-face interview | No | |
| Telephone interview | No | |
| Postal questionnaire | No | |
| Electronic questionnaire (format Word or PDF to send back by email) | No | |
| Web survey (online survey available on the platform via URL) | Yes | |
| Other | No |
18.4. Data validation
Not requested.
18.5. Data compilation
Operations performed on data to derive new information according to a given set of rules.
18.5.1. Imputation - rate
Imputation is the method of creating plausible (but artificial) substitute values for all those missing.
Definition of imputation rate:
Imputation rate (for the variable x) (%) = 100*(Number of replaced values) / (Total number of values for a given variable)
Definition of weighted imputation rate:
Weighted imputation rate= 100*(Number of total weighted replaced values) / (Total number of weighted values for a given variable)
18.5.1.1. Imputation rate for metric variables
Imputation rate for metric variables by NACE categories and for enterprises with 10 or more employees:
| NACE | Size class | Total Turnover (1) | Turnover from products new to the market (2) | R&D expenditure in-house (3) | |||
| Unweighted | Weighted | Unweighted | Weighted | Unweighted | Weighted | ||
| Core NACE (B-C-D-E-46-H-J-K-71-72-73) | Total | 0 | 0 | 0 | 0 | 0 | 0 |
| Core industry (B_C_D_E - excluding construction) | Total | 0 | 0 | 0 | 0 | 0 | 0 |
| Core Services (46-H-J-K-71-72-73) | Total | 0 | 0 | 0 | 0 | 0 | 0 |
There is no imputation in the survey.
(1) = Total turnover in the last year of the reference period (t) (TUR)
(2) = Share of the turnover in the last year of the reference period (t) due to new or improved product new to the market in the total turnover for product innovative enterprises TUR_PRD_NEW_MKT/TUR(INNO_PRD)
(3) = R&D expenditure performed in-house (EXP_INNO_RND_IH)
18.5.2. Weights calculation
Weights calculation method for sample surveys
| Method | Selected applied method | Comments |
| Inverse sampling fraction | ||
| Non-respondent adjustments | Yes | |
| Other |
Selection of sample unit: Sequential Simple Random Sampling is used in the strata by taking into account of the economic activities (in accordance with NACE Rev.2) and enterprise size according to the number of employees (10-49, 50-249 ve 250+).
Sample sizes and estimation methods: Innovation Survey is planned to give estimation according to size groups and economic activity groups for enterprises. According to estimation level stratification variables are given below :
Estimation Level for Size Groups:
- small enterprises: 10–49 employees;
- medium-sized enterprises: 50–249 employees;
- large enterprises: 250 or more employees
Estimation Level for Activity Groups can be observed from added file.
Weighting: At the first step, design weights are evaluated by the inverse of selection probabilities. Following the survey, non-response adjustment factors obtained and multiplied by the design weight to get final weights.
Annexes:
Estimation Level for Activity Groups
18.6. Adjustment
Not available
18.6.1. Seasonal adjustment
Not requested.
The Community Innovation Survey (CIS) is a survey about innovation activities in enterprises. The survey is designed to collect the information on types of innovation, processes of development of innovation like cooperation patterns, financing and expenditure, objectives of innovation activities or barriers for initiating or implementing innovation.
The CIS provides statistics by type of innovators, economic activity and size class of enterprises. The survey is currently carried out every two years across the EU Member States, EFTA countries and EU candidate countries.
In order to ensure comparability across countries, Eurostat together with the countries develops a Harmonised Data Collection (HDC) questionnaire and drafts the methodological recommendations for implementation of each survey round.
CIS 2020 is a second in a row to implement concepts and methodology of the Oslo Manual 4th Edition revised in 2018. The changes in the CIS driven by the revision of the manual and their impact on collected indicators are described in the Statistics Explained article: Community Innovation Survey – new features.
The legal framework for CIS since 2012 is the Commission Regulation No 995/2012 that establishes the quality conditions for the data collection and transmission and identifies the obligatory cross-coverage of economic sectors, size class of enterprises and innovation indicators. The target population are enterprises with at least 10 employees classified in the core NACE economic sectors (see 3.3). Further activities may be covered on a voluntary basis in national datasets. Most statistics are based on the 3-year reference period (t, t-1, t-2), but some use only one calendar year (t or t-2). Please refer to the Annex section of the European metadata (ESMS) for details of the time coverage of collected indicators.
30 May 2024
The description of concepts, definitions and main statistical variables is available in CIS 2020 European metadata file (ESMS) Results of the community innovation survey 2020 (CIS2020) (inn_cis12) in Eurostat database.
Enterprise
Core target population are all enterprises in CORE NACE activities (see 3.3.1) with 10 or more employees.
Geographical coverage regardless of their population size as with all provincial and district centres located in the Republic of Turkey's border villages have been covered.
There is no regional dimension available.
For CIS 2020, the time covered by the survey is the 3-year period from the beginning of 2018 to the end of 2020.
Some questions and indicators refer to one year — 2020.
The list of indicators covering the 3-year period and referring to one year according to the HDC is available in the Annex section of the European metadata (ESMS).
Accuracy in the statistical sense denotes the closeness of computations or estimates to the exact or true values. Statistics are not equal with the true values because of variability (the statistics change from implementation to implementation of the survey due to random effects) and bias (the average of the possible values of the statistics from implementation to implementation is not equal to the true value due to systematic effects).
CIS indicators are available according to 3 units of measure:
NR: Number for number of enterprises and number of persons employed.
THS_EUR: Thousands of euros. All financial variables are provided in thousands of euros, i.e. Turnover or Innovation expenditure.
PC: Percentage. The percentage is the ratio between the selected combinations of indicators.
Operations performed on data to derive new information according to a given set of rules.
See below:
CIS is conducted and disseminated at two-year interval in pair years.
The timeliness of statistics reflects the length of time between data availability and the event or phenomenon they describe.
The results are not published at regional level.
Due to important methodological changes driven by Oslo Manual 2018, only CIS 2018 and CIS 2020 can be directly compared with previous CIS waves.
