


1.1. Contact organisation
Statistics Finland
1.2. Contact organisation unit
Economic statistics
1.3. Contact name
Confidential because of GDPR
1.4. Contact person function
Confidential because of GDPR
1.5. Contact mail address
FI-00022 Statistics Finland
1.6. Contact email address
Confidential because of GDPR
1.7. Contact phone number
Confidential because of GDPR
1.8. Contact fax number
Confidential because of GDPR
2.1. Metadata last certified
21 October 2022
2.2. Metadata last posted
21 October 2022
2.3. Metadata last update
30 October 2022
3.1. Data description
The Community Innovation Survey (CIS) is a survey about innovation activities in enterprises. The survey is designed to collect the information on types of innovation, processes of development of innovation like cooperation patterns, financing and expenditure, objectives of innovation activities or barriers for initiating or implementing innovation.
The CIS provides statistics by type of innovators, economic activity and size class of enterprises. The survey is currently carried out every two years across the EU Member States, EFTA countries and EU candidate countries.
In order to ensure comparability across countries, Eurostat together with the countries develops a Harmonised Data Collection (HDC) questionnaire and drafts the methodological recommendations for implementation of each survey round.
CIS 2020 is a second in a row to implement concepts and methodology of the Oslo Manual 4th Edition revised in 2018. The changes in the CIS driven by the revision of the manual and their impact on collected indicators are described in the Statistics Explained article: Community Innovation Survey – new features.
The legal framework for CIS since 2012 is the Commission Regulation No 995/2012 that establishes the quality conditions for the data collection and transmission and identifies the obligatory cross-coverage of economic sectors, size class of enterprises and innovation indicators. The target population are enterprises with at least 10 employees classified in the core NACE economic sectors (see 3.3). Further activities may be covered on a voluntary basis in national datasets. Most statistics are based on the 3-year reference period (t, t-1, t-2), but some use only one calendar year (t or t-2). Please refer to the Annex section of the European metadata (ESMS) for details of the time coverage of collected indicators.
3.2. Classification system
Indicators related to the enterprises are classified by country, economic activity (NACE Rev. 2), size class of enterprises and type of innovation.
The main typology of classification of enterprises in reference to innovation is the distinction between innovation-active enterprises (INN) and not innovation-active enterprises (NINN).
The enterprise is considered as innovative (INN) if during the reference period it successfully introduced a a) product or a) business process innovation, c) completed but not yet implemented the innovation, d) had ongoing innovation activities, e) abandoned innovation activities or was f) engaged in in-house R&D or R&D contracted out. Non-innovative (NINN) enterprises had no innovation activity mentioned above whatsoever during the reference period.
3.3. Coverage - sector
CIS covers main economic sectors according to NACE Rev.2 broken down by size class of enterprises and type of innovation activity.
3.3.1. Main economic sectors covered - NACE Rev.2
In accordance with Commission Regulation 995/2012 on innovation statistics, the following industries and services are included in the core target population. Results are made available with these following breakdowns :
All NACE – Core NACE (NACE Rev. 2 sections & divisions B-C-D-E-46-H-J-K-71-72-73 )
CORE INDUSTRY (excluding construction) (NACE Rev. 2 SECTIONS B_C_D_E)
10-12: Manufacture of food products, beverages and tobacco
13-15: Manufacture of textiles, wearing apparel, leather and related products
16-18: Manufacture of wood, paper, printing and reproduction
20: Manufacture of chemicals and chemical products
21: Manufacture of basic pharmaceutical products and pharmaceutical preparations
19-22: Manufacture of petroleum, chemical, pharmaceutical, rubber and plastic products
23: Manufacture of other non-metallic mineral products
24: Manufacture of basic metals
25: Manufacture of fabricated metal products, except machinery and equipment
26: Manufacture of computer, electronic and optical products
25-30: Manufacture of fabricated metal products (except machinery and equipment), computer, electronic and optical products, electrical equipment, motor vehicles and other transport equipment
31-33: Manufacture of furniture; jewellery, musical instruments, toys; repair and installation of machinery and equipment
D: ELECTRICITY, GAS, STEAM AND AIR CONDITIONING SUPPLY
E: WATER SUPPLY; SEWERAGE, WASTE MANAGEMENT AND REMEDIATION ACTIVITIES
36: Water collection, treatment and supply
37-39: Sewerage, waste management, remediation activities
CORE SERVICES (NACE Rev. 2 sections & divisions 46-H-J-K-71-72-73)(NACE code in the tables = G46-M73_INN)
46: Wholesale trade, except of motor vehicles and motorcycles
H: TRANSPORTATION AND STORAGE
49-51: Land transport and transport via pipelines, water transport and air transport
52-53: Warehousing and support activities for transportation and postal and courier activities
J: INFORMATION AND COMMUNICATION
58: Publishing activities
61: Telecommunications
62: Computer programming, consultancy and related activities
63: Information service activities
K: FINANCIAL AND INSURANCE ACTIVITIES
64: Financial service activities, except insurance and pension funding
65: Insurance, reinsurance and pension funding, except compulsory social security
66: Activities auxiliary to financial services and insurance activities
M: PROFESSIONAL, SCIENTIFIC AND TECHNICAL ACTIVITIES
71: Architectural and engineering activities; technical testing and analysis
72: Scientific research and development
73: Advertising and market research
71-73: Architectural and engineering activities; technical testing and analysis; Scientific research and development; Advertising and market research
3.3.1.1. Main economic sectors covered - NACE Rev.2 - national particularities
No deviation.
3.3.2. Sector coverage - size class
In accordance with Commission Regulation 995/2012 on innovation statistics, the following size classes of enterprises according to number of employees are included in the core target population of the CIS:
- 10 - 49 employees
- 50 - 249 employees
- 250 or more employees
3.3.2.1. Sector coverage - size class - national particularities
No deviations.
3.4. Statistical concepts and definitions
The description of concepts, definitions and main statistical variables is available in CIS 2020 European metadata file (ESMS) Results of the community innovation survey 2020 (CIS2020) (inn_cis12) in Eurostat database.
3.5. Statistical unit
Enterprise, most often referring to legal unit, in some cases group or part of a group operating nationally
3.6. Statistical population
Core target population are all enterprises in CORE NACE activities (see 3.3.1) with 10 or more employees.
3.7. Reference area
National data for Finland. No NUTS 2 level data available.
3.8. Coverage - Time
Several rounds of Community Innovation Survey have been conducted so far at two-year interval since the end of 90’s.
3.8.1. Participation in the CIS waves
| CIS wave | Reference period | Participation | Comment (deviation from reference period) |
| CIS2 | 1994-1996 | Yes | |
| CIS3 | 1998-2000 | Yes | |
| CIS light | 2002-2003* | Yes | 2000-2002 |
| CIS4 | 2002-2004 | Yes | |
| CIS2006 | 2004-2006 | Yes | |
| CIS2008 | 2006-2008 | Yes | |
| CIS2010 | 2008-2010 | Yes | |
| CIS2012 | 2010-2012 | Yes | |
| CIS2014 | 2012-2014 | Yes | |
| CIS2016 | 2014-2016 | Yes | |
| CIS2018 | 2016-2018 | Yes | |
| CIS2020 | 2018-2020 | Yes |
*two reference periods can be distinguished for CIS light: 2000-2002 and 2001-2003
3.9. Base period
Not relevant.
CIS indicators are available according to 3 units of measure:
NR: Number of enterprises and number of persons employed.
THS_EUR: Thousands of euros. All financial variables are provided in thousands of euros, i.e. Turnover or Innovation expenditure.
PC: Percentage. The percentage is the ratio between the selected combinations of indicators.
For CIS 2020, the time covered by the survey is the 3-year period from the beginning of 2018 to the end of 2020.
Some questions and indicators refer to one year — 2020.
The list of indicators covering the 3-year period and referring to one year according to the HDC is available in the Annex section of the European metadata (ESMS).
6.1. Institutional Mandate - legal acts and other agreements
CIS surveys are based on the Commission Regulation No 995/2012, implementing Decision No 1608/2003/EC of the European Parliament and of the Council on the production and development of Community statistics on science and technology.
This Regulation establishes innovation statistics on a statutory basis and makes the delivery of certain variables compulsory e.g. innovation activities, cooperation, development, expenditures and turnover (see the Regulation). Each survey wave may additionally include further variables.
In addition, the Regulation defines the obligatory cross-coverage of economic sectors and size class of enterprises.
6.1.1. National legislation
Statistics Act (280/2004), https://www.finlex.fi/fi/laki/ajantasa/2004/20040280 (Finnish/Swedish), http://tilastokeskus.fi/meta/lait/statistics-act-2802004_en.html (English)
6.2. Institutional Mandate - data sharing
Not requested.
CIS data are transmitted to Eurostat via EDAMIS using the secured transmission system.
7.1. Confidentiality - policy
The data protection of data collected for statistical purposes is guaranteed in accordance with the requirements of the Statistics Act (280/2004), the Act on the Openness of Government Activities (621/1999), the EU's General Data Protection Regulation (EU) 2016/679 and the Data Protection Act (1050/2018). The data materials are protected at all stages of processing with the necessary physical and technical solutions. Statistics Finland has compiled detailed directions and instructions for confidential processing of the data. Employees have access only to the data essential for their duties. The premises where unit-level data are processed are not accessible to outsiders. Members of the personnel have signed a pledge of secrecy upon entering the service. Violation of data protection is punishable.
7.2. Confidentiality - data treatment
Statistics Finland's official guidelines on the protection of tabulated business data are applied in protecting innovation survey data. As in sample surveys, the basis for publishing the data is to not publish data on the statistical units belonging to the sample. In terms of protection, compliance with the threshold rule (3) is the primary procedure. In addition, the dominance rule is applied to data in euros.
Industry-specific data are mainly published on the 2-digit level. However, some of the most sensitive industries from the point of data protection have been combined with other industries. If there is need for protection after possible aggregations, or for some other reason, the cells to be protected are hidden.
In the tabulations submitted to Eurostat, sensitive cells are indicated as protected (also secondary protection), in which case Eurostat does not publish these data. However, the data can be used in calculating sum data at the EU level. Protection is indicated in accordance with instructions given by Eurostat.
The innovation data - without identification data - are also submitted to Eurostat's SafeCenter for research use.
8.1. Release calendar
Statistics Finland publishes new statistical data at 8 am on weekdays in its web service. The release times of statistics are given in advance in the release calendar available in the web service. The data are public after they have been updated in the web service.
The statistics on innovation activity are nationally published in the spring around 16 months from the end of the statistical reference year. The release date is announced in Statistics Finland's release calendar. All statistical data can be found on the home page of the statistics https://stat.fi/en/statistics/inn
8.2. Release calendar access
https://stat.fi/en/future-releases
8.3. Release policy - user access
The data of the statistics on innovation activity are released to all data users simultaneously according to the date given in Statistics Finland's release calendar. All statistical data are available free-of-charge on the home page of the statistics https://stat.fi/en/statistics/inn
Statistical data are published as database tables in the StatFin database. The database is the primary publishing site of data, and new data are updated first there.
Assignments can be commissioned from the statistical data, that is, small free-of-charge or extensive charged reports can be ordered, for example from tiede.teknologia@stat.fi. Further information about the charges payable for Statistics Finland's services is available at https://www.stat.fi/tup/hinnat/index_en.html
CIS is conducted and disseminated at two-year interval in pair years.
Accessibility and clarity refer to the simplicity and ease for users to access statistics using simple and user-friendly procedure, obtaining them in an expected form and within an acceptable time period, with the appropriate user information and assistance: a global context which finally enables them to make optimum use of the statistics.
10.1. Dissemination format - News release
See below.
10.1.1. Availability of the releases
| Dissemination and access | Availability | Comments, links, ... |
| Press release | x | Published 28 April 2022, https://stat.fi/en/statistics/inn |
| Access to public free of charge | x | |
| Access to public restricted (membership/password/part of data provided, etc) |
10.2. Dissemination format - Publications
- Online database (containing all/most results) : Yes
https://pxweb2.stat.fi/PXWeb/pxweb/en/StatFin/StatFin__inn/?tablelist=true
- Analytical publication (referring to all/most results) : Yes
- Analytical publication (referring to specific results, e.g. only for one sector or one specific aspect) : No
10.3. Dissemination format - online database
Available https://pxweb2.stat.fi/PXWeb/pxweb/en/StatFin/StatFin__inn/?tablelist=true
10.3.1. Data tables - consultations
Not requested.
10.4. Dissemination format - microdata access
Innovation microdata are available both in Eurostat SAFE centre and in Statistics Finland's Research Services.
10.4.1. Dissemination of microdata
| Mean of dissemination | Availability of microdata | Comments, links, ... |
| Eurostat SAFE centre | Yes | id of company and other identificators are removed |
| National SAFE centre | Yes | id of company and other identificators are removed |
| Eurostat: partially anonymised data (SUF) | No | |
| National : partially anonymised data | No |
10.5. Dissemination format - other
No other dissemination formats.
10.5.1. Metadata - consultations
Not requested.
10.6. Documentation on methodology
The implementation of the innovation survey follows the methodological recommendations issued by Eurostat, the Statistical Office of the European Communities.
The concepts are based, inter alia, on the OECD/Eurostat Oslo Manual.
10.6.1. Metadata completeness - rate
Not requested.
10.7. Quality management - documentation
Statistic's webpage covers the national documentation for quality management (largely with similar items than those in Eurostat quality reporting).
11.1. Quality assurance
The quality management framework of the field of statistics is the European Statistics Code of Practice (CoP). The quality criteria of Official Statistics of Finland are also compatible with the European Statistics Code of Practice.
Quality issues are critical and controlled at every stage of stastistical production process of innovation data -- in data collection, in data editing and in validating the final data.
In the data collection of innovation data, the target is to attain an adequate and sufficient response rate (target 70 per cent) for the data to be representative enough. All the illogicalities, shortcomings, faults, missing values and other types of errors are identified and tried to be corrected. Data are corrected by various means, and the final data validated in multiple ways, such as
- identifying deficiencies and internal illogicalities in the data as well as other possible errors (checking of observation units, errors regarding thousands in the euro data and so on) and by correcting and supplementing them and
- by examining distributions of variables and comparing data and distributions with previous data and with existing comparison data (research and development activity and other business data).
11.2. Quality management - assessment
Following Eurostat's methodological recommendations and using multiple ways of controlling the quality at every stage of the statistical process quarantee reliable and as unbiased and correct data as possible for enterprises innovation activity.
CIS data covers however difficult items, such as innovation expenditure, which are very challenging for respondents to be provided. It is important to take this into account when using the data in order to avoid misinterpretation of the data.
Relevance is the degree to which statistics meet current and potential users needs. It includes the production of all needed statistics and the extent to which concepts used (definitions, classifications etc.) reflect user needs. The aim is to describe the extent to which the statistics are useful to, and used by, the broadest array of users. For this purpose, statisticians need to compile information, firstly about their users and their needs.
The CIS is based on a common questionnaire and a common survey methodology, as laid down in the 4th edition of Oslo Manual (2018 edition), in order to achieve comparable, harmonised and high quality results for EU Member States, EFTA countries, Candidates and Associated countries.
12.1. Relevance - User Needs
Key users of innovation data and innovation statistics are invited to discuss about and to comment (meetings or other contacts) the content of the forthcoming survey, i.e. the EU CIS harmonised data collection HDC, and about current information (user) needs before each survey round. It is also assessed whether there are themes and subjects, or topics, in addition to the harmonised data content, that should be covered in the national survey. This is a key tool for monitoring users' information needs and user satisfaction regarding innovation data.
12.1.1. Needs at national level
| User group | Short description of user group | Main needs for CIS data of the user group Users’ needs |
| 1 Institutions - European level | Commission/DG ENTR | Scoreboards, analysis |
| 1 Institutions - European level | Commission/Eurostat | European statistics |
| 1 Institutions - European level | Commission/other possible DGs interested in innovation data | Analysis |
| 1 Institutions - International organisations | OECD | International statistics, analysis and comparisons, publications |
| 1 Institutions - National level | Ministry of Employment and the Economy and other ministries involved in innovation policy | Follow up of development, analysis of innovation environments and ecosystems and other analysis covering innovation |
| 1 Institutions - National level | Innovation supporting organisations such as Business Finland (innovation funding and other promotion of innovation) | Follow up of development, analysis of innovation environments and ecosystems and other analysis covering innovation |
| 2 Social actors | Employers association, trade unions | Follow up of development, analysis and studies covering innovation |
| 3 Media | Mainly national media, TV, newspapers, magazines | News and articles relating to business and economy |
| 4 Researchers and students | Research institutes and researchers in Finland | Research and analysis, use of microdata, economic forecasts/prognoses |
| 4 Researchers and students | Research institutes and researchers in other countries | Research and analysis, use of microdata |
| 4 Researchers and students | Students in Finland and abroad | Exercises, thesis, other material for studies |
| 5 Enterprises or businesses | Enterprises mainly in Finland | Benchmarking based on statistics |
12.2. Relevance - User Satisfaction
Actual and separate user satisfaction surveys have not been implemented for CIS. User satisfaction is tried to be quaranteed by discussing about the content of statistics with users already before every survey round (meetings with users and possibility to comment the content of survey described under 12.1).
Also, if other feedback received, it is taken into account when surveys and publishing planned.
12.3. Completeness
All the mandatory data according to the EU legislation, and large set of voluntary data, are published and also provided to Eurostat. The data are available by industry and size category according to the EU recommendations. Industry data are presented mainly on the 2-digit level with the exception of industries that for data protection reasons have to be described as aggregated.
12.3.1. Data completeness - rate
Not requested.
13.1. Accuracy - overall
Accuracy in the statistical sense denotes the closeness of computations or estimates to the exact or true values. Statistics are not equal with the true values because of variability (the statistics change from implementation to implementation of the survey due to random effects) and bias (the average of the possible values of the statistics from implementation to implementation is not equal to the true value due to systematic effects).
13.2. Sampling error
That part of the difference between a population value and an estimate thereof, derived from a random sample, which is due to the fact that only a subset of the population is enumerated.
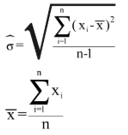
13.2.1. Sampling error - indicators
The main indicator used to measure sampling errors for CIS data is the coefficient of variation (CV).
Coefficient of Variation= (Square root of the estimate of the sampling variance) / (Estimated value)
Formula:
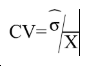
where
13.2.1.1. Coefficient of variations for key variables
Coefficient of variation (%) for key variables by NACE categories and for enterprises with 10 and more employees
| NACE |
Size class |
(1) |
(2) |
(3) |
| Core NACE (B-C-D-E-46-H-J-K-71-72-73) |
Total |
1.3 |
2.6 |
2.6 |
| Core industry (B_C_D_E - excluding construction) |
Total |
1.7 |
2.2 |
3.1 |
| Core Services (46-H-J-K-71-72-73) |
Total |
1.9 |
7.2 |
4.2 |
[1] = Coefficient of variation for the percentage of innovative enterprises (INN) in the total population of enterprises (ENT20)
[2] = Coefficient of variation for the turnover of product innovative enterprises with new or improved products (TUR_PRD_NEW_MKT), as a percentage of total turnover of product innovative enterprises [TUR20,INNO_PRD].
[3] = Coefficient of variation for percentage of product and/or process innovative enterprises (incl. enterprises with abandoned and or on-going activities) involved in any innovation co-operation arrangement [COOP_ALL,INN], as a percentage of innovative enterprises (INN).
13.2.1.2. Variance estimation method
ETOS and SAS procedures
13.3. Non-sampling error
Non-sampling errors occur in all phases of a survey. They add to the sampling errors (if present) and contribute to decreasing overall accuracy. It is important to assess their relative weight in the total error and devote appropriate resources for their control and assessment.
13.3.1. Coverage error
Coverage errors (or frame errors) are due to divergences between the target population and the frame population. The frame population is the set of target population members that has a chance to be selected into the survey sample. It is a listing of all items in the population from which the sample is drawn that contains contact details as well as sufficient information to perform stratification and sampling.
13.3.1.1. Over-coverage - rate
Not requested.
13.3.1.2. Common units - proportion
Not requested.
13.3.1.3. Under covered groups of the target population
No under-coverage due to the use of national business register as a frame.
13.3.1.4. Coverage errors in coefficient variation
Over coverage units are eliminated from the estimation and the calculation of coefficient of variation.
13.3.2. Measurement error
Measurement errors occur during data collection and generate bias by recording values different than the true ones. The survey questionnaire used for data collection may have led to the recording of wrong values, or there may be respondent or interviewer bias.
13.3.2.1. Measures for reducing measurement errors
Training of personnel working with data collection and data editing, studying the concepts and the content of the survey resulting in ability to help respondents when difficulties with responding.
The online questionnaire may consist some checks for invalid or inconsistent values, and the questionnaire follows model questionnaire's ordering and filtering.
Data editing phase covers many kinds of checks and controlling (internal, compared to previous surveys, compared to other business data).
13.3.3. Non response error
Non response occurs when a survey fails to collect data on all survey variables from all the population units designated for data collection in a sample or complete enumeration.
There are two types of non-response:
1) Unit non-response, which occurs when no data (or so little as to be unusable) are collected about a population unit designated for data collection.
a) Un-weighted unit non-response rate (%) = 100*(Number of units with no response or not usable response) / (Total number of in-scope (eligible) units in the sample)
b) Weighted unit non-response rate (%) = 100*(Number of weighted units with no response or not usable response) / (Total number of in-scope (eligible) units in the sample)
2) Item non-response, which occurs when only data on some, but not all survey data items are collected about a population unit designated for data collection.
a) Un-weighted item non-response rate (%) = 100*(Number of units with no response at all for the item) / (Total number of eligible, for the item, units in the sample i.e. filters have to be taken into account)
See 13.3.3.1. and 13.3.3.2.
13.3.3.1. Unit non-response - rate
See below.
13.3.3.1.1. Un-weighted and weighted unit non-response rate by NACE categories and for enterprises with 10 or more employed persons
Un-weighted and weighted unit non-response rate by NACE categories and for enterprises with 10 or more employees
| NACE | Number of eligible units with no response | Total number of eligible units in the sample | Un-weighted unit non-response rate (%) | Weighted unit non-response rate (%) |
| Core NACE (B-C-D-E-46-H-J-K-71-72-73) | 1261 | 3706 | 34.0 | |
| Core industry (B_C_D_E - excluding construction) | 545 | 1704 | 32.0 | |
| Core Services (46-H-J-K-71-72-73) | 716 | 2002 | 35.8 |
The number of eligible units is the number of sample units, which indeed belong to the target population.
13.3.3.1.2. Maximum number of recalls/reminders before coding
Four reminder letters and two email reminders.
13.3.3.2. Item non-response - rate
See below.
13.3.3.2.1. Item non-response rate for Turnover (in Core NACE: B-C-D-E-46-H-J-K-71-72-73 enterprises with 10 or more employed persons)
Item non-response rate for Turnover (in Core NACE: B-C-D-E-46-H-J-K-71-72-73 enterprises with 10 or more employees).
| Item non-response rate (un-weighted) | Imputation | If imputed, describe method used, mentioning which auxiliary information or stratification is used | |
| Turnover | - |
Information on turnover is missing only for marginal number of respondents. If missing, the SBS data is used.
13.3.3.2.2. Item non response rate for new questions
Item non-response rate for new questions in CIS t (in Core NACE: B-C-D-E-46-H-J-K-71-72-73 enterprises with 10 or more employees)
| NEW QUESTIONS IN CIS 2020 | Inclusion in national questionnaire | Item non response rate (un-weighted) | Comments |
| 2.2 Market conditions faced by enterprise | No | - | |
| 2.8 Factors related to climate change | Yes | 3.7 | |
| 3.16 Innovations with environmental benefits | Yes | 5.7 | |
| 3.17 Factors driving environmental innovations | Only for those with innovations with significant environmental benefits | - |
13.3.4. Processing error
By multiple ways of controlling, editing and analysing the data it is targeted to the finalised data that does not cover any processing errors.
13.3.5. Model assumption error
Not requested.
Timeliness and punctuality refer to time and dates, but in a different manner.
14.1. Timeliness
The timeliness of statistics reflects the length of time between data availability and the event or phenomenon they describe.
14.1.1. Time lag - first result
Timeliness of national data – date of first release of national level : 28/04/2022
14.1.2. Time lag - final result
Not requested.
14.2. Punctuality
Punctuality refers to the time lag between the release date of data and the target date on which they were scheduled for release as announced officially.
14.2.1. Punctuality - delivery and publication
Date of transmission of complete and validated data to Eurostat (Number of days between that data and 30 June 2022) : -8
Comparability aims at measuring the impact of differences in applied statistical concepts and definitions on the comparison of statistics between geographical areas, non-geographical domains, or over time.
The coherence of statistical outputs refers to the degree to which the statistical processes by which they were generated used the same concepts (classifications, definitions, and target populations) and harmonised methods. Coherent statistical outputs have the potential to be validly combined and used jointly.
15.1. Comparability - geographical
No deviations from ESS/international standards, concepts and definitions (OM4 and Eurostat guidelines).
15.1.1. Asymmetry for mirror flow statistics - coefficient
Not requested.
15.1.2. National questionnaire – compliance with Eurostat model questionnaire
Methodological deviations from the CIS Harmonised Data Collection (HDC)
| Questions not included in national questionnaire compared to HDC | Comment |
| 2.1 Importance of strategies | |
| 2.2 Market conditions | |
| 2.3 Products meeting user requirements | |
| 2.7 Purchasing machinery, equipment and software | |
| 3.9 Funding | |
| 3.11 Tax incentives or allowances | |
| 3.15 Hampering factors | |
| 3.17 Factors driving to introduce environmental innovations | Asked for environmental innovations with significant benefits only |
| 4.2 Person employed with tertiary degree | |
| 4.5 Age of enterprise | |
| 4.6 Spending | |
| 4.8 Inflows and outflows between enterprises in the group | |
| 4.9 Intra-group loans |
| Changes in the filtering compared to HDC | Comment |
| - | |
| - |
15.1.3. National questionnaire – additional questions
Methodological deviations from the CIS Harmonised Data Collection (HDC)
| Additional questions in national questionnaire (not included in HDC) | Comment |
| Collaboration and connections between enterprises and research organisations (universities, universities of applied sciences, research institutes) covering three questions |
|
| Skills and competence areas required by enterprises (importance of different kinds of competence areas and sufficiency of needed competence) |
|
| Covid 19 - impacts of the corona pandemic on enterprises business activity (measures due to the corona pandemic and how the pandemic influenced on enterprises innovation activity) |
15.2. Comparability - over time
Due to important methodological changes driven by Oslo Manual 2018, CIS 2018 and CIS 2020 cannot be directly compared with previous CIS waves.
15.2.1. Length of comparable time series
Not requested.
15.3. Coherence - cross domain
See the comparison between SBS and CIS data in the section 15.3.3 below.
15.3.1. Coherence - sub annual and annual statistics
Not requested.
15.3.2. Coherence - National Accounts
Not requested.
15.3.3. Coherence – Structural Business Statistics (SBS)
This part compares key variables for aggregated CIS data with SBS data
Definition of relative difference between CIS and SBS data: DIFF = (SBS/CIS)*100
Comparison between SBS and CIS data (relative difference) by NACE categories and for enterprises with 10 or more employees
| NACE | Size class | Number of enterprises (SBS/CIS)* | Number of employees (SBS/CIS)* | Total Turnover (SBS/CIS)* |
| Core NACE (B-C-D-E-46-H-J-K-71-72-73) | Total | 105.0 | 93.1 | 99.9 |
| Core industry (B_C_D_E - excluding construction) | Total | 103.9 | 93.4 | 99.6 |
| Core Services (46-H-J-K-71-72-73) | Total | 105.9 | 92.9 | 100.4 |
* Numbers are to be provided for the last year of the reference period (t)
Data not fully comparable due to minor differences in statistical units (legal units/enterprise units/groups). Data without NACE K.
15.4. Coherence - internal
Not requested.
Confidential information on the production cost of the CIS.
16.1. Cost
The assessment of costs associated with a statistical product is a rather complicated task since there must exist a mechanism for appointing portions of shared costs (for instance the business register or shared IT resources and dissemination channels) and overheads (office space, utility bills etc). The assessment must become detailed and clear enough so that international comparisons among agencies of different structures are feasible.
For measuring the cost on statistical offices, Eurostat proposes to make use of the following very short calculation, even if Eurostat is aware of the fact that such a measure may be complicated.
| Costs for the statistical authority | In thousands of national currency |
| Total cost (in thousand currency units) | Not available |
| Staff cost (in %) | Not available |
| Other direct cost (in %) | Not available |
| Overheads (in %) | Not available |
National currency used for this amount:
17.1. Data revision - policy
Not requested.
17.2. Data revision - practice
Not requested.
17.2.1. Data revision - average size
Not requested.
18.1. Source data
See below:
18.1.1. Sampling frame (or census frame)
National business register (BR)
18.1.2. Sampling design
Census for enterprises with 250 employees or more, and simple random sampling for enteprises with 10 to 249 employees. NACE and size class as stratifiying variables.
Total frame of CIS2020 covering 9035 enteprises and overall sampling rate 41 per cent -- 33 per cent for enterprises with 10 to 49 employees and 58 per cent for medium size enterprises (census for large enterprises).
18.1.3. Target population and sample size
| Sample/census indicator | Number of enterprises |
| Target population | 9035 |
| Sample | 3706 |
| In case of combination sample/census: | |
| Sampled units | 3324 |
| Enumerated units/census | 381 |
| Overall sample rate (overall sample/target population) | 41.0 |
18.1.4. Data source for pre-filled variables
Variables and indicators filled or prefilled from other sources.
| Variables/Indicators | Source | Reference year |
| None | ||
18.1.5. Data source and variables used for derivation and weighting
| Item | Response |
| Data source used for deriving population totals | |
| Variables used for weighting | number of enterprises, turnover |
18.2. Frequency of data collection
According to the Commission Regulation (UE) 995/2012, the innovation statistics shall be provided to Eurostat every two years in each even year t+18.
18.3. Data collection
See below.
18.3.1. Survey participation
Mandatory
18.3.2. Survey type
Combination of census and sample survey.
18.3.3. Combination of sample survey and census data
Sample survey for enterprises with 10 to 249 employees and census for 250+ employees.
18.3.4. Census criteria
250 employees
18.3.5. Data collection method
Data collection method
| Survey method | Yes/No | Comment |
|---|---|---|
| Face-to-face interview | No | |
| Telephone interview | No | |
| Postal questionnaire | No | It is however possible to print out the questionnaire from Statistics Finland's web page and send paper response by mail |
| Electronic questionnaire (format Word or PDF to send back by email) | No | |
| Web survey (online survey available on the platform via URL) | Yes | |
| Other | No |
18.4. Data validation
Not requested.
18.5. Data compilation
Operations performed on data to derive new information according to a given set of rules.
18.5.1. Imputation - rate
Imputation is the method of creating plausible (but artificial) substitute values for all those missing.
Definition of imputation rate:
Imputation rate (for the variable x) (%) = 100*(Number of replaced values) / (Total number of values for a given variable)
Definition of weighted imputation rate:
Weighted imputation rate= 100*(Number of total weighted replaced values) / (Total number of weighted values for a given variable)
18.5.1.1. Imputation rate for metric variables
Imputation rate for metric variables by NACE categories and for enterprises with 10 or more employees:
| NACE | Size class | Total Turnover (1) | Turnover from products new to the market (2) | R&D expenditure in-house (3) | |||
| Unweighted | Weighted | Unweighted | Weighted | Unweighted | Weighted | ||
| Core NACE (B-C-D-E-46-H-J-K-71-72-73) | Total | - | - | 3.5 | 3.6 | ||
| Core industry (B_C_D_E - excluding construction) | Total | - | - | 3.1 | 2.9 | ||
| Core Services (46-H-J-K-71-72-73) | Total | - | - | 4.0 | 4.5 | ||
(1) = Total turnover in the last year of the reference period (t) (TUR)
(2) = Share of the turnover in the last year of the reference period (t) due to new or improved product new to the market in the total turnover for product innovative enterprises TUR_PRD_NEW_MKT/TUR(INNO_PRD)
(3) = R&D expenditure performed in-house (EXP_INNO_RND_IH)
Total turnover: missing information replaced by the data from SBS.
18.5.2. Weights calculation
Weights calculation method for sample surveys
| Method | Selected applied method | Comments |
| Inverse sampling fraction | Yes | |
| Non-respondent adjustments | Yes | |
| Other |
18.6. Adjustment
None
18.6.1. Seasonal adjustment
Not requested.
The Community Innovation Survey (CIS) is a survey about innovation activities in enterprises. The survey is designed to collect the information on types of innovation, processes of development of innovation like cooperation patterns, financing and expenditure, objectives of innovation activities or barriers for initiating or implementing innovation.
The CIS provides statistics by type of innovators, economic activity and size class of enterprises. The survey is currently carried out every two years across the EU Member States, EFTA countries and EU candidate countries.
In order to ensure comparability across countries, Eurostat together with the countries develops a Harmonised Data Collection (HDC) questionnaire and drafts the methodological recommendations for implementation of each survey round.
CIS 2020 is a second in a row to implement concepts and methodology of the Oslo Manual 4th Edition revised in 2018. The changes in the CIS driven by the revision of the manual and their impact on collected indicators are described in the Statistics Explained article: Community Innovation Survey – new features.
The legal framework for CIS since 2012 is the Commission Regulation No 995/2012 that establishes the quality conditions for the data collection and transmission and identifies the obligatory cross-coverage of economic sectors, size class of enterprises and innovation indicators. The target population are enterprises with at least 10 employees classified in the core NACE economic sectors (see 3.3). Further activities may be covered on a voluntary basis in national datasets. Most statistics are based on the 3-year reference period (t, t-1, t-2), but some use only one calendar year (t or t-2). Please refer to the Annex section of the European metadata (ESMS) for details of the time coverage of collected indicators.
30 October 2022
The description of concepts, definitions and main statistical variables is available in CIS 2020 European metadata file (ESMS) Results of the community innovation survey 2020 (CIS2020) (inn_cis12) in Eurostat database.
Enterprise, most often referring to legal unit, in some cases group or part of a group operating nationally
Core target population are all enterprises in CORE NACE activities (see 3.3.1) with 10 or more employees.
National data for Finland. No NUTS 2 level data available.
For CIS 2020, the time covered by the survey is the 3-year period from the beginning of 2018 to the end of 2020.
Some questions and indicators refer to one year — 2020.
The list of indicators covering the 3-year period and referring to one year according to the HDC is available in the Annex section of the European metadata (ESMS).
Accuracy in the statistical sense denotes the closeness of computations or estimates to the exact or true values. Statistics are not equal with the true values because of variability (the statistics change from implementation to implementation of the survey due to random effects) and bias (the average of the possible values of the statistics from implementation to implementation is not equal to the true value due to systematic effects).
CIS indicators are available according to 3 units of measure:
NR: Number of enterprises and number of persons employed.
THS_EUR: Thousands of euros. All financial variables are provided in thousands of euros, i.e. Turnover or Innovation expenditure.
PC: Percentage. The percentage is the ratio between the selected combinations of indicators.
Operations performed on data to derive new information according to a given set of rules.
See below:
CIS is conducted and disseminated at two-year interval in pair years.
The timeliness of statistics reflects the length of time between data availability and the event or phenomenon they describe.
No deviations from ESS/international standards, concepts and definitions (OM4 and Eurostat guidelines).
Due to important methodological changes driven by Oslo Manual 2018, CIS 2018 and CIS 2020 cannot be directly compared with previous CIS waves.
