


1.1. Contact organisation
CZECH STATISTICAL OFFICE
1.2. Contact organisation unit
Research, Development and Information Society Statistics Unit
1.3. Contact name
Restricted from publication1.4. Contact person function
Restricted from publication1.5. Contact mail address
Czech Statistical Office
Society Development Statistics Department
Na padesatem 81
Praha 10
100 82
1.6. Contact email address
Restricted from publication1.7. Contact phone number
Restricted from publication1.8. Contact fax number
Restricted from publication2.1. Metadata last certified
8 February 20212.2. Metadata last posted
8 February 20212.3. Metadata last update
8 February 20213.1. Data description
The Community Innovation Survey (CIS) is a survey about innovation activities in enterprises. The survey is designed to collect the information on different types of innovation, various aspects of the development of an innovation, objectives of innovation activities, sources of information, public funding or expenditure on innovation. It is aim is to measure the innovativeness of sectors and enable the analysis of the factors of innovation.
The CIS provides statistics by type of innovators, economic activities and size class of enterprises. The survey is currently carried out every two years across the EU Member States, EFTA countries and EU candidate countries.
In order to ensure comparability across countries, Eurostat together with the countries developed a Harmonised Data Collection (HDC) questionnaire accompanied by a set of definitions and methodological recommendations.
CIS 2018 concepts and its underlying methodology are based on the Oslo Manual (2018) 4th Edition.
New review of the CIS2018 aims to meet several objectives :
1: Reduce subjectivity and biases in the main CIS indicators
2: Improve reporting about innovation activities and capabilities in the firm
3: Ensure international comparability (including compliance with the OM4)
4: Broaden the basis CIS information on enterprise management
5: Take better account the diversity of enterprises in the EU
6: Improve reporting about external drivers and enablers of innovation
7: Improve timeliness
8: Ensure the feasibility of data collection
9: Ensure continuity with the CIS 2016
10: Improve reporting about the output and impact of innovation
CIS2018 is conducted under Commission Regulation No 995/2012. This Regulation defines the mandatory target population of the survey referring to enterprises in the Core NACE economic sectors (see section 3.3.) with at least 10 employees. Further activities may be covered on a voluntary basis in national datasets. Most statistics are based on the 3-year reference period (t, t-1, t-2), but some use only one calendar year (t or t-2).
Please consider CIS t to be the survey that refers to the same year of the quality report and CIS t-2 to be the previous survey e.g.: CIS 2018= CIS t then, CIS t-2=CIS 2016
3.2. Classification system
Indicators related to the enterprises are classified by country, economic activity (NACE Rev. 2), size class of enterprises and type of innovation.
The main typology of classification of enterprises in reference to innovation is the distinction between innovation-active enterprises (INN) and not innovation-active enterprises (NINN).
The enterprise is considered as innovative (INN) if during the reference period it successfully introduced a product or business process innovation, had ongoing innovation activities, abandoned innovation activities or was engaged in in-house R&D or R&D contracted out. Non-innovative (NINN) enterprises had no innovation activity mentioned above whatsoever during the reference period.
3.3. Coverage - sector
CIS covers main economic sectors according to NACE Rev.2 broken down by size class of enterprises and type of innovation activity.
3.3.1. Main economic sectors covered - NACE Rev.2
In accordance with Commission Regulation 995/2012 on innovation statistics, the following industries and services are included in the core target population. Results are made available with these following breakdowns :
All NACE – Core NACE (NACE Rev. 2 sections & divisions B-C-D-E-46-H-J-K-71-72-73 )
CORE INDUSTRY (excluding construction) (NACE Rev. 2 SECTIONS B_C_D_E)
10-12: Manufacture of food products, beverages and tobacco
13-15: Manufacture of textiles, wearing apparel, leather and related products
16-18: Manufacture of wood, paper, printing and reproduction
20: Manufacture of chemicals and chemical products
21: Manufacture of basic pharmaceutical products and pharmaceutical preparations
19-22: Manufacture of petroleum, chemical, pharmaceutical, rubber and plastic products
23: Manufacture of other non-metallic mineral products
24: Manufacture of basic metals
25: Manufacture of fabricated metal products, except machinery and equipment
26: Manufacture of computer, electronic and optical products
25-30: Manufacture of fabricated metal products (except machinery and equipment), computer, electronic and optical products, electrical equipment, motor vehicles and other transport equipment
31-33: Manufacture of furniture; jewellery, musical instruments, toys; repair and installation of machinery and equipment
D: ELECTRICITY, GAS, STEAM AND AIR CONDITIONING SUPPLY
E: WATER SUPPLY; SEWERAGE, WASTE MANAGEMENT AND REMEDIATION ACTIVITIES
36: Water collection, treatment and supply
37-39: Sewerage, waste management, remediation activities
CORE SERVICES (NACE Rev. 2 sections & divisions 46-H-J-K-71-72-73)(NACE code in the tables = G46-M73_INN)
46: Wholesale trade, except of motor vehicles and motorcycles
H: TRANSPORTATION AND STORAGE
49-51: Land transport and transport via pipelines, water transport and air transport
52-53: Warehousing and support activities for transportation and postal and courier activities
J: INFORMATION AND COMMUNICATION
58: Publishing activities
61: Telecommunications
62: Computer programming, consultancy and related activities
63: Information service activities
K: FINANCIAL AND INSURANCE ACTIVITIES
64: Financial service activities, except insurance and pension funding
65: Insurance, reinsurance and pension funding, except compulsory social security
66: Activities auxiliary to financial services and insurance activities
M: PROFESSIONAL, SCIENTIFIC AND TECHNICAL ACTIVITIES
71: Architectural and engineering activities; technical testing and analysis
72: Scientific research and development
73: Advertising and market research
71-73: Architectural and engineering activities; technical testing and analysis; Scientific research and development; Advertising and market research
3.3.1.1. Main economic sectors covered - NACE Rev.2 - national particularities
No national particularities.
3.3.2. Sector coverage - size class
In accordance with Commission Regulation 995/2012 on innovation statistics, the following size classes of enterprises according to number of employees are included in the core target population of the CIS:
- 10 - 49 employees
- 50 - 249 employees
- 250 or more employees
3.3.2.1. Sector coverage - size class - national particularities
Person employed used instead of employee as classification unit for size class of enterprises.
3.4. Statistical concepts and definitions
The description of concepts, definitions and main statistical variables is available in CIS 2018 European metadata file (ESMS) Results of the community innovation survey 2018 (CIS2018) (inn_cis11) in Eurostat database.
3.5. Statistical unit
The statistical unit is an enterprise which corresponds to the legal unit with the identification number given by the Business Register.
3.6. Statistical population
Core target population are all enterprises in CORE NACE activities (see 3.3.1) with 10 or more employed persons.
3.7. Reference area
The geographic area to which the measured statistical phenomenon relates is Czechia (NUTS1) for all variables (data) and NUTS2 for selected (main) variables (data).
3.8. Coverage - Time
Several rounds of Community Innovation Survey have been conducted so far at two-year interval since end of 90’s.
3.8.1. Participation in the CIS waves
| CIS wave | Reference period | Participation | Comment (deviation from reference period) |
| CIS2 | 1994-1996 | No | |
| CIS3 | 1998-2000 | Yes | 1999-2001 |
| CIS light | 2002-2003* | Yes | |
| CIS4 | 2002-2004 | Yes | 2003-2005 |
| CIS2006 | 2004-2006 | Yes | |
| CIS2008 | 2006-2008 | Yes | |
| CIS2010 | 2008-2010 | Yes | |
| CIS2012 | 2010-2012 | Yes | |
| CIS2014 | 2012-2014 | Yes | |
| CIS2016 | 2014-2016 | Yes | |
| CIS2018 | 2016-2018 | Yes |
*two reference periods can be distinguished for CIS light: 2000-2002 and 2001-2003
3.9. Base period
Not relevant.
CIS indicators are available according to 3 units of measure:
NR: Number for number of enterprises and number of persons employed.
THS_EUR: Thousands of euros. All financial variables are provided in thousands of euros, i.e. Turnover or Innovation expenditure.
PC: Percentage. The percentage is the ratio between the selected combinations of indicators.
For CIS 2018, the time covered by the survey is the 3-year period from the beginning of 2016 to the end of 2018.
Some questions and indicators refer to one year — 2018.
The list of indicators covering the 3-year period and referring to one year according to the HDC is available in the Annex section of the European metadata (ESMS).
6.1. Institutional Mandate - legal acts and other agreements
CIS surveys are based on the Commission Regulation No 995/2012, implementing Decision No 1608/2003/EC of the European Parliament and of the Council on the production and development of Community statistics on science and technology.
This Regulation establishes innovation statistics on a statutory basis and makes the delivery of certain variables compulsory e.g. innovation activities, cooperation, development, expenditures and turnover (see the Regulation). Each survey wave may additionally include further variables.
In addition, the Regulation defines the obligatory cross-coverage of economic sectors and size class of enterprises.
6.1.1. National legislation
There is no specific Czech legislation for the production of CIS statistics. The European Legislation applies.
The Law on Statistics of the Czech Republic is the main national legal act regarding official statistics. Production of CIS statistics as well as other official statistics is included in the annual Official Statistics Work Programme.
6.2. Institutional Mandate - data sharing
Not requested.
7.1. Confidentiality - policy
See the Framework Security Policy in tha annexed document.
Annexes:
the_czso_framework_security_policy
7.2. Confidentiality - data treatment
In producing the standard statistical outputs, a number of procedures were implemented to prevent the release of information that identified characteristics about an enterprise.
1) Modifying some of the data before the statistics were released.
2) Restricting the number of output categories into which a variable may be classified.
3) Where the number of enterprises in a group fell below a minimum threshold, the statistical output is not published.
The rule concerning the confidentiality applied for treating the tabular data is following: less than 3 enterprises or at least 85% of turnover for one enterprise.
8.1. Release calendar
The main indicators were released in a press release in April 2020.
All indicators (data) were published in the regular publication Innovation activities of enterprises during 2016-2018 in June 2020.
8.2. Release calendar access
https://www.czso.cz/csu/czso/catalogue-of-products
8.3. Release policy - user access
The CIS data are disseminated to all users through the Official Statistics Portal. The data are released simultaneously to all interested parties by issuing a news release. At the same time the news release is also e-mailed to the media. The news release is issued in Czech only. All published CIS data are available for users for free. Special datasets made ad hoc for researches/students are chargeable. Anonymized microdata are available at the Safe Centre of CZSO. The access to these microdata is paid.
Annexes:
diseminace csu_aj
CIS is conducted and disseminated at two-year interval in pair years.
Accessibility and clarity refer to the simplicity and ease for users to access statistics using simple and user-friendly procedure, obtaining them in an expected form and within an acceptable time period, with the appropriate user information and assistance: a global context which finally enables them to make optimum use of the statistics.
10.1. Dissemination format - News release
See below.
10.1.1. Availability of the releases
| Dissemination and access | Availability | Comments, links, ... |
| Press release | Yes | Only Czech version. https://www.czso.cz/csu/czso/inovuje-mene-nez-polovina-podniku |
| Access to public free of charge | Yes | Only Czech version. https://www.czso.cz/csu/czso/inovacni-aktivity-podniku-20162018 |
| Access to public restricted (membership/password/part of data provided, etc) | Yes | Only Czech version. |
10.2. Dissemination format - Publications
- Online database (containing all/most results) : No
- Analytical publication (referring to all/most results) : Yes : https://www.czso.cz/csu/czso/inovacni-aktivity-podniku-20162018
- Analytical publication (referring to specific results, e.g. only for one sector or one specific aspect) : No
10.3. Dissemination format - online database
Not available.
10.3.1. Data tables - consultations
Not requested.
10.4. Dissemination format - microdata access
Microdata are accessible only at the National SAFE centre and Eurostat SAFE centre.
10.4.1. Dissemination of microdata
| Mean of dissemination | Availability of microdata | Comments, links, ... |
| Eurostat SAFE centre | Yes | |
| National SAFE centre | Yes | https://www.czso.cz/csu/czso/statistical_data_for_scientific_research_purposes |
| Eurostat: partially anonymised data (SUF) | Yes | |
| National : partially anonymised data | No |
10.5. Dissemination format - other
No other means of dissemination.
10.5.1. Metadata - consultations
Not requested.
10.6. Documentation on methodology
The complete meta-information (methodology of survey, definition of variables) on the CIS is available for users on the website of CZSO.
https://www.czso.cz/csu/czso/statistika_inovaci
10.6.1. Metadata completeness - rate
Not requested.
10.7. Quality management - documentation
Quality related documents (quality reports, studies, etc) are not publicly available. Only selected indicators are published (e.g. overall non-response rate).
11.1. Quality assurance
See attached annex.
Annexes:
CZSO quality commitment
11.2. Quality management - assessment
Assessment of the quality uses the following components:
1) Standard STS compliance assessments carried out by Eurostat. This assessment is used internally as well.
2) Regular response rate measurement.
3) Regular methodological update and ad hoc methodological audit carried out every 10 years.
The overall quality of the national methodology is good. Improving of the national methodology regarding CIS and data quality is ongoing process in line with ICT development.
12.1. Relevance - User Needs
The CZSO primarily fulfils its commitments towards the European Commission, which represents the high priority user. However, depending on the capacity available the CZSO treats all the users equally.
The relevance of an instrument has to be assessed in the light of the needs of its users. As for EU Statistics on innovations in enterprises (CIS) the main users are the following:
1) Institutional users having access to aggregative data for policy-making;
2) Statistical users in Eurostat or in National Statistical Institutes to feed sectorial or transversal publications;
3) Researchers having access to microdata;
4) End users – including the media - interested in innovations in the EU area.
12.1.1. Needs at national level
| User group | Short description of user group | Main needs for CIS data of the user group Users’ needs |
| 1. Institutions - European level | The European Commission (DG ENTR) | Data used for the European Innovation Scoreboard and its further development |
| 1. Institutions - International organisations |
OECD | Data used for analyses |
| 1. Institutions - National level | Ministry of Industry and Trade | Data used for analyses (micro-data) |
| 1. Institutions - National level | R&D&I Council | Data used for analyses and policy making |
| 1. Institutions – Regional level |
Regional Innovation Agencies | Data used for analyses and policy making (regional innovation strategies) |
| 2. Social actors | Association of Innovative Entrepreneurship CR, Technology Center AS CR | Data used for analyses and research (using micro-data) |
| 3. Media | National and regional media | Data used for analyses |
| 4. Researchers and students | Center for Economic Research and Graduate Education – Economics Institute, Charles University, students | Data used for analyses and research |
12.2. Relevance - User Satisfaction
No user satisfaction survey is carried out exclusively for CIS indicators on the national level. However, CZSO is constantly in contact with different groups of users, e.g. Ministry of Industry and Trade, Czech National Bank, different associations, internal users etc. Formal meeting with users is organized regularly by the General Methodology Department. Data users are asked for a potential feedback if they receive data, publications or special outputs.
Every 5 years, CZSO organises the national user satisfaction survey. Last one was carried out in 2015.
12.3. Completeness
All compulsory CIS 2018 variables (expect for COOP_OTH) according to the Commission Regulation No 995/2012 are implemented.
12.3.1. Data completeness - rate
Not requested.
13.1. Accuracy - overall
Accuracy in the statistical sense denotes the closeness of computations or estimates to the exact or true values. Statistics are not equal with the true values because of variability (the statistics change from implementation to implementation of the survey due to random effects) and bias (the average of the possible values of the statistics from implementation to implementation is not equal to the true value due to systematic effects).
13.2. Sampling error
That part of the difference between a population value and an estimate thereof, derived from a random sample, which is due to the fact that only a subset of the population is enumerated.
13.2.1. Sampling error - indicators
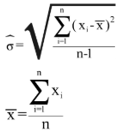
The main indicator used to measure sampling errors for CIS data is the coefficient of variation (CV).
Coefficient of Variation= (Square root of the estimate of the sampling variance) / (Estimated value)
Formula:
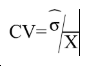
where
13.2.1.1. Coefficient of variations for key variables
Coefficient of variation (%) for key variables by NACE categories and for enterprises with 10 and more persons employed
[1] = Coefficient of variation for the percentage of innovative enterprises (INN) in the total population of enterprises (ENT18)
[2] = Coefficient of variation for the turnover of product innovative enterprises with new or improved products (TUR_PRD_NEW_MKT), as a percentage of total turnover of product innovative enterprises [TUR18,INNO_PRD].
[3] = Coefficient of variation for percentage of product and/or process innovative enterprises (incl. enterprises with abandoned and or on-going activities) involved in any innovation co-operation arrangement [COOP_ALL,INN], as a percentage of innovative enterprises (INN).
13.2.1.2. Variance estimation method
See the annex 1.
Annexes:
Variance estimation method
13.3. Non-sampling error
Non-sampling errors occur in all phases of a survey. They add to the sampling errors (if present) and contribute to decreasing overall accuracy. It is important to assess their relative weight in the total error and devote appropriate resources for their control and assessment.
13.3.1. Coverage error
Coverage errors (or frame errors) are due to divergences between the target population and the frame population. The frame population is the set of target population members that has a chance to be selected into the survey sample. It is a listing of all items in the population from which the sample is drawn that contains contact details as well as sufficient information to perform stratification and sampling.
13.3.1.1. Over-coverage - rate
Not requested.
13.3.1.2. Common units - proportion
Not requested.
13.3.1.3. Under covered groups of the target population
Because the corresponding list of units with the number social of insurance policyholders, is handed over with monthly periodicity with about a two-month delay after the end of the reference period, some coverage errors can occur at time of sampling.
13.3.1.4. Coverage errors in coefficient variation
The coefficient of variation reported under 13.2.1.1 incorporates the effects of coverage errors.
13.3.2. Measurement error
Measurement errors occur during data collection and generate bias by recording values different than the true ones. The survey questionnaire used for data collection may have led to the recording of wrong values, or there may be respondent or interviewer bias.
13.3.2.1. Measures for reducing measurement errors
Regarding overvalued innovation expenditure the following ratio is calculated as innovation expenditures in the given year/ turnover in the given year which should be lower than 1. Innovation expenditures on in-house research and development is also compared with research and development expenditures in Annual Research and Development Survey. A special training is organized for staff that process the questionnaires and transfer data from printed questionnaires to databases (data entry).
13.3.3. Non response error
Non response occurs when a survey fails to collect data on all survey variables from all the population units designated for data collection in a sample or complete enumeration.
There are two types of non-response:
1) Unit non-response, which occurs when no data (or so little as to be unusable) are collected about a population unit designated for data collection.
a) Un-weighted unit non-response rate (%) = 100*(Number of units with no response or not usable response) / (Total number of in-scope (eligible) units in the sample)
b) Weighted unit non-response rate (%) = 100*(Number of weighted units with no response or not usable response) / (Total number of in-scope (eligible) units in the sample)
2) Item non-response, which occurs when only data on some, but not all survey data items are collected about a population unit designated for data collection.
a) Un-weighted item non-response rate (%) = 100*(Number of units with no response at all for the item) / (Total number of eligible, for the item, units in the sample i.e. filters have to be taken into account)
The overall unit non-response rate is very good with low values. The weighted unit non-response rate and un-weighted unit non-response rate are both around 11 %.
No imputation regarding a non-responding unit is applied.
13.3.3.1. Unit non-response - rate
See below.
13.3.3.1.1. Un-weighted and weighted unit non-response rate by NACE categories and for enterprises with 10 or more employed persons
Un-weighted and weighted unit non-response rate by NACE categories and for enterprises with 10 or more persons employed
| NACE | Number of eligible units with no response | Total number of eligible units in the sample | Un-weighted unit non-response rate (%) | Weighted unit non-response rate (%) |
| Core NACE (B-C-D-E-46-H-J-K-71-72-73) | 683 | 6453 | 10.6 | 11.2 |
| Core industry (B_C_D_E - excluding construction) | 439 | 4266 | 10.3 | 11.2 |
| Core Services (46-H-J-K-71-72-73) | 244 | 2187 | 11.2 | 11.2 |
The number of eligible units is the number of sample units, which indeed belong to the target population.
13.3.3.1.2. Maximum number of recalls/reminders before coding
Two reminders are sent and also telephone follow-ups are carried out if it is needed.
13.3.3.2. Item non-response - rate
See below.
13.3.3.2.1. Item non-response rate for Turnover (in Core NACE: B-C-D-E-46-H-J-K-71-72-73 enterprises with 10 or more employed persons)
Item non-response rate for Turnover (in Core NACE: B-C-D-E-46-H-J-K-71-72-73 enterprises with 10 or more persons employed).
| Item non-response rate (un-weighted) | Imputation | If imputed, describe method used, mentioning which auxiliary information or stratification is used | |
| Turnover | Not surveyed | Partially | SBS and other yearly surveys turnovers used in item imputation for all unit. If there were no turnover values in these yearly surveys, they were imputed by use of administrative data. |
13.3.3.2.2. Item non response rate for new questions
Item non-response rate for new questions in CIS t (in Core NACE: B-C-D-E-46-H-J-K-71-72-73 enterprises with 10 or more persons employed)
| NEW QUESTIONS IN CIS 2018 | Inclusion in national questionnaire | Item non response rate (un-weighted) | Comments |
| 2.2 Customisation, Co-creation | No | ||
| 2.3 Partners in Customisation, Co-creation | No | ||
| 2.4 Turnover from Customisation, Co-creation | No | ||
| 2.7 Used patents and IRPs | Yes | 0% | |
| 2.8 Buying technical services | No | ||
| 2.9 Innovative Purchases | No | ||
| 2.10 Using information channels | No | ||
| 2.11 Organising work | No | ||
| 3.5 Expectations met (product innovation) | No | ||
| 3.8 Expectations met (business process innovation) | No | ||
| 4.8 Enterprise group: inflows and outflows | No | ||
| 4.6 Total expenditure | No |
13.3.4. Processing error
Main data entry methods are: data scanning or keying for the printed questionnaire (1/3 of all) and CASI/e-PDF for the electronic questionnaire (2/3 of all). The errors’ catching is maintained by programming tools which identify hard and soft errors. Programming tools find incomplete answers and warn of the given type of error. Errors which were found during this checking process are corrected manually.
Processing errors are not significant.
13.3.5. Model assumption error
Not requested.
Timeliness and punctuality refer to time and dates, but in a different manner.
14.1. Timeliness
The timeliness of statistics reflects the length of time between data availability and the event or phenomenon they describe.
14.1.1. Time lag - first result
Timeliness of national data – date of first release of national level : 16 months after the reference year
14.1.2. Time lag - final result
Not requested.
14.2. Punctuality
Punctuality refers to the time lag between the release date of data and the target date on which they were scheduled for release as announced officially.
14.2.1. Punctuality - delivery and publication
Date of transmission of complete and validated data to Eurostat (Number of days between that data and 30 June 2020) : 3 days
Comparability aims at measuring the impact of differences in applied statistical concepts and definitions on the comparison of statistics between geographical areas, non-geographical domains, or over time.
The coherence of statistical outputs refers to the degree to which the statistical processes by which they were generated used the same concepts (classifications, definitions, and target populations) and harmonised methods. Coherent statistical outputs have the potential to be validly combined and used jointly.
15.1. Comparability - geographical
No significant problems of comparability between regions at the level NUTS 2 of Czechia. The stratification of the sample is set to eliminate possible problems regarding comparability between regions at the NUTS 2.
Data collected by this survey are internationally comparable because this survey respects standards described in Oslo manual (OECD, 2018) and Commission Implementing Regulation (EU) No 995/2012 of 26 October 2012, laying down detailed rules for the implementation of Decision No 1608/2003/EC of the European Parliament and of the Council concerning the production and development of Community statistics on science and technology.
15.1.1. Asymmetry for mirror flow statistics - coefficient
Not requested.
15.1.2. National questionnaire – compliance with Eurostat model questionnaire
Methodological deviations from the CIS Harmonised Data Collection (HDC)
| Questions not included in national questionnaire compared to HDC | Comment |
| Q2.2, 2.3, 2.4, 2.8, 2.9, 2.10, 2.11, 3.5, 3.8, 3.11, 3.12, 3.17, 4.2, 4.4, 4.6, 4.8, 4.9 | |
| Q3.13 | Only options regarding public funds used for R&D or other innovation activities |
| Changes in the filtering compared to HDC | Comment |
15.1.3. National questionnaire – additional questions
Methodological deviations from the CIS Harmonised Data Collection (HDC)
| Additional questions in national questionnaire (not included in HDC) | Comment |
| Geographic markets where an enterprise sells goods and/or services | former question from CIS 2016 |
| Results/impacts of implemented product innovations | Yes/No options |
| Usage of technologies connected with Industry 4.0 | Yes/No options |
15.2. Comparability - over time
Due to important methodological changes in CIS 2018 driven by Oslo Manual 2018, the data 2018 cannot be directly compared with previous CIS waves.
15.2.1. Length of comparable time series
Not requested.
15.3. Coherence - cross domain
See the comparison between SBS and CIS data in the section 15.3.3 below.
15.3.1. Coherence - sub annual and annual statistics
Not requested.
15.3.2. Coherence - National Accounts
Not requested.
15.3.3. Coherence – Structural Business Statistics (SBS)
This part compares key variables for aggregated CIS data with SBS data
Definition of relative difference between CIS and SBS data: DIFF = (SBS/CIS)*100
Comparison between SBS and CIS data (relative difference) by NACE categories and for enterprises with 10 or more persons employed
| NACE | Size class | Number of enterprises (SBS/CIS)* | Number of persons employed (SBS/CIS)* | Total Turnover (SBS/CIS)* |
| Core NACE (B-C-D-E-46-H-J-K-71-72-73) | Total | 97.7 | 95.2 | 94.9 |
| Core industry (B_C_D_E - excluding construction) | Total | 98.7 | 100.1 | 99.9 |
| Core Services (46-H-J-K-71-72-73) | Total | 96.5 | 86.0 | 86.1 |
* Numbers are to be provided for the last year of the reference period (t)
15.4. Coherence - internal
Not requested.
Confidential information on the production cost of the CIS.
16.1. Cost
The assessment of costs associated with a statistical product is a rather complicated task since there must exist a mechanism for appointing portions of shared costs (for instance the business register or shared IT resources and dissemination channels) and overheads (office space, utility bills etc). The assessment must become detailed and clear enough so that international comparisons among agencies of different structures are feasible.
For measuring the cost on statistical offices, Eurostat proposes to make use of the following very short calculation, even if Eurostat is aware of the fact that such a measure may be complicated.
| Costs for the statistical authority | In thousands of national currency |
| Total cost (in thousand currency units) | N/A |
| Staff cost (in %) | N/A |
| Other direct cost (in %) | N/A |
| Overheads (in %) | N/A |
National currency used for this amount:
17.1. Data revision - policy
Not requested.
17.2. Data revision - practice
Not requested.
17.2.1. Data revision - average size
Not requested.
18.1. Source data
See below:
18.1.1. Sampling frame (or census frame)
The frame population is the same as the one for the Structural Business Survey (SBS). Following ESA 2010 sectors are included: S.11+S.12+S.141.
18.1.2. Sampling design
Sampling design is a combination of stratified random sampling (enterprises with 10-249 employees of selected two-digit NACE industries) and census (see 12.3.3). Two-digit NACE, NUTS2 and size-class according to the Business Register were used for stratification. The sample was designed with no reference to any other survey. Following ESA 2010 sectors are covered: S.11+S.12+S.141. The total number of strata is 1320 including special strata for units with unknown NACE.
18.1.3. Target population and sample size
| Sample/census indicator | Number of enterprises |
| Target population | 25525 |
| Sample | 6685 |
| In case of combination sample/census: | |
| Sampled units | 5124 |
| Enumerated units/census | 1561 |
| Overall sample rate (overall sample/target population) | 26% |
18.1.4. Data source for pre-filled variables
Variables and indicators filled or prefilled from other sources.
| Variables/Indicators | Source | Reference year |
| TAX_CRED_RNDINN | General Financial Directorate (GFD) - data from Corporate Income Tax returns | 2016-2018 |
18.1.5. Data source and variables used for derivation and weighting
| Item | Response |
| Data source used for deriving population totals |
Number of persons employed - SBS and other yearly business surveys
Total turnover - SBS and administrative tax data
|
| Variables used for weighting |
Number of persons employed - SBS and other yearly business surveys
Total turnover - SBS and administrative tax data
Number of enterprises in the sampling frame
Number of social security policyholder - from social security administrative data
|
18.2. Frequency of data collection
According to the Commission Regulation (UE) 995/2012, the innovation statistics shall be provided to Eurostat every two years in each even year. The data collection takes place every second year in year t-2 preceding the data provision.
18.3. Data collection
CZ-CIS survey in the Czech Republic is a combination of computer assisted filling in and paper questionnaires. There is a possibility for enterprises to fill in PDF format of questionnaire or online questionnaire available to fill in the special application especially developed for the purpose of this survey. Respondents receive instructions (via a message in their data mailbox) describing how to get the online questionnaire (computer assisted) or have an opportunity to download the online questionnaire from the CZSO website. We send paper questionnaires to enterprises that do not own data mailboxes (approximately 1000 enterprises a year). Paper questionnaires are sent and returned by post.
During the data collection, checking and processing period all received data are checked primarily by junior statisticians (secondary by the Project manager). Online questionnaires (computer assisted) includes all necessary consistency checks (controls). There are approximately 150 of them every year. Inconsistencies in controls notify junior statisticians of necessity to check answers. Phone calls are used for validation of the data (corrections) and quality improvement if necessary. The year-to-year checks in the aggregate data (before data delivery to Eurostat) are made.
No imputation for item non-response will be used except of imputation of some background information that will not be available in SBS database.
18.3.1. Survey participation
The survey is mandatory.
18.3.2. Survey type
Data are collected through the combination of a census and sample survey.
18.3.3. Combination of sample survey and census data
Covered by Census:
- Number of employees according to the Business Register >=250 of ALL CORE NACE
- Number of employees according to the Business Register =50-249 of NACE=5-9, 12, 19, 37, 39, 50-51, 53, 59-60
Covered by sample survey:
- Number of employees according to the Business Register =50-249 of NACE=10-11, 13-18, 20-36 , 38, 46, 49, 52, 58, 61-66, 71-73
- Number of employees according to the Business Register =10-49 of all NACE
18.3.4. Census criteria
Covered by Census:
- Number of employees according to the Business Register >=250 of ALL CORE NACE
- Number of employees according to the Business Register =50-249 of NACE=5-9, 12, 19, 37, 39, 50-51, 53, 59-60
18.3.5. Data collection method
Data collection method
| Survey method | Yes/No | Comment |
|---|---|---|
| Face-to-face interview | No | |
| Telephone interview | Yes | The telephone interview and email were used for checking and editing primary data. |
| Postal questionnaire | Yes | |
| Electronic questionnaire (format Word or PDF to send back by email) | Yes | e-PDF |
| Web survey (online survey available on the platform via URL) | Yes | |
| Other | - |
18.4. Data validation
Not requested.
18.5. Data compilation
Operations performed on data to derive new information according to a given set of rules.
18.5.1. Imputation - rate
Imputation is the method of creating plausible (but artificial) substitute values for all those missing.
Definition of imputation rate:
Imputation rate (for the variable x) (%) = 100*(Number of replaced values) / (Total number of values for a given variable)
Definition of weighted imputation rate:
Weighted imputation rate= 100*(Number of total weighted replaced values) / (Total number of weighted values for a given variable)
18.5.1.1. Imputation rate for metric variables
Imputation rate for metric variables by NACE categories and for enterprises with 10 or more persons employed:
| NACE | Size class | Total Turnover (1) | Turnover from products new to the market (2) | R&D expenditure in-house (3) | |||
| Unweighted | Weighted | Unweighted | Weighted | Unweighted | Weighted | ||
| Core NACE (B-C-D-E-46-H-J-K-71-72-73) | Total | 0 | 0 | 0 | 0 | 0 | 0 |
| Core industry (B_C_D_E - excluding construction) | Total | 0 | 0 | 0 | 0 | 0 | 0 |
| Core Services (46-H-J-K-71-72-73) | Total | 0 | 0 | 0 | 0 | 0 | 0 |
(1) = Total turnover in the last year of the reference period (t) (TUR)
(2) = Share of the turnover in the last year of the reference period (t) due to new or improved product new to the market in the total turnover for product innovative enterprises TUR_PRD_NEW_MKT/TUR(INNO_PRD)
(3) = R&D expenditure performed in-house (EXP_INNO_RND_IH)
18.5.2. Weights calculation
Weights calculation method for sample surveys
| Method | Selected applied method | Comments |
| Inverse sampling fraction | ||
| Non-respondent adjustments | ||
| Other | GREG estimators (calibration method) |
The starting weights are calibrated in 3 stages to treat non-response and provide more accurate and coherent estimates:
+ stage 1: weight are adjusted to preserve estimated totals of units and number of social security policyholders in the strata.
+ stage 2: weight from the previous are adjusted to preserve estimated totals of units and number of employees in the strata.
+ stage 3: weight from the previous are adjusted to preserve estimated totals of units and turnover in the strata
|
18.6. Adjustment
No procedures employed to modify statistical data are applied.
18.6.1. Seasonal adjustment
Not relevat for yearly data.
The Community Innovation Survey (CIS) is a survey about innovation activities in enterprises. The survey is designed to collect the information on different types of innovation, various aspects of the development of an innovation, objectives of innovation activities, sources of information, public funding or expenditure on innovation. It is aim is to measure the innovativeness of sectors and enable the analysis of the factors of innovation.
The CIS provides statistics by type of innovators, economic activities and size class of enterprises. The survey is currently carried out every two years across the EU Member States, EFTA countries and EU candidate countries.
In order to ensure comparability across countries, Eurostat together with the countries developed a Harmonised Data Collection (HDC) questionnaire accompanied by a set of definitions and methodological recommendations.
CIS 2018 concepts and its underlying methodology are based on the Oslo Manual (2018) 4th Edition.
New review of the CIS2018 aims to meet several objectives :
1: Reduce subjectivity and biases in the main CIS indicators
2: Improve reporting about innovation activities and capabilities in the firm
3: Ensure international comparability (including compliance with the OM4)
4: Broaden the basis CIS information on enterprise management
5: Take better account the diversity of enterprises in the EU
6: Improve reporting about external drivers and enablers of innovation
7: Improve timeliness
8: Ensure the feasibility of data collection
9: Ensure continuity with the CIS 2016
10: Improve reporting about the output and impact of innovation
CIS2018 is conducted under Commission Regulation No 995/2012. This Regulation defines the mandatory target population of the survey referring to enterprises in the Core NACE economic sectors (see section 3.3.) with at least 10 employees. Further activities may be covered on a voluntary basis in national datasets. Most statistics are based on the 3-year reference period (t, t-1, t-2), but some use only one calendar year (t or t-2).
Please consider CIS t to be the survey that refers to the same year of the quality report and CIS t-2 to be the previous survey e.g.: CIS 2018= CIS t then, CIS t-2=CIS 2016
The description of concepts, definitions and main statistical variables is available in CIS 2018 European metadata file (ESMS) Results of the community innovation survey 2018 (CIS2018) (inn_cis11) in Eurostat database.
The statistical unit is an enterprise which corresponds to the legal unit with the identification number given by the Business Register.
Core target population are all enterprises in CORE NACE activities (see 3.3.1) with 10 or more employed persons.
The geographic area to which the measured statistical phenomenon relates is Czechia (NUTS1) for all variables (data) and NUTS2 for selected (main) variables (data).
For CIS 2018, the time covered by the survey is the 3-year period from the beginning of 2016 to the end of 2018.
Some questions and indicators refer to one year — 2018.
The list of indicators covering the 3-year period and referring to one year according to the HDC is available in the Annex section of the European metadata (ESMS).
Accuracy in the statistical sense denotes the closeness of computations or estimates to the exact or true values. Statistics are not equal with the true values because of variability (the statistics change from implementation to implementation of the survey due to random effects) and bias (the average of the possible values of the statistics from implementation to implementation is not equal to the true value due to systematic effects).
CIS indicators are available according to 3 units of measure:
NR: Number for number of enterprises and number of persons employed.
THS_EUR: Thousands of euros. All financial variables are provided in thousands of euros, i.e. Turnover or Innovation expenditure.
PC: Percentage. The percentage is the ratio between the selected combinations of indicators.
Operations performed on data to derive new information according to a given set of rules.
See below:
CIS is conducted and disseminated at two-year interval in pair years.
The timeliness of statistics reflects the length of time between data availability and the event or phenomenon they describe.
No significant problems of comparability between regions at the level NUTS 2 of Czechia. The stratification of the sample is set to eliminate possible problems regarding comparability between regions at the NUTS 2.
Data collected by this survey are internationally comparable because this survey respects standards described in Oslo manual (OECD, 2018) and Commission Implementing Regulation (EU) No 995/2012 of 26 October 2012, laying down detailed rules for the implementation of Decision No 1608/2003/EC of the European Parliament and of the Council concerning the production and development of Community statistics on science and technology.
Due to important methodological changes in CIS 2018 driven by Oslo Manual 2018, the data 2018 cannot be directly compared with previous CIS waves.