|
Will Steffen (WS) and Katherine Richardson (KR) were lead authors of the 2015 research paper “Planetary Boundaries: Guiding Human Development on a Changing Planet”. Professor Will Steffen is a chemist and climate change expert working at the Climate Change Institute of the Australian National University, Canberra. He has served a number of other positions, including as Scientific Advisor to the Australian Climate Commission. Katherine Richardson is Professor of Biological Oceanography at the University of Copenhagen. She was Chairman of the Danish Commission on Climate Change Policy and is currently a member of the Climate Council of Denmark. Her work focuses on the interactions between biological processes and global carbon cycle.
The planetary boundaries (PB) concept was first introduced in 2009 and has become highly influential in developing thinking, including the Sustainable Development Goals. The aim of the PB work is to define the environmental limits within which humanity can safely operate.
How can the PB concept be explained in simple terms?
KR: People get rich by exploiting the Earth’s resources. The currency we use to measure wealth is money and we know how much money we have to use. We cannot use more than we have or alternatively we can borrow against what we would be able to pay back. However, our currency should in reality be expressed in terms of natural resources, to be aware about resource availability and the amount of them we can use. The PB framework is aimed at identifying the consumption limits beyond which human pressures on the environment may become detrimental to the further development of human societies.
How is the PB approach related to the precautionary principle and the Club of Rome work on Limits to Growth?
WS: It is close to the precautionary principle, but it is explicitly global in its scale. The precautionary principle has often been applied at local scale to pollution and contamination issues, for example linked to organic compounds. For these, the concentration thresholds above which there could be significant risks for humans have not been precisely defined yet, so the precautionary principle can contribute to identifying safe limits.
In our approach, we try to expand the principle at global scale, for the planet as a whole. Since there are uncertainties over the impact of exposing the earth system to increasing pressures, the precautionary principle would suggest that remaining below certain limits be the safest option.
Regarding the Limits to Growth approach, there are no clear similarities, since it is normative. In the PB approach, there are no judgements of potential policy options, so long as they respect the boundaries.
KR: With the possible exception of phosphate, we are not referring to resources running out in the sense of limits to growth. We are instead considering the risk of human activities changing the way the Earth System operates. In the last 12,000 years, the Earth's climate has been unusually stable. This guaranteed humankind's evolution, mainly through the development of agriculture and cultivation.
Is it possible to disaggregate such a global framework to local or regional levels?
KR: The global approach does not replace the local and the regional one. For instance, from an environmental management perspective, people started to take decisions locally about reducing pollution in their water systems or limiting deforestation. Then they realised that their decisions had to be aligned with those of their neighbours, who also shared the same needs to effectively manage their environment and resources.
Something analogous is now happening for climate and other boundaries, for which there is growing awareness about the need for a global management. The PB approach provides a useful framework designed for that global management. The same framework needs nevertheless to be respected at a regional and local level. This is necessary, since recognising the existence of boundaries inevitably implies to define how to share the access to available resources amongst an increasing world population. By bringing it down to an average use at some sort of relevant scale, definitions become undeniably political and inequalities are more like to emerge.
An international agreement is in place for climate change. Is there sufficiently robust evidence to develop something similar for the other boundaries?
KR: It depends on the specific case. In the scientific literature, several attempts have been made to identify how much reactive nitrogen we can safely emit to the environment. Additionally, the level of ocean acidification is determined by the atmospheric CO2, so climate goals (i.e. maintaining global warming to below two degrees C) are also relevant for this boundary.
WS: The main limiting factors are governance and concrete action, not the absence of evidence.
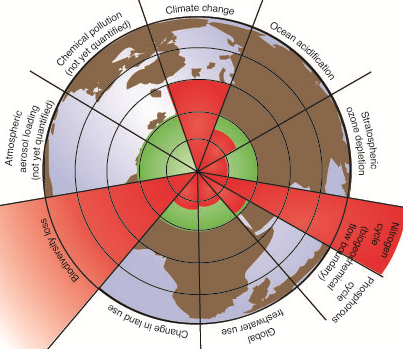
Source: Stockholm Resilience Centre / Stockholm University (2015) Planetary boundaries
Is it always necessary to have an international agreement? Cannot some of these issues, such as phosphorus and nitrogen concentrations, be dealt with locally even if their impacts are global?
WS: It is not always necessary. For example, if we consider large agricultural areas, four regions in the world are causing the main problems due to the nitrogen and phosphorous concentrations there. The central US Great Plains area, Western Europe, the Indo-Gangetic plain and the northern China agricultural plain are responsible for 90% of exceedances. Nitrogen zoning in those areas and redistribution to those areas of the world, such as Africa, where boundaries are respected or where there is even a lack of nitrogen, would go a long way to addressing the issue. The same is true for climate change. Should the top 10 to 15 emitting nations change their practices, this would have a huge impact.
KR: Another important issue is related to measurement. For climate change, the regulation in place covers emissions. However, since the quantity of carbon emitted corresponds to that taken out of the ground, an alternative option would be to measure and regulate extraction. Since good methods to measure nitrogen emissions are not available, it might be necessary to regulate the production of fertilizers. However, this would not be easy to do.
We have already spoken about the links between the PB, resource extraction and wealth, but how can human well-being be incorporated into the framework?
KR: The PB approach, being a description of the Earth System functioning, does not and cannot directly take into account human activities and wellbeing. Nevertheless, the conclusions that can be derived from this approach allow developing relevant considerations on both human activities and wellbeing. Being aware about the existence of limited resources and ecosystem services inevitably leads us to think about how to guarantee a fair access to the resources/ecosystems services at both local and global scales.
Do you think the PB approach contradicts economic policies promoting economic growth and consumption?
KR: The PB approach is not incompatible per se with economic growth and consumption. It is incompatible with the waste and throwaway culture predominant in developed economies. Different production and consumption patterns could instead reduce human pressures on the environment. A more circular economy based on repairing and reusing manufactured goods produced to last would help to reduce resource extraction.
Has the PB framework been integrated into any frameworks for statistical monitoring or reporting?
KR: The United Nations Sustainable Development Goals have been inspired by the PB concept and in some cases they are directly rooted on it. I was for instance actively involved into the development of Goal 14 (“Conserve and sustainably use the oceans, seas and marine resources for sustainable development”). In this case, marine resources protection does not only describe their economic value.
Moreover, the planetary-boundaries concept has been recognised and used in a number of international fora, such as the debate around “Beyond GDP”, the World Economic Forum, the United Nations and the World Business Council.
Are you planning any follow up work for the PB?
WS: One relevant limit of the concept is the lack of a truly systemic view. Different boundaries are separately considered, while the Earth is instead a complex system in which many sub-systems interact with each other. For example, although the available scientific knowledge is still limited, exceeding global warming boundaries is extremely likely to induce chain reactions impacting on other relevant boundaries. Therefore, some fundamental questions still remain unanswered and, yes, we are considering these.
|

 Twitter
 Youtube


 indicator system")


